| Param | Original file | Final file |
|---|---|---|
| Filename | modeM0/AS1A08_008T01_9000003596_24378cztM0_level2.evt | modeM0/AS1A08_008T01_9000003596_24378cztM0_level2_quad_clean.evt |
| Size (bytes) | 517,703,040 | 88,125,120 |
| Size | 493.7 MB | 84.0 MB |
| Events in quadrant A | 3,144,386 | 559,221 |
| Events in quadrant B | 3,374,051 | 571,048 |
| Events in quadrant C | 4,198,078 | 544,607 |
| Events in quadrant D | 4,503,653 | 522,631 |
| Mode SS | |||
|---|---|---|---|
| Quadrant | BADHDUFLAG | Total packets | Discarded packets |
| A | 0 | 136 | 0 |
| B | 0 | 136 | 0 |
| C | 0 | 136 | 0 |
| D | 0 | 136 | 0 |
| Mode M0 | |||
|---|---|---|---|
| Quadrant | BADHDUFLAG | Total packets | Discarded packets |
| A | 0 | 13684 | 1 |
| B | 0 | 13999 | 1 |
| C | 0 | 16690 | 2 |
| D | 0 | 17740 | 1 |
| Mode M9 | |||
|---|---|---|---|
| Quadrant | BADHDUFLAG | Total packets | Discarded packets |
| A | 0 | 10 | 0 |
| B | 0 | 10 | 0 |
| C | 0 | 10 | 0 |
| D | 0 | 10 | 0 |
| Quadrant | Total seconds | Saturated seconds | Saturation percentage |
|---|---|---|---|
| A | 6762 | 8 | 0.118308% |
| B | 6763 | 35 | 0.517522% |
| C | 6762 | 105 | 1.552795% |
| D | 6762 | 320 | 4.732328% |
Noise dominated data is calculated using 1-second bins in cleaned event files. If a bin has >2000 counts, and if more than 50% of those come from <1% of pixels, then it is considered to be noise-dominated and hence unusable.
| Quadrant | # 1 sec bins | Bins with >0 counts | Bins with >2000 counts | High rate bins dominated by noise | Noise dominated (total time) | Noise dominated (detector-on time) | Marked lightcurve |
|---|---|---|---|---|---|---|---|
| A | 7702 | 6763 | 0 | 0 | 0.00% | 0.00% | 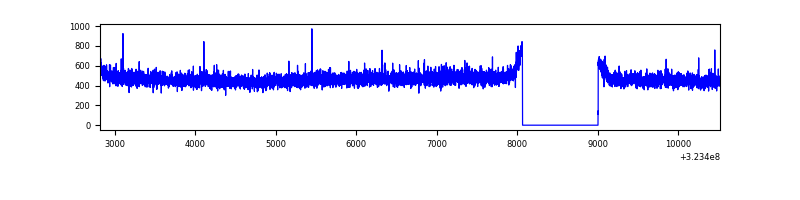 |
| B | 7703 | 6764 | 2 | 2 | 0.03% | 0.03% | 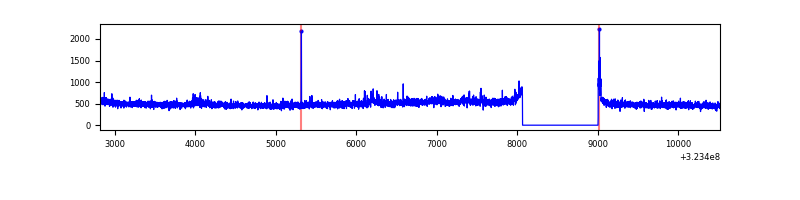 |
| C | 7702 | 6763 | 19 | 19 | 0.25% | 0.28% | 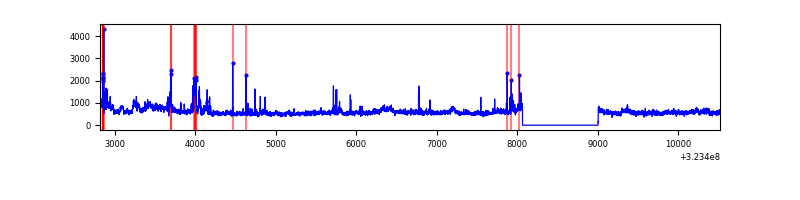 |
| D | 7702 | 6763 | 255 | 255 | 3.31% | 3.77% | 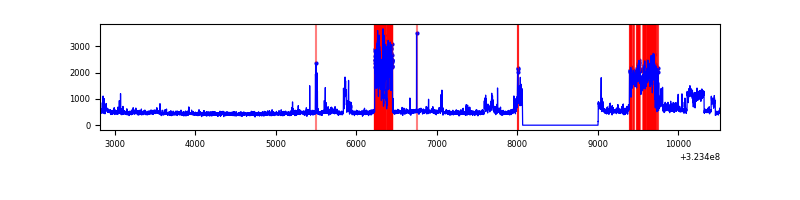 |
Top three noisy pixels from each quadrant. If the there are fewer than three noisy pixels in the level2.evt file, extra rows are filled as -1
| Pixel properties | Quadrant properties | ||||||
|---|---|---|---|---|---|---|---|
| Quadrant | DetID | PixID | Counts | Sigma | Mean | Median | Sigma |
| A | 13 | 254 | 11670 | 66.22 | 815 | 797 | 164.2 |
| A | 3 | 137 | 6986 | 37.69 | 815 | 797 | 164.2 |
| A | 0 | 226 | 6799 | 36.55 | 815 | 797 | 164.2 |
| B | 4 | 200 | 150457 | 982.75 | 818 | 798 | 152.3 |
| B | 12 | 111 | 18318 | 115.05 | 818 | 798 | 152.3 |
| B | 11 | 111 | 16503 | 103.13 | 818 | 798 | 152.3 |
| C | 2 | 16 | 565537 | 3116.61 | 787 | 793 | 181.2 |
| C | 7 | 247 | 432920 | 2384.75 | 787 | 793 | 181.2 |
| C | 14 | 238 | 129271 | 709.02 | 787 | 793 | 181.2 |
| D | 9 | 35 | 719348 | 3847.89 | 780 | 756 | 186.7 |
| D | 1 | 52 | 582696 | 3116.15 | 780 | 756 | 186.7 |
| D | 12 | 233 | 84283 | 447.27 | 780 | 756 | 186.7 |
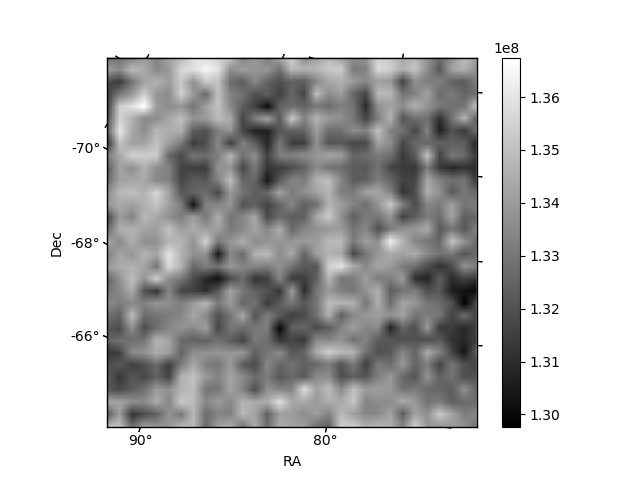
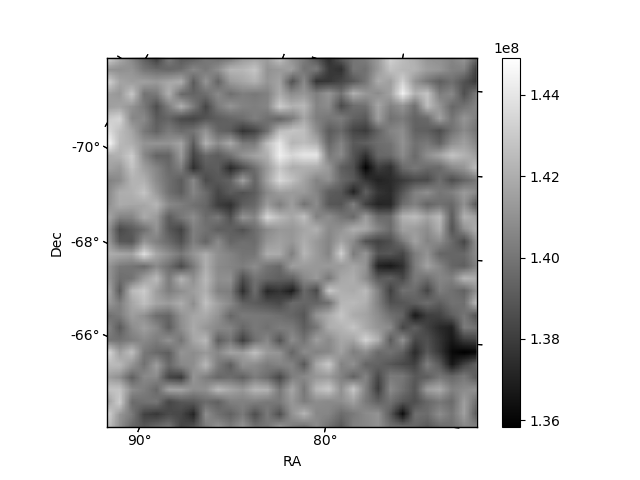
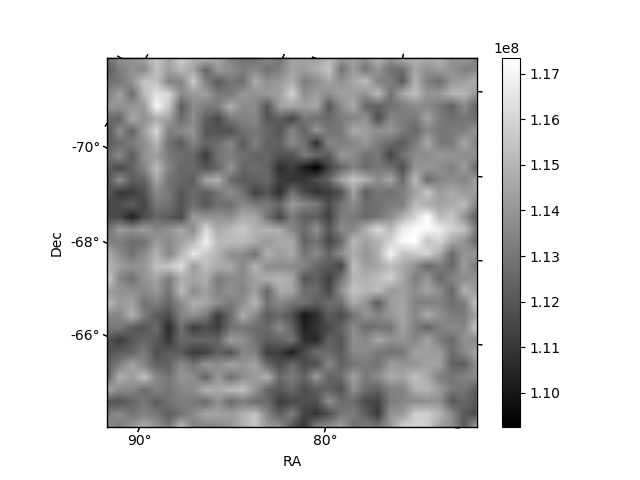
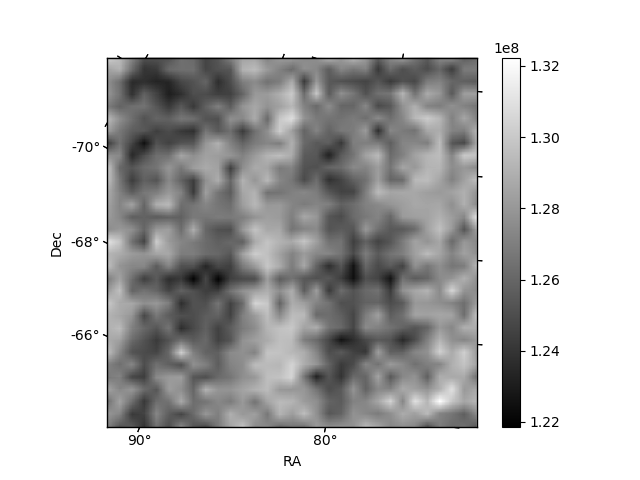
Histogram calculated using DETX and DETY for each event in the final _common_clean file
| Quadrant A |  |
 |
Quadrant B |
|---|---|---|---|
| Quadrant D |  |
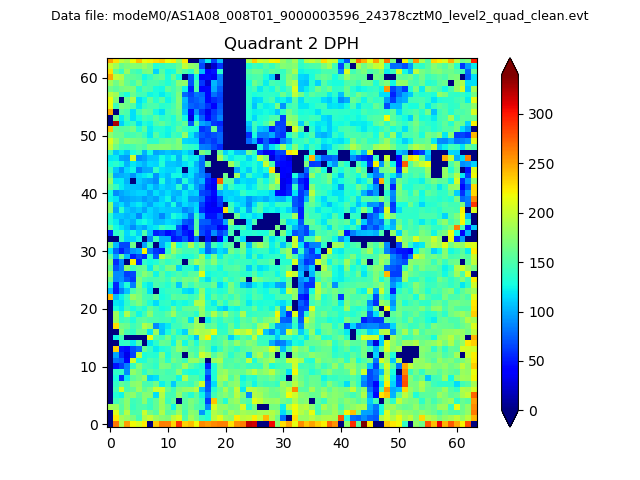 |
Quadrant C |
| Plot type | Count rate plots | Images |
|---|---|---|
| Comparison with Poisson distribution Blue bars denote a histogram of data divided into 1 sec bins. Red curve is a Poisson curve with rate = median count rate of data. |
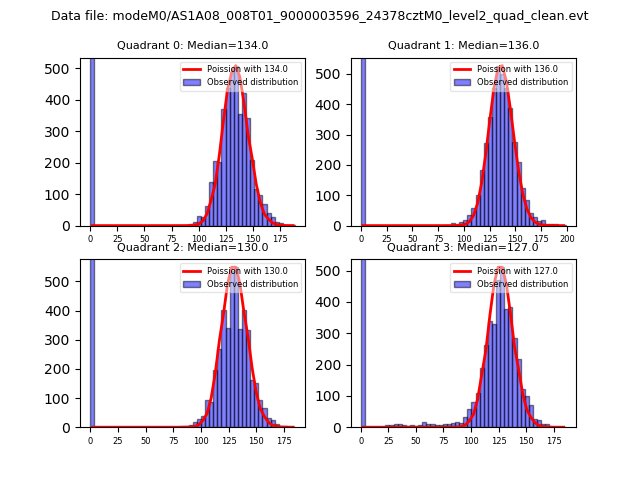 |
 |
| Quadrant-wise count rates Data is divided into 100 sec bins |
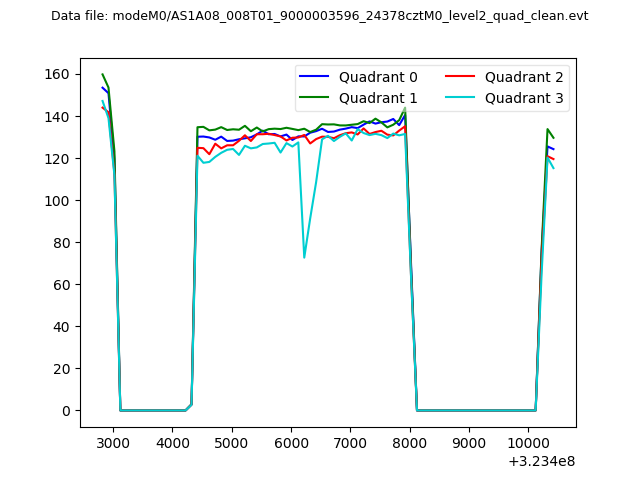 |
|
| Module-wise count rates for Quadrant A Data is divided into 100 sec bins |
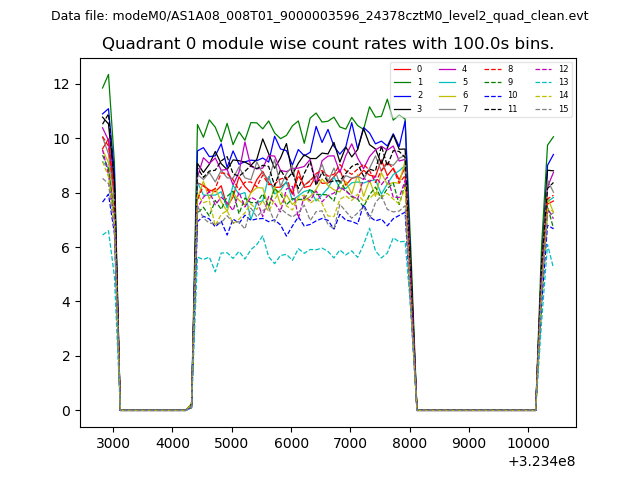 |
 |
| Module-wise count rates for Quadrant B Data is divided into 100 sec bins |
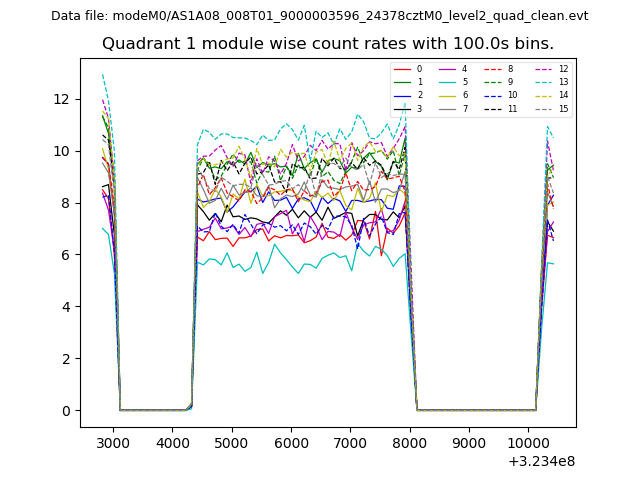 |
 |
| Module-wise count rates for Quadrant C Data is divided into 100 sec bins |
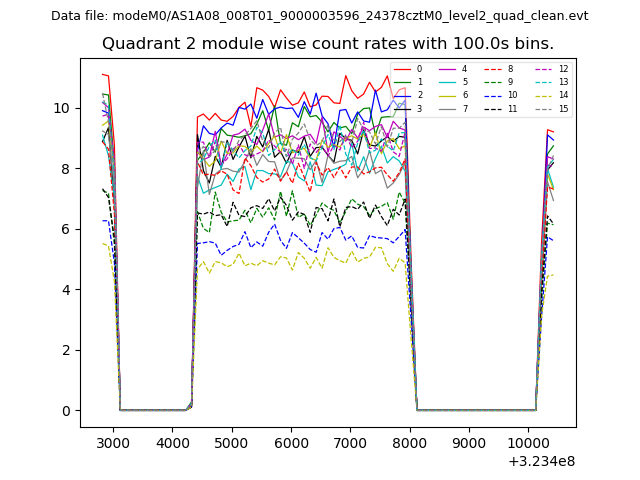 |
 |
| Module-wise count rates for Quadrant D Data is divided into 100 sec bins |
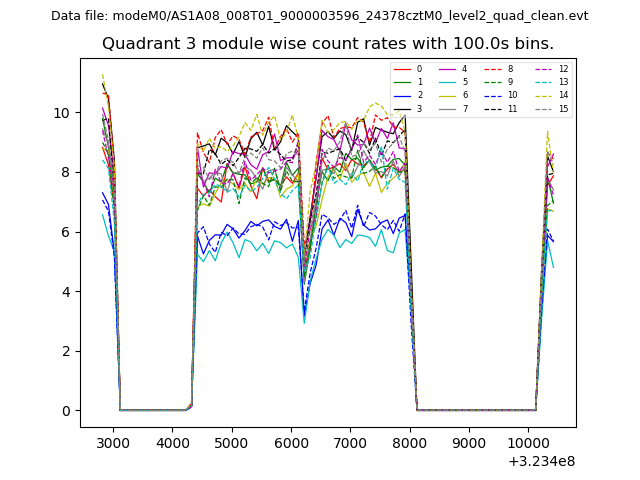 |
 |
| Parameter | Plot |
|---|---|
| CZT HV Monitor | 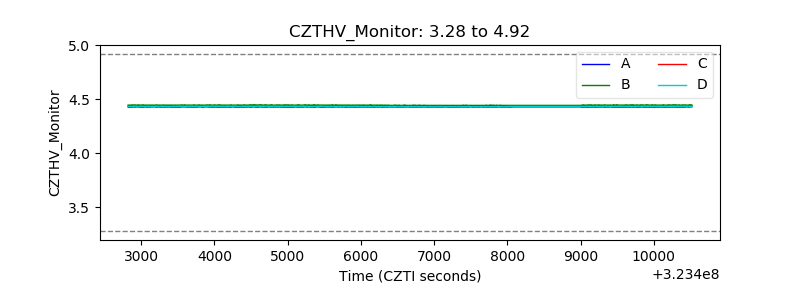 |
| D_VDD | 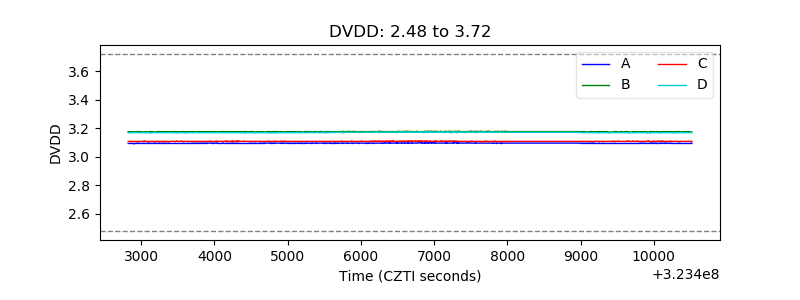 |
| Temperature 1 | 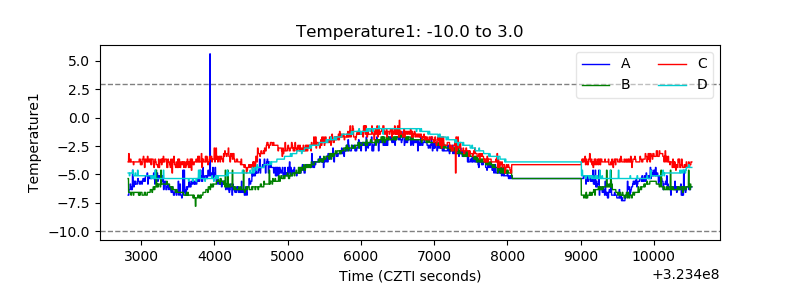 |
| Veto HV Monitor | 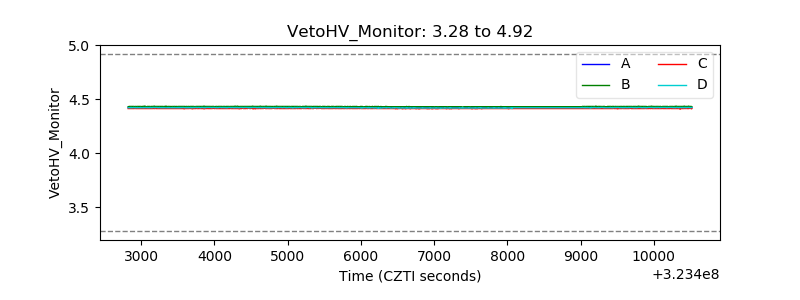 |
| Veto LLD | 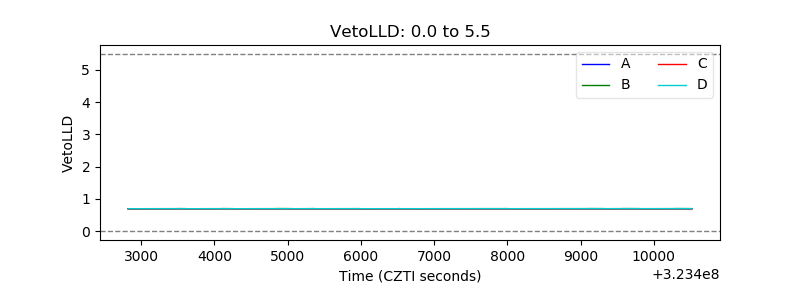 |
| Alpha Counter | 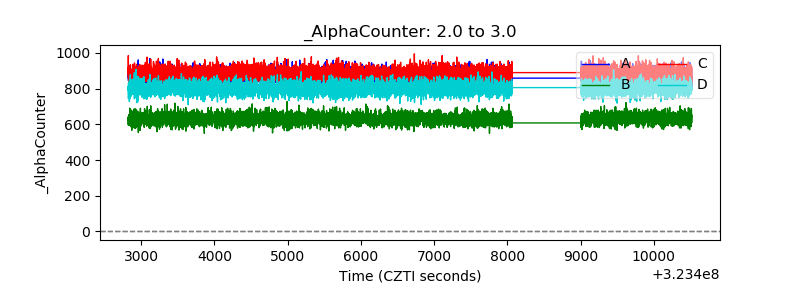 |
| _CPM_Rate | 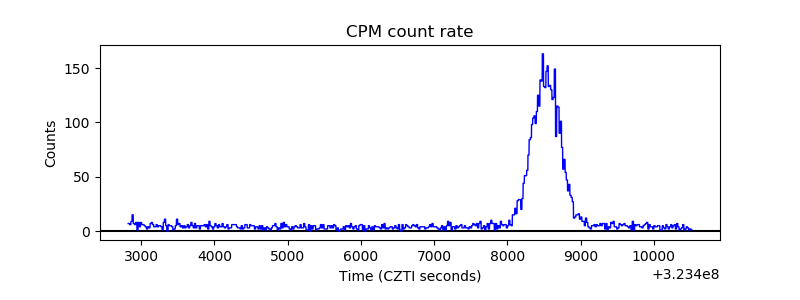 |
| CZT Counter | 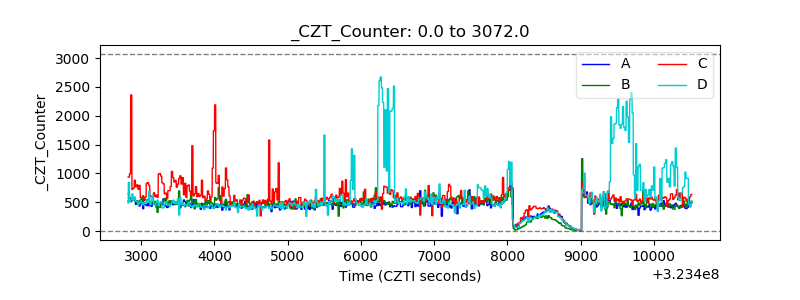 |
| +2.5 Volts monitor |  |
| +5 Volts monitor | 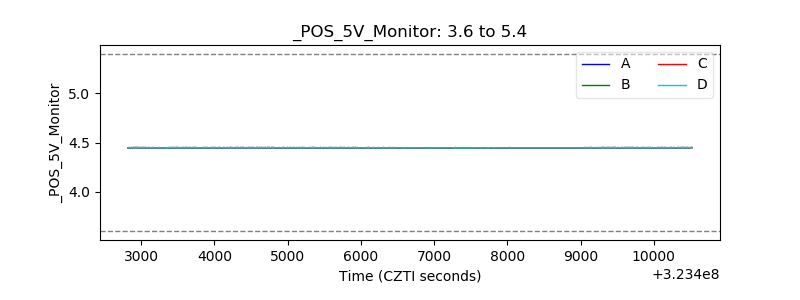 |
| _ROLL_ROT | 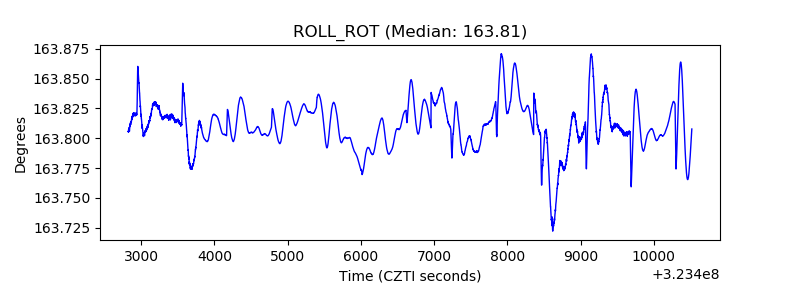 |
| _Roll_DEC | 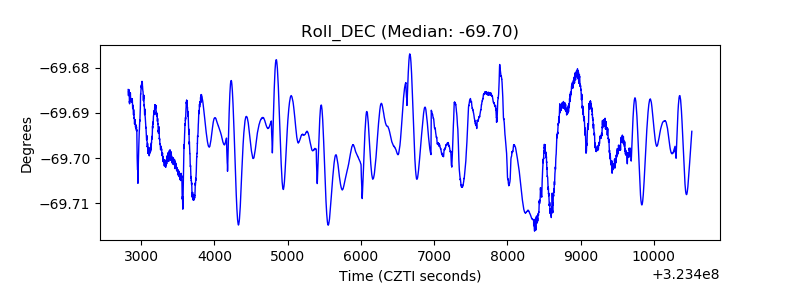 |
| _Roll_RA | 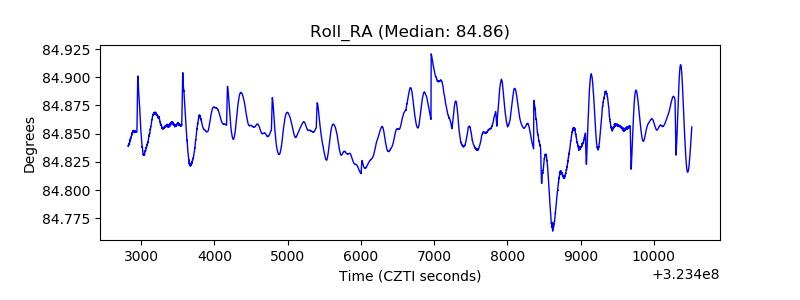 |
| Veto Counter | 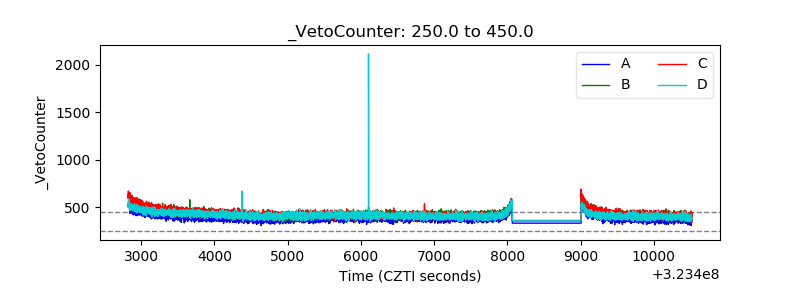 |