| Param | Original file | Final file |
|---|---|---|
| Filename | modeM0/AS1A08_008T01_9000003596_24381cztM0_level2.evt | modeM0/AS1A08_008T01_9000003596_24381cztM0_level2_quad_clean.evt |
| Size (bytes) | 522,538,560 | 111,939,840 |
| Size | 498.3 MB | 106.8 MB |
| Events in quadrant A | 3,154,607 | 737,375 |
| Events in quadrant B | 3,210,452 | 754,591 |
| Events in quadrant C | 5,007,217 | 709,681 |
| Events in quadrant D | 3,984,583 | 707,533 |
| Mode SS | |||
|---|---|---|---|
| Quadrant | BADHDUFLAG | Total packets | Discarded packets |
| A | 0 | 138 | 0 |
| B | 0 | 138 | 0 |
| C | 0 | 138 | 0 |
| D | 0 | 138 | 0 |
| Mode M0 | |||
|---|---|---|---|
| Quadrant | BADHDUFLAG | Total packets | Discarded packets |
| A | 0 | 14010 | 1 |
| B | 0 | 14073 | 1 |
| C | 0 | 20181 | 2 |
| D | 0 | 16221 | 1 |
| Mode M9 | |||
|---|---|---|---|
| Quadrant | BADHDUFLAG | Total packets | Discarded packets |
| A | 0 | 4 | 0 |
| B | 0 | 4 | 0 |
| C | 0 | 4 | 0 |
| D | 0 | 4 | 0 |
| Quadrant | Total seconds | Saturated seconds | Saturation percentage |
|---|---|---|---|
| A | 6911 | 101 | 1.461438% |
| B | 6911 | 112 | 1.620605% |
| C | 6910 | 270 | 3.907381% |
| D | 6910 | 104 | 1.505065% |
Noise dominated data is calculated using 1-second bins in cleaned event files. If a bin has >2000 counts, and if more than 50% of those come from <1% of pixels, then it is considered to be noise-dominated and hence unusable.
| Quadrant | # 1 sec bins | Bins with >0 counts | Bins with >2000 counts | High rate bins dominated by noise | Noise dominated (total time) | Noise dominated (detector-on time) | Marked lightcurve |
|---|---|---|---|---|---|---|---|
| A | 7241 | 6912 | 0 | 0 | 0.00% | 0.00% |  |
| B | 7241 | 6912 | 0 | 0 | 0.00% | 0.00% | 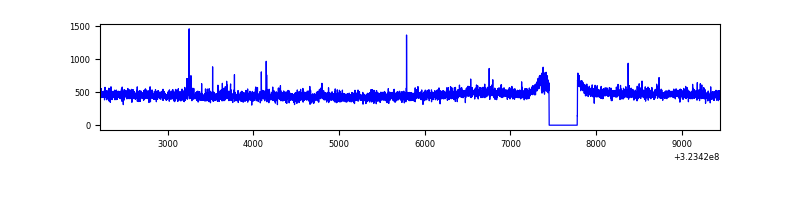 |
| C | 7240 | 6911 | 60 | 60 | 0.83% | 0.87% | 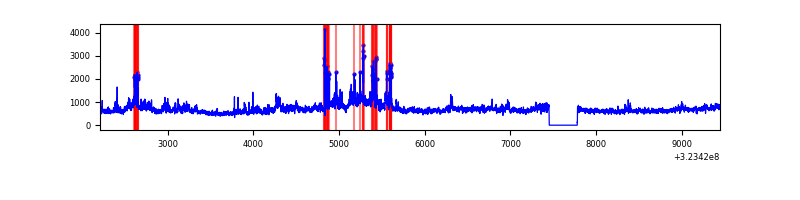 |
| D | 7240 | 6911 | 17 | 17 | 0.23% | 0.25% | 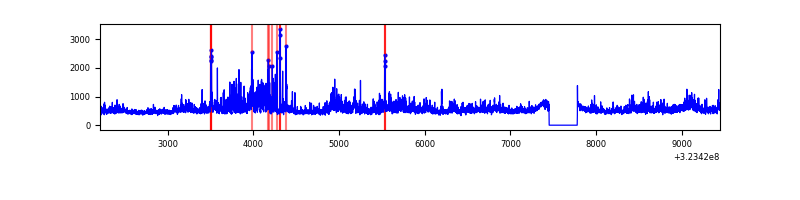 |
Top three noisy pixels from each quadrant. If the there are fewer than three noisy pixels in the level2.evt file, extra rows are filled as -1
| Pixel properties | Quadrant properties | ||||||
|---|---|---|---|---|---|---|---|
| Quadrant | DetID | PixID | Counts | Sigma | Mean | Median | Sigma |
| A | 13 | 254 | 10594 | 59.26 | 818 | 798 | 165.3 |
| A | 3 | 137 | 7529 | 40.72 | 818 | 798 | 165.3 |
| A | 0 | 226 | 7004 | 37.54 | 818 | 798 | 165.3 |
| B | 12 | 111 | 19209 | 117.57 | 814 | 791 | 156.7 |
| B | 11 | 111 | 17391 | 105.97 | 814 | 791 | 156.7 |
| B | 14 | 111 | 15285 | 92.52 | 814 | 791 | 156.7 |
| C | 7 | 247 | 1595385 | 8769.7 | 783 | 786 | 181.8 |
| C | 2 | 16 | 213251 | 1168.48 | 783 | 786 | 181.8 |
| C | 14 | 238 | 125848 | 687.79 | 783 | 786 | 181.8 |
| D | 8 | 195 | 583129 | 3006.73 | 801 | 775 | 193.7 |
| D | 12 | 233 | 247769 | 1275.24 | 801 | 775 | 193.7 |
| D | 1 | 52 | 78435 | 400.96 | 801 | 775 | 193.7 |
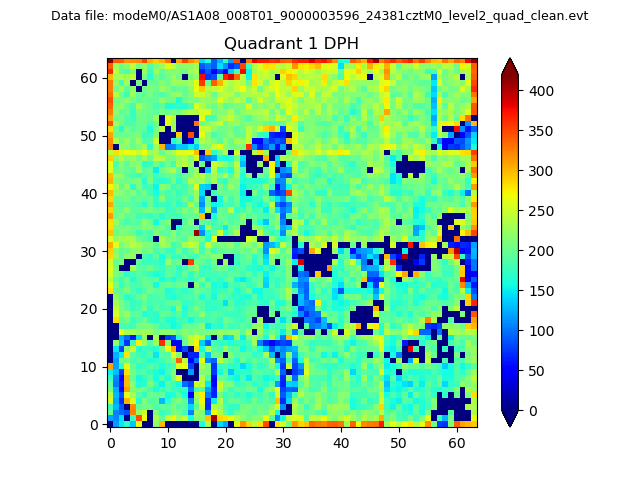
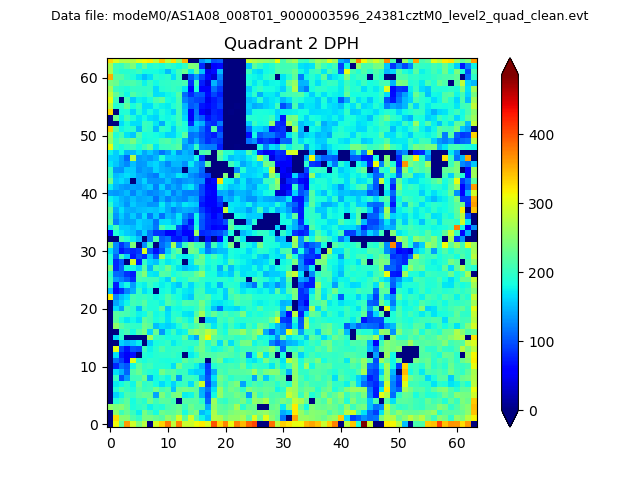
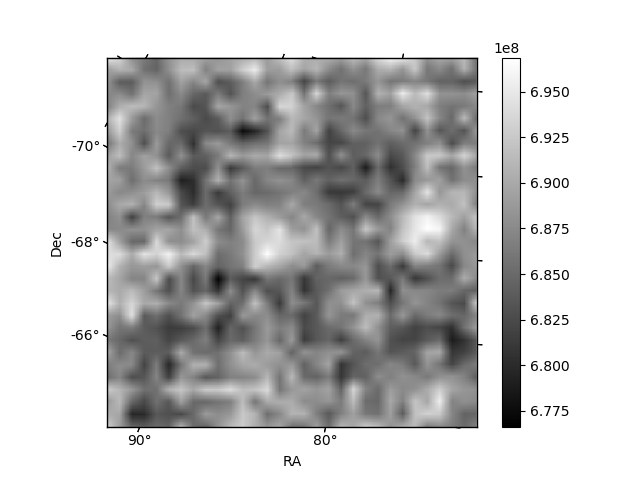
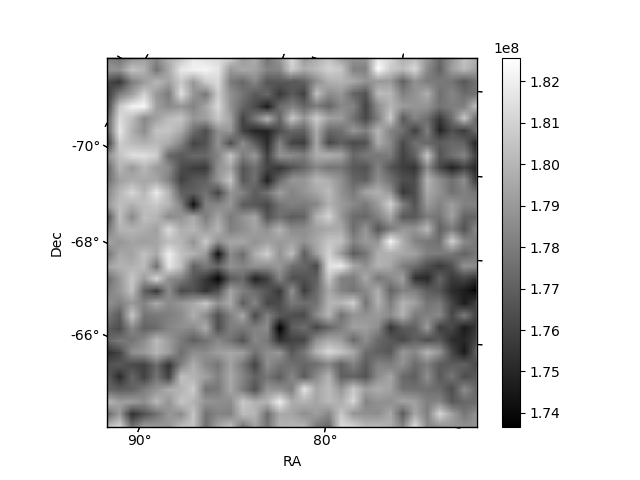
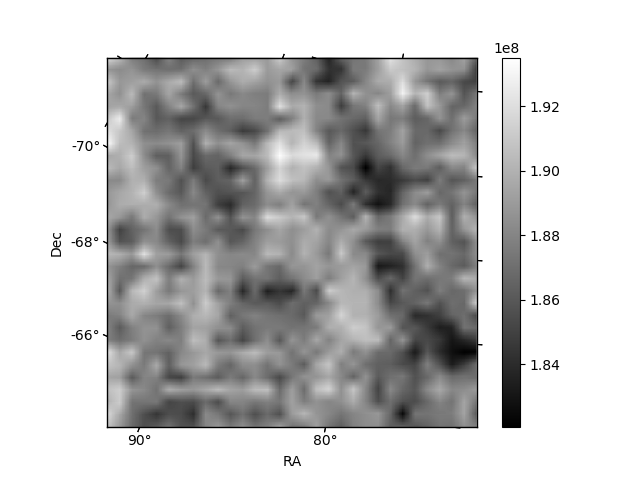
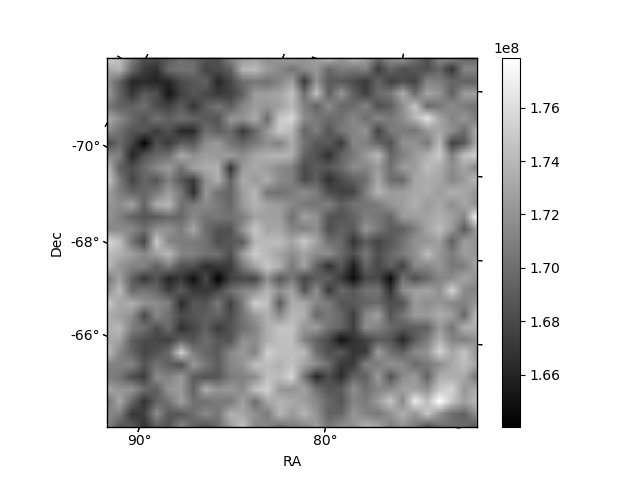
Histogram calculated using DETX and DETY for each event in the final _common_clean file
| Quadrant A | 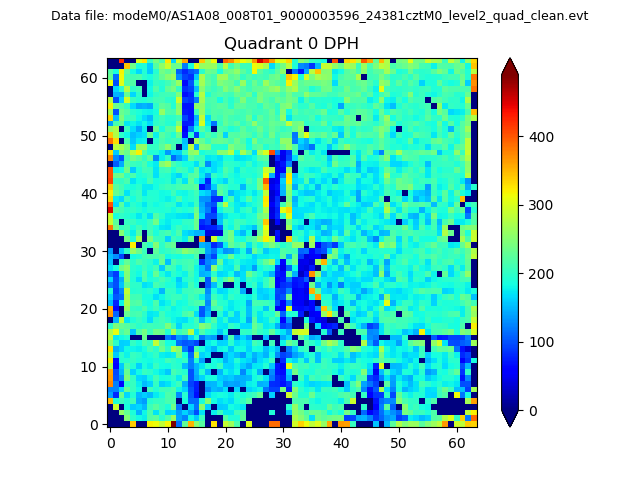 |
 |
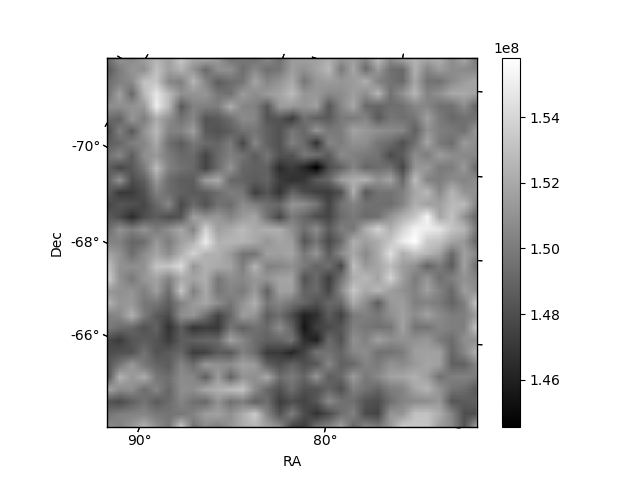
Quadrant B |
|---|---|---|---|
| Quadrant D | 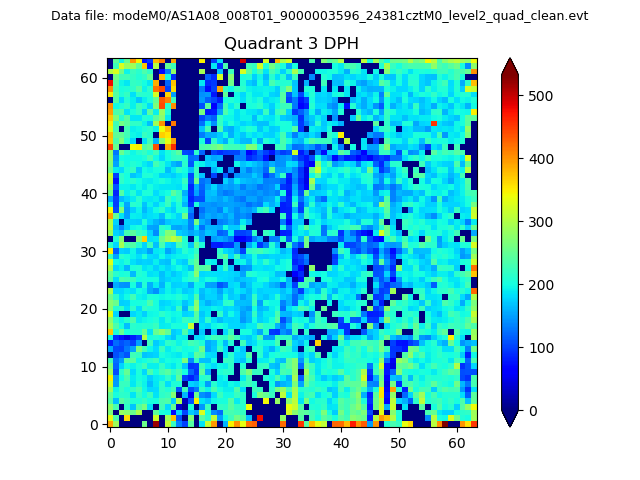 |
 |
Quadrant C |
| Plot type | Count rate plots | Images |
|---|---|---|
| Comparison with Poisson distribution Blue bars denote a histogram of data divided into 1 sec bins. Red curve is a Poisson curve with rate = median count rate of data. |
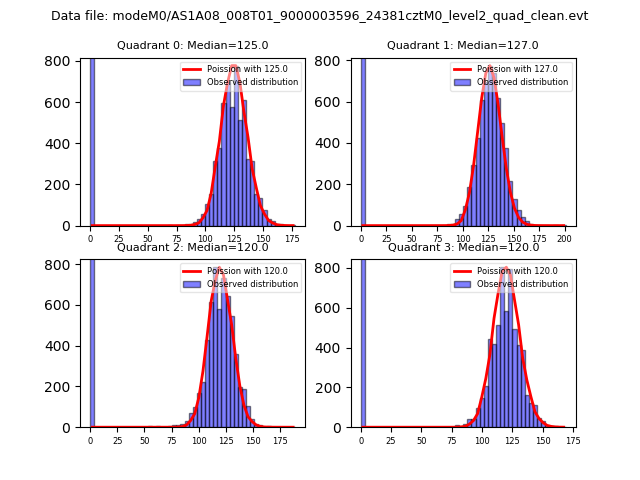 |
 |
| Quadrant-wise count rates Data is divided into 100 sec bins |
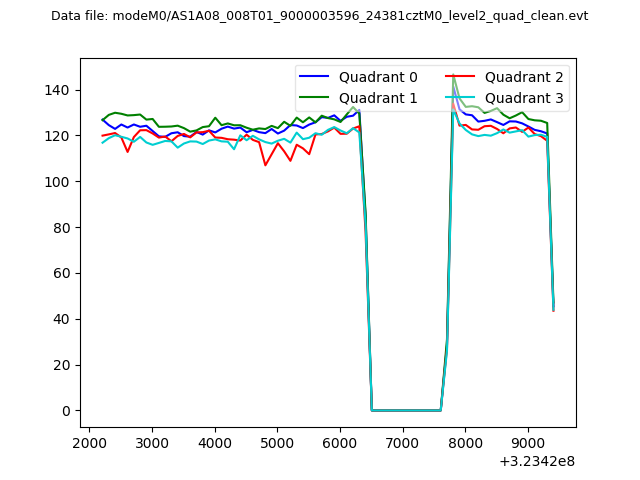 |
|
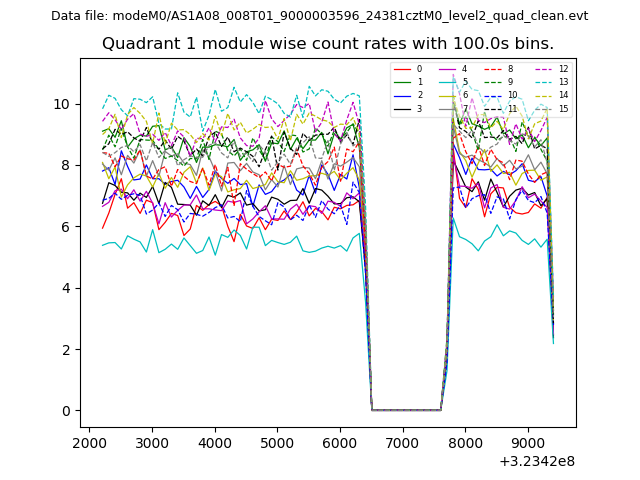
| Module-wise count rates for Quadrant A Data is divided into 100 sec bins |
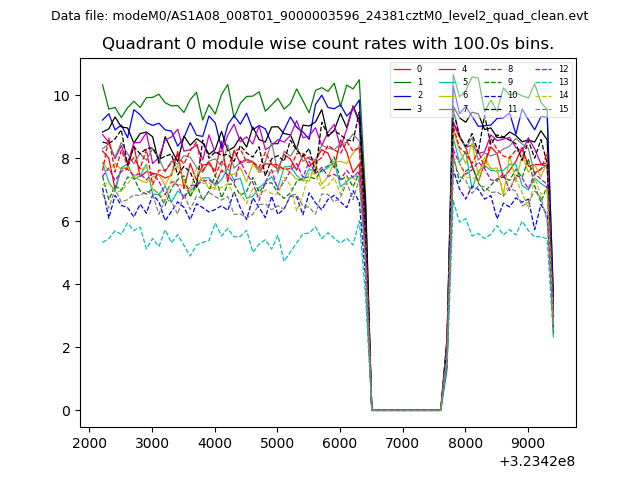 |
 |
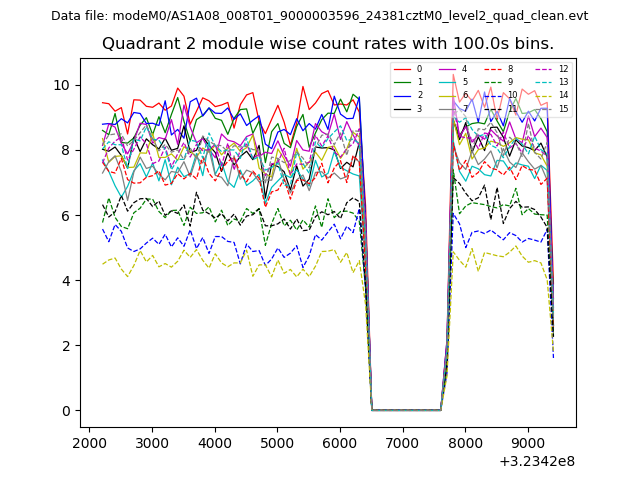
| Module-wise count rates for Quadrant B Data is divided into 100 sec bins |
 |
 |
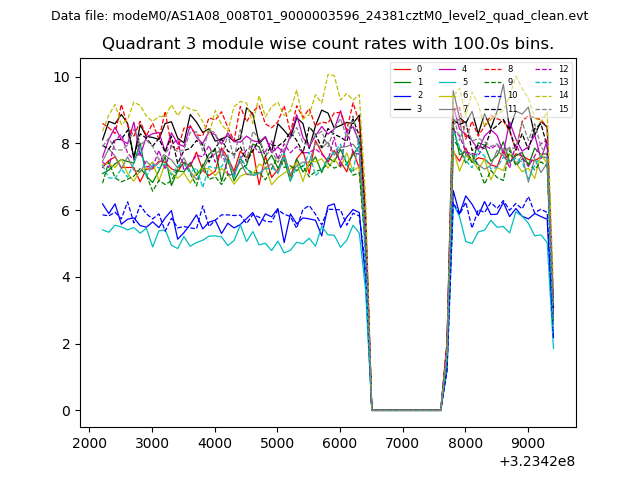
| Module-wise count rates for Quadrant C Data is divided into 100 sec bins |
 |
 |
| Module-wise count rates for Quadrant D Data is divided into 100 sec bins |
 |
 |
| Parameter | Plot |
|---|---|
| CZT HV Monitor | 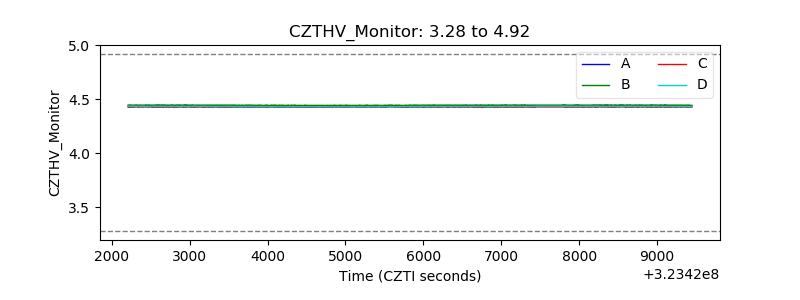 |
| D_VDD | 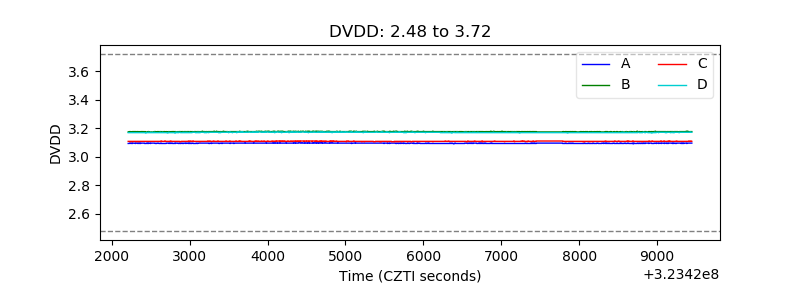 |
| Temperature 1 |  |
| Veto HV Monitor | 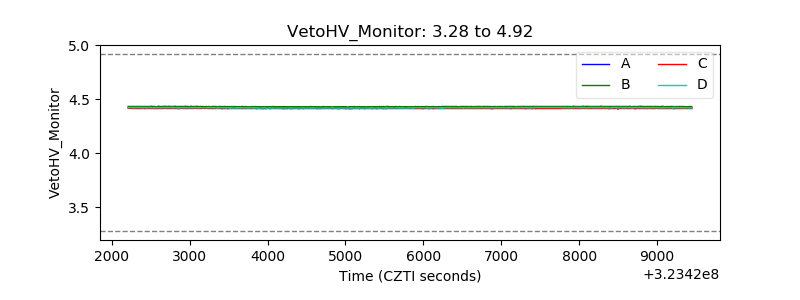 |
| Veto LLD | 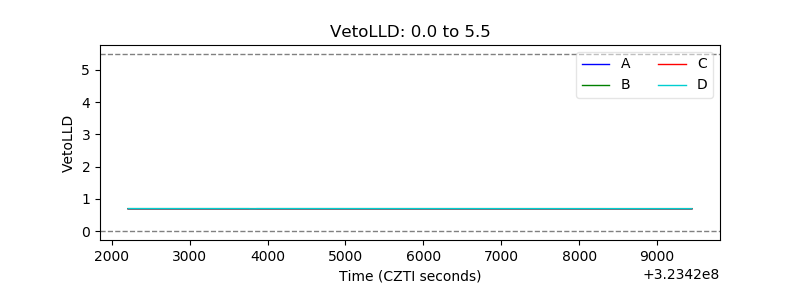 |
| Alpha Counter | 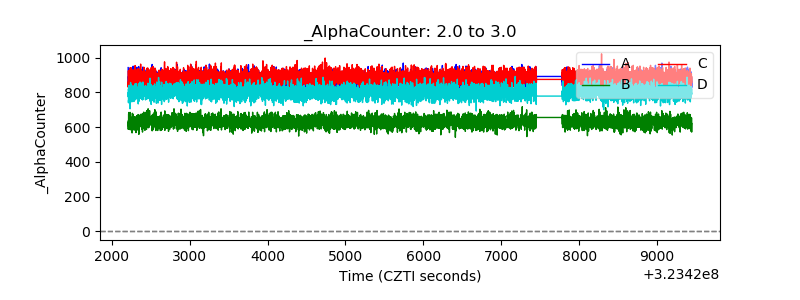 |
| _CPM_Rate | 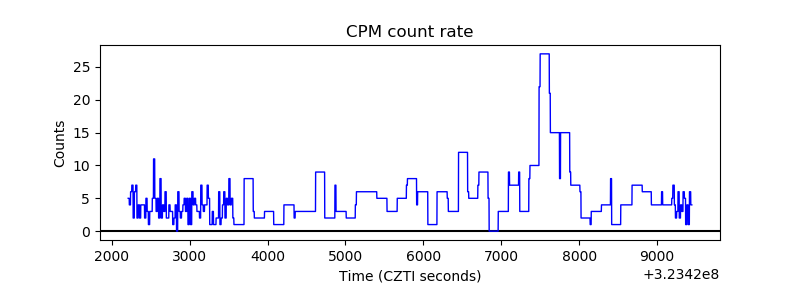 |
| CZT Counter | 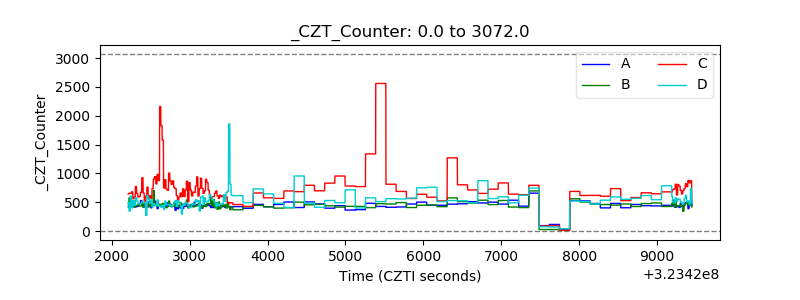 |
| +2.5 Volts monitor |  |
| +5 Volts monitor |  |
| _ROLL_ROT | 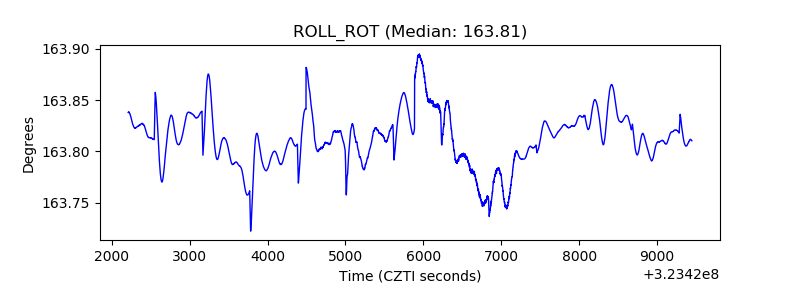 |
| _Roll_DEC |  |
| _Roll_RA | 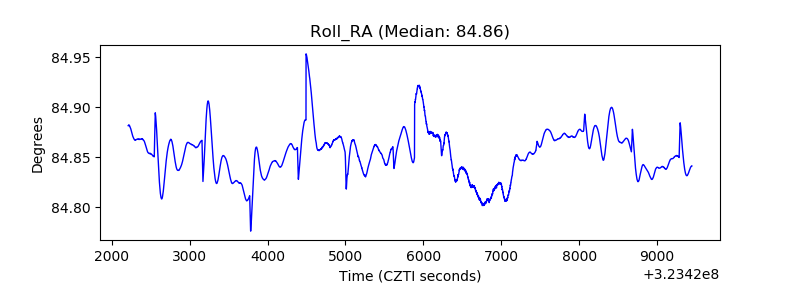 |
| Veto Counter | 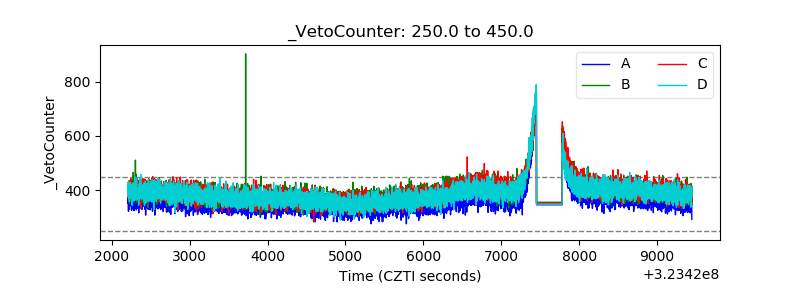 |