| Param | Original file | Final file |
|---|---|---|
| Filename | modeM0/AS1A08_008T01_9000003596_24383cztM0_level2.evt | modeM0/AS1A08_008T01_9000003596_24383cztM0_level2_quad_clean.evt |
| Size (bytes) | 21,746,880 | 5,808,960 |
| Size | 20.7 MB | 5.5 MB |
| Events in quadrant A | 137,959 | 36,857 |
| Events in quadrant B | 138,956 | 37,730 |
| Events in quadrant C | 194,884 | 35,896 |
| Events in quadrant D | 162,908 | 35,783 |
| Mode SS | |||
|---|---|---|---|
| Quadrant | BADHDUFLAG | Total packets | Discarded packets |
| A | 0 | 6 | 0 |
| B | 0 | 6 | 0 |
| C | 0 | 6 | 0 |
| D | 0 | 6 | 0 |
| Mode M0 | |||
|---|---|---|---|
| Quadrant | BADHDUFLAG | Total packets | Discarded packets |
| A | 0 | 590 | 0 |
| B | 0 | 594 | 0 |
| C | 0 | 837 | 0 |
| D | 0 | 658 | 0 |
| Quadrant | Total seconds | Saturated seconds | Saturation percentage |
|---|---|---|---|
| A | 295 | 0 | 0.000000% |
| B | 296 | 0 | 0.000000% |
| C | 296 | 4 | 1.351351% |
| D | 296 | 0 | 0.000000% |
Noise dominated data is calculated using 1-second bins in cleaned event files. If a bin has >2000 counts, and if more than 50% of those come from <1% of pixels, then it is considered to be noise-dominated and hence unusable.
| Quadrant | # 1 sec bins | Bins with >0 counts | Bins with >2000 counts | High rate bins dominated by noise | Noise dominated (total time) | Noise dominated (detector-on time) | Marked lightcurve |
|---|---|---|---|---|---|---|---|
| A | 295 | 295 | 0 | 0 | 0.00% | 0.00% | 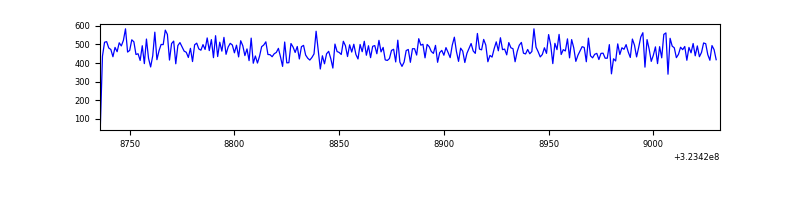 |
| B | 296 | 296 | 0 | 0 | 0.00% | 0.00% | 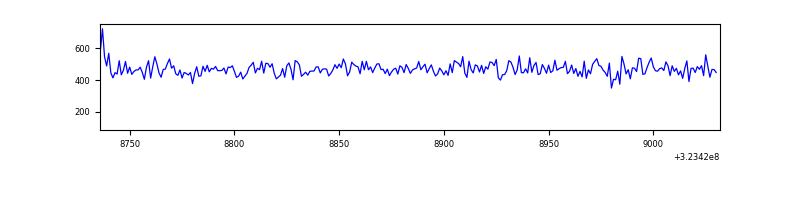 |
| C | 296 | 296 | 0 | 0 | 0.00% | 0.00% | 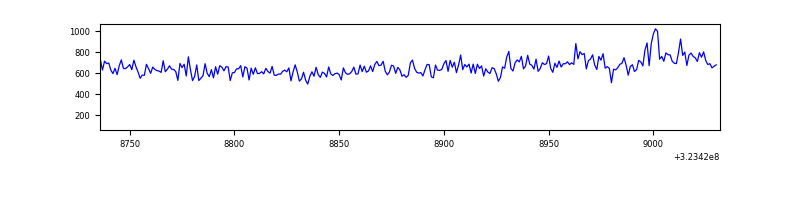 |
| D | 296 | 296 | 0 | 0 | 0.00% | 0.00% | 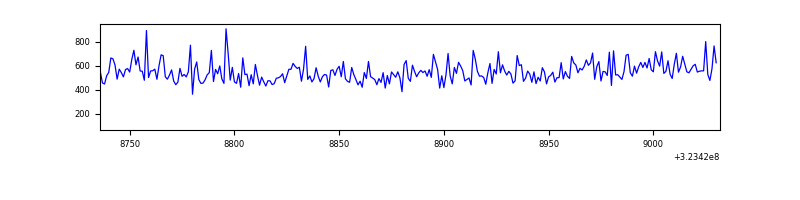 |
Top three noisy pixels from each quadrant. If the there are fewer than three noisy pixels in the level2.evt file, extra rows are filled as -1
| Pixel properties | Quadrant properties | ||||||
|---|---|---|---|---|---|---|---|
| Quadrant | DetID | PixID | Counts | Sigma | Mean | Median | Sigma |
| A | 13 | 254 | 329 | 31.24 | 35 | 34 | 9.4 |
| A | 3 | 137 | 284 | 26.47 | 35 | 34 | 9.4 |
| A | 0 | 226 | 274 | 25.41 | 35 | 34 | 9.4 |
| B | 12 | 111 | 876 | 94.02 | 35 | 34 | 9.0 |
| B | 11 | 111 | 812 | 86.87 | 35 | 34 | 9.0 |
| B | 14 | 111 | 701 | 74.48 | 35 | 34 | 9.0 |
| C | 7 | 247 | 52460 | 5113.33 | 34 | 34 | 10.3 |
| C | 14 | 238 | 5523 | 535.37 | 34 | 34 | 10.3 |
| C | 13 | 61 | 281 | 24.09 | 34 | 34 | 10.3 |
| D | 8 | 195 | 25224 | 2338.9 | 35 | 34 | 10.8 |
| D | 2 | 234 | 1218 | 109.93 | 35 | 34 | 10.8 |
| D | 6 | 3 | 912 | 81.52 | 35 | 34 | 10.8 |
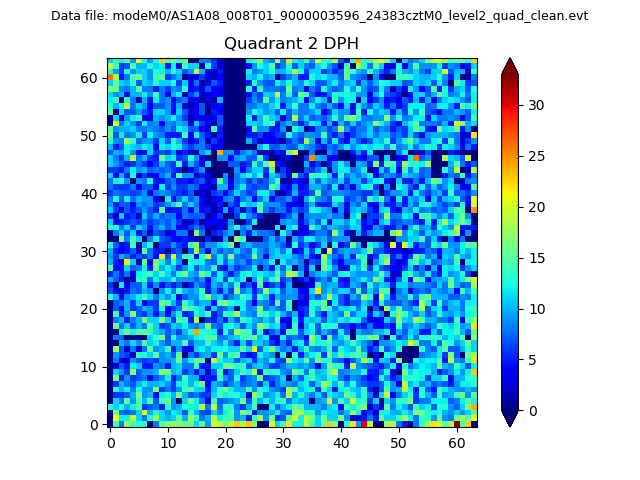
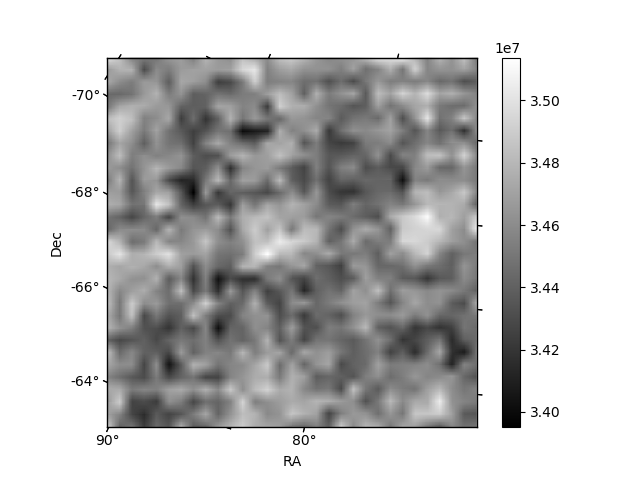
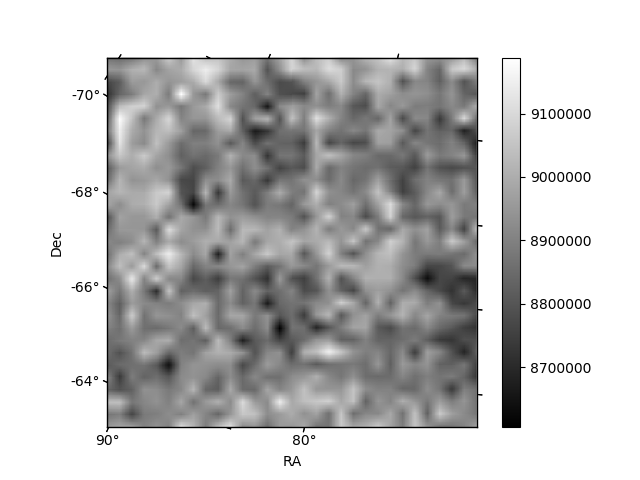
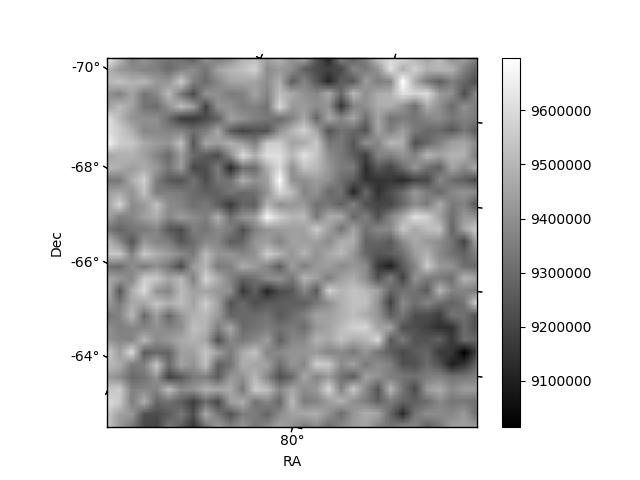
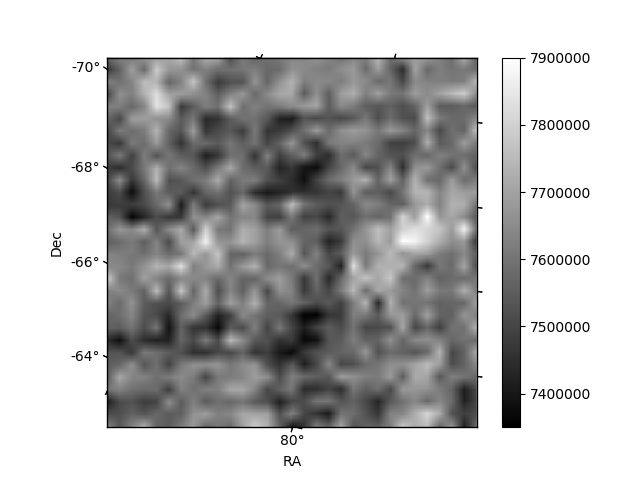
Histogram calculated using DETX and DETY for each event in the final _common_clean file
| Quadrant A | 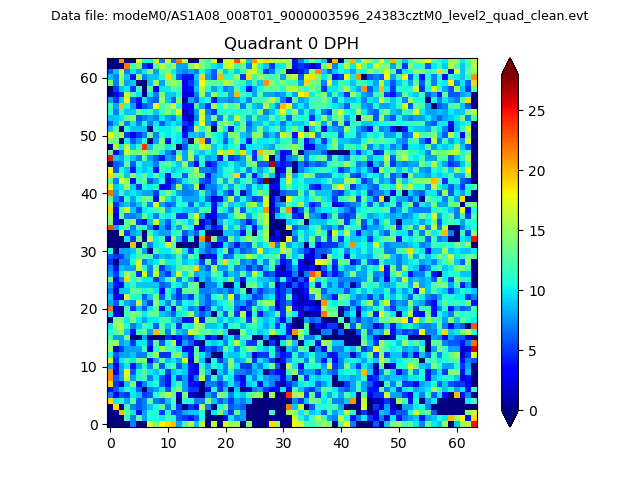 |
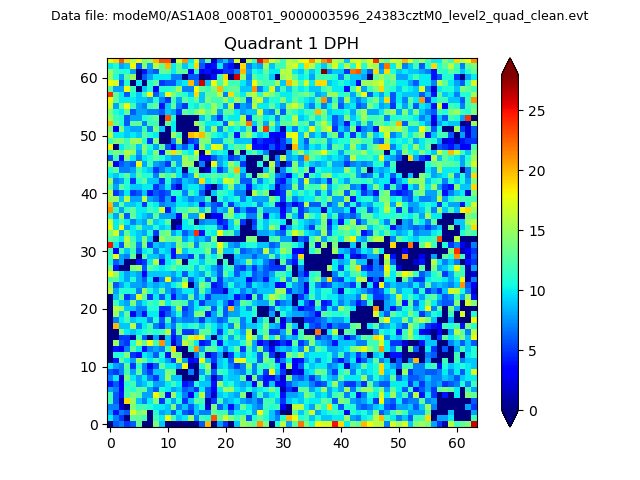 |
Quadrant B |
|---|---|---|---|
| Quadrant D | 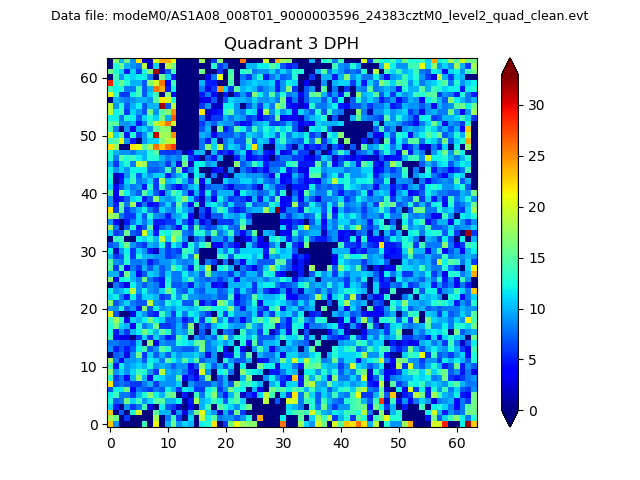 |
 |
Quadrant C |
| Plot type | Count rate plots | Images |
|---|---|---|
| Comparison with Poisson distribution Blue bars denote a histogram of data divided into 1 sec bins. Red curve is a Poisson curve with rate = median count rate of data. |
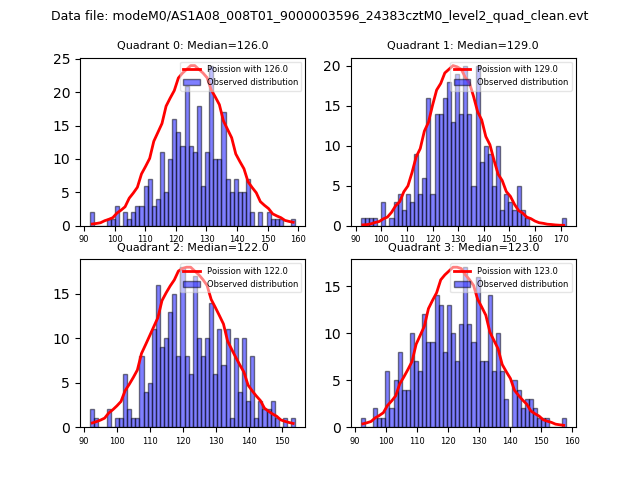 |
 |
| Quadrant-wise count rates Data is divided into 100 sec bins |
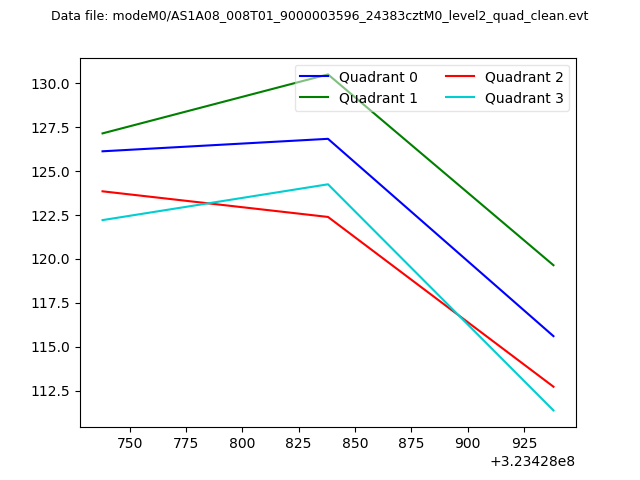 |
|
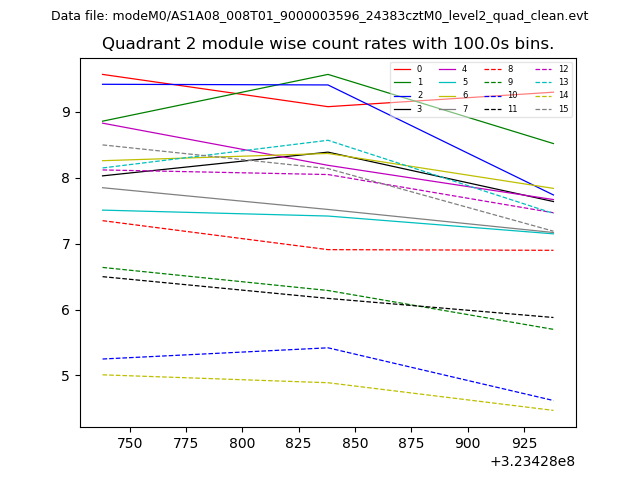
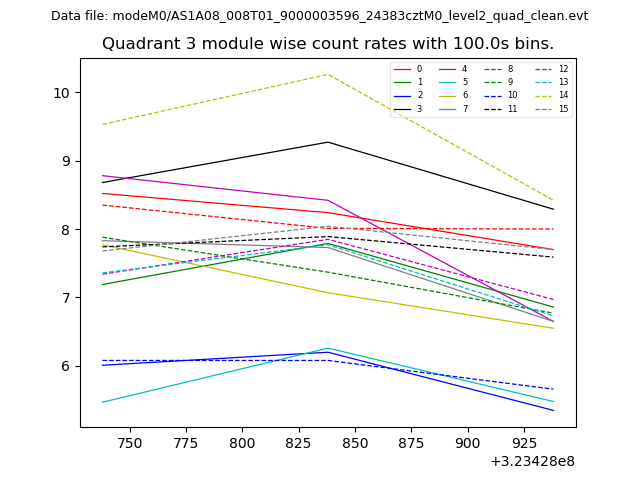
| Module-wise count rates for Quadrant A Data is divided into 100 sec bins |
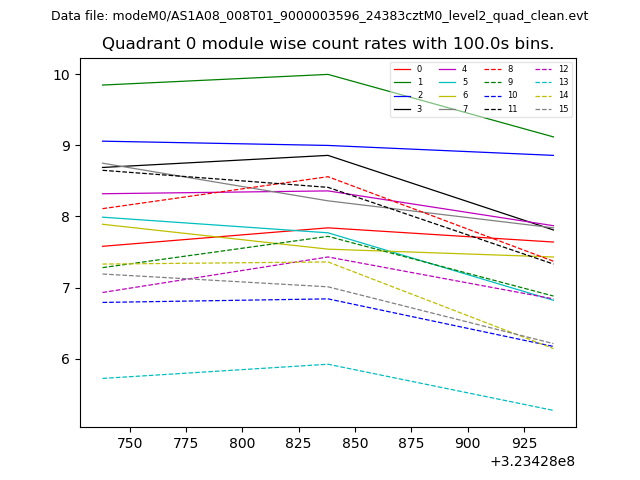 |
 |
| Module-wise count rates for Quadrant B Data is divided into 100 sec bins |
 |
 |
| Module-wise count rates for Quadrant C Data is divided into 100 sec bins |
 |
 |
| Module-wise count rates for Quadrant D Data is divided into 100 sec bins |
 |
 |
| Parameter | Plot |
|---|---|
| CZT HV Monitor | 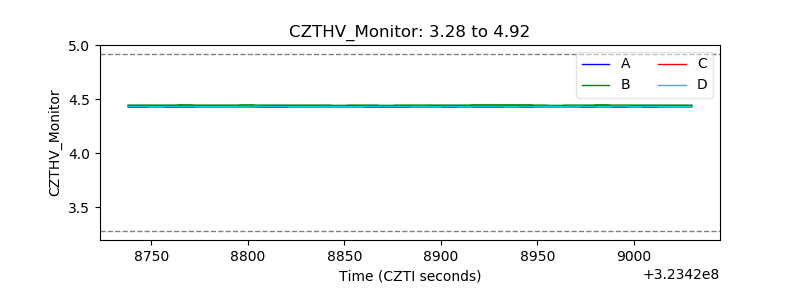 |
| D_VDD | 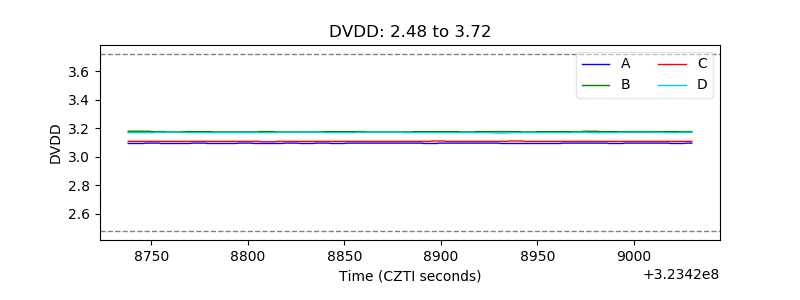 |
| Temperature 1 | 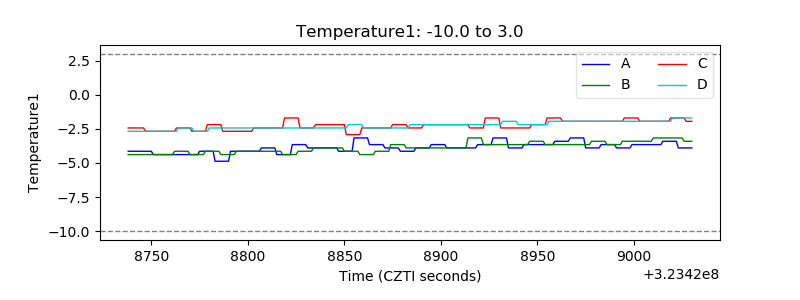 |
| Veto HV Monitor | 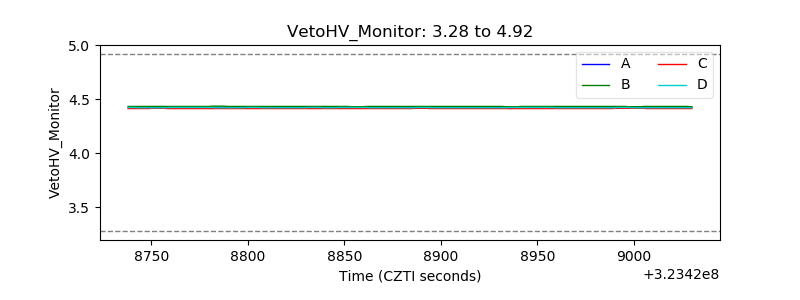 |
| Veto LLD | 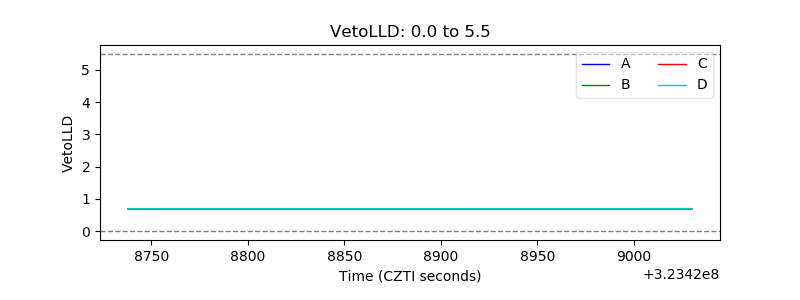 |
| Alpha Counter | 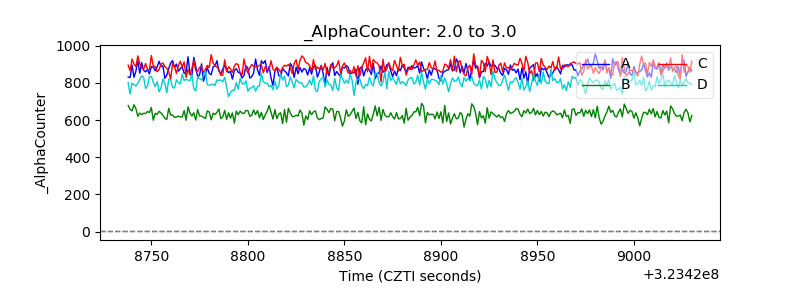 |
| _CPM_Rate | 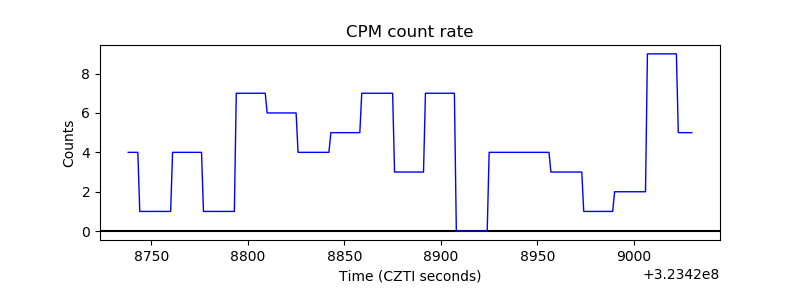 |
| CZT Counter | 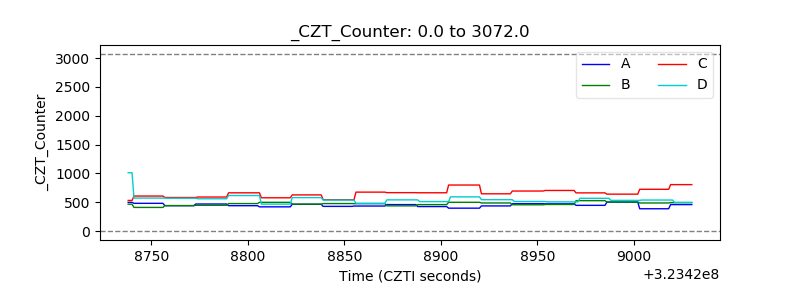 |
| +2.5 Volts monitor |  |
| +5 Volts monitor |  |
| _ROLL_ROT | 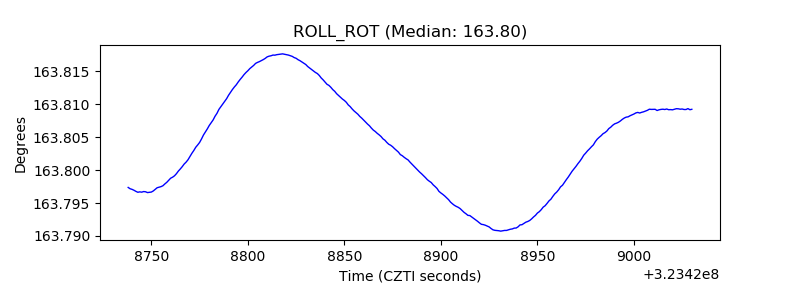 |
| _Roll_DEC | 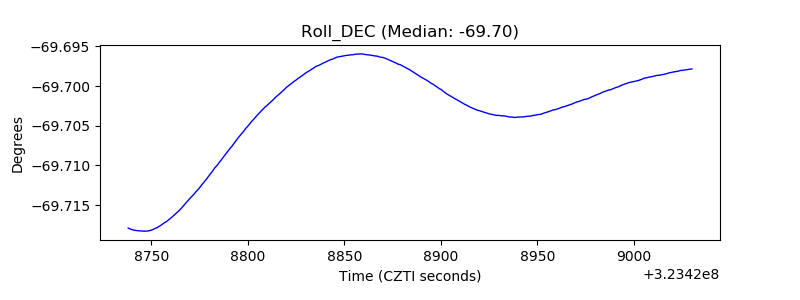 |
| _Roll_RA | 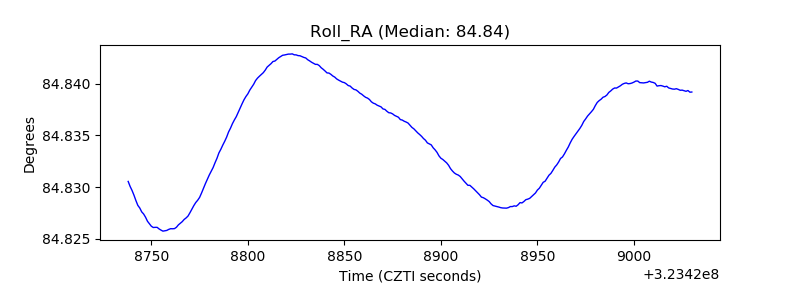 |
| Veto Counter | 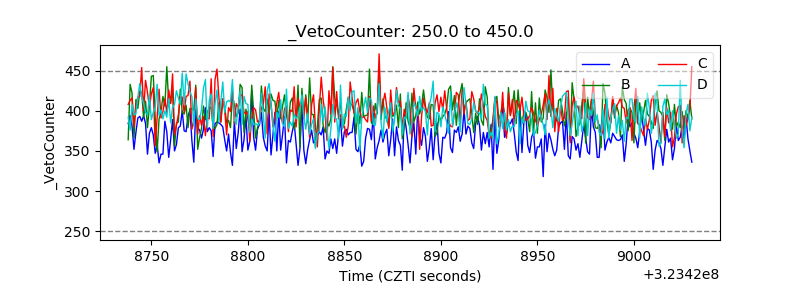 |