| Param | Original file | Final file |
|---|---|---|
| Filename | modeM0/AS1A08_008T01_9000003596_24384cztM0_level2.evt | modeM0/AS1A08_008T01_9000003596_24384cztM0_level2_quad_clean.evt |
| Size (bytes) | 1,707,629,760 | 255,130,560 |
| Size | 1.6 GB | 243.3 MB |
| Events in quadrant A | 8,085,754 | 1,702,286 |
| Events in quadrant B | 8,144,646 | 1,728,033 |
| Events in quadrant C | 25,412,785 | 1,454,357 |
| Events in quadrant D | 8,896,123 | 1,637,187 |
| Mode SS | |||
|---|---|---|---|
| Quadrant | BADHDUFLAG | Total packets | Discarded packets |
| A | 0 | 352 | 0 |
| B | 0 | 352 | 0 |
| C | 0 | 352 | 0 |
| D | 0 | 352 | 0 |
| Mode M0 | |||
|---|---|---|---|
| Quadrant | BADHDUFLAG | Total packets | Discarded packets |
| A | 0 | 35740 | 3 |
| B | 0 | 35593 | 3 |
| C | 0 | 87914 | 3 |
| D | 0 | 37943 | 3 |
| Mode M9 | |||
|---|---|---|---|
| Quadrant | BADHDUFLAG | Total packets | Discarded packets |
| A | 0 | 22 | 0 |
| B | 0 | 22 | 0 |
| C | 0 | 22 | 0 |
| D | 0 | 22 | 0 |
| Quadrant | Total seconds | Saturated seconds | Saturation percentage |
|---|---|---|---|
| A | 17474 | 165 | 0.944260% |
| B | 17474 | 145 | 0.829804% |
| C | 17474 | 5242 | 29.998855% |
| D | 17474 | 146 | 0.835527% |
Noise dominated data is calculated using 1-second bins in cleaned event files. If a bin has >2000 counts, and if more than 50% of those come from <1% of pixels, then it is considered to be noise-dominated and hence unusable.
| Quadrant | # 1 sec bins | Bins with >0 counts | Bins with >2000 counts | High rate bins dominated by noise | Noise dominated (total time) | Noise dominated (detector-on time) | Marked lightcurve |
|---|---|---|---|---|---|---|---|
| A | 19514 | 17477 | 34 | 34 | 0.17% | 0.19% | 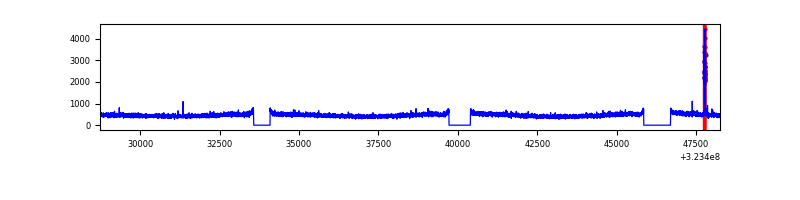 |
| B | 19514 | 17477 | 2 | 2 | 0.01% | 0.01% | 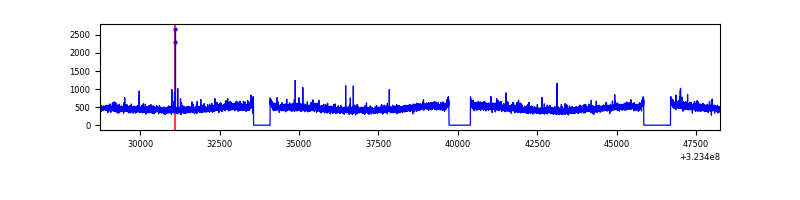 |
| C | 19514 | 17477 | 3698 | 3698 | 18.95% | 21.16% | 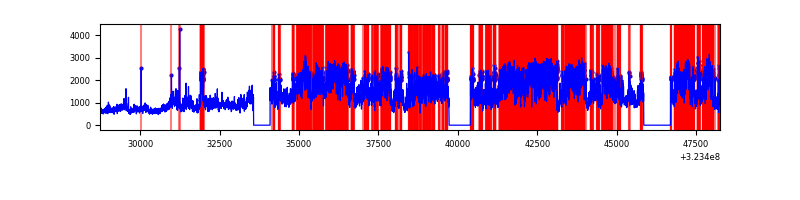 |
| D | 19514 | 17477 | 47 | 47 | 0.24% | 0.27% | 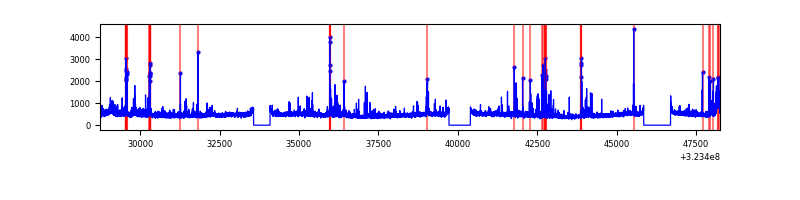 |
Top three noisy pixels from each quadrant. If the there are fewer than three noisy pixels in the level2.evt file, extra rows are filled as -1
| Pixel properties | Quadrant properties | ||||||
|---|---|---|---|---|---|---|---|
| Quadrant | DetID | PixID | Counts | Sigma | Mean | Median | Sigma |
| A | 6 | 10 | 109903 | 260.74 | 2069 | 2021 | 413.8 |
| A | 13 | 254 | 27328 | 61.16 | 2069 | 2021 | 413.8 |
| A | 3 | 137 | 18774 | 40.49 | 2069 | 2021 | 413.8 |
| B | 12 | 111 | 48990 | 120.28 | 2064 | 2009 | 390.6 |
| B | 11 | 111 | 43234 | 105.54 | 2064 | 2009 | 390.6 |
| B | 14 | 111 | 38494 | 93.41 | 2064 | 2009 | 390.6 |
| C | 7 | 247 | 17748311 | 41542.11 | 1842 | 1854 | 427.2 |
| C | 14 | 238 | 286508 | 666.34 | 1842 | 1854 | 427.2 |
| C | 2 | 16 | 158219 | 366.03 | 1842 | 1854 | 427.2 |
| D | 12 | 233 | 355236 | 722.34 | 2012 | 1951 | 489.1 |
| D | 8 | 195 | 327304 | 665.23 | 2012 | 1951 | 489.1 |
| D | 1 | 52 | 242458 | 491.75 | 2012 | 1951 | 489.1 |
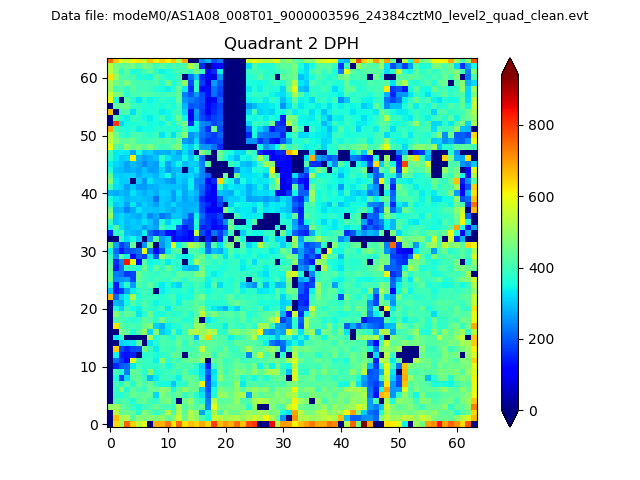
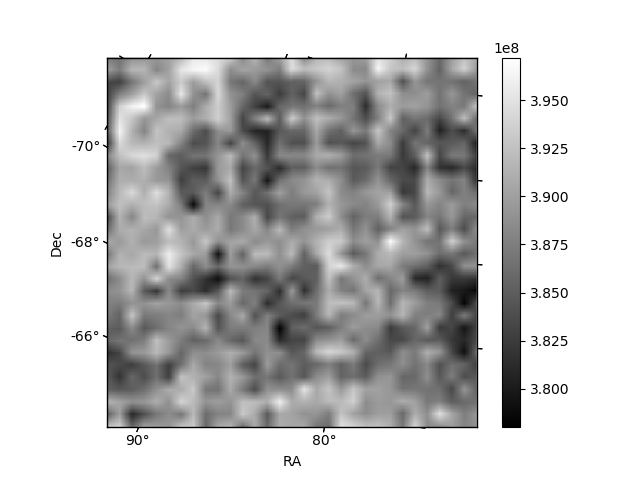
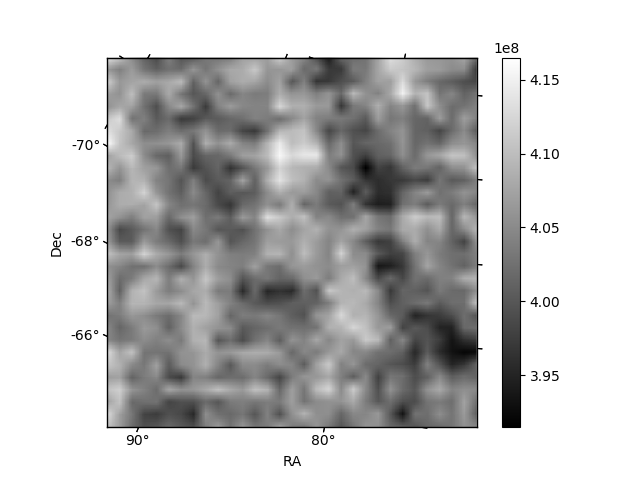
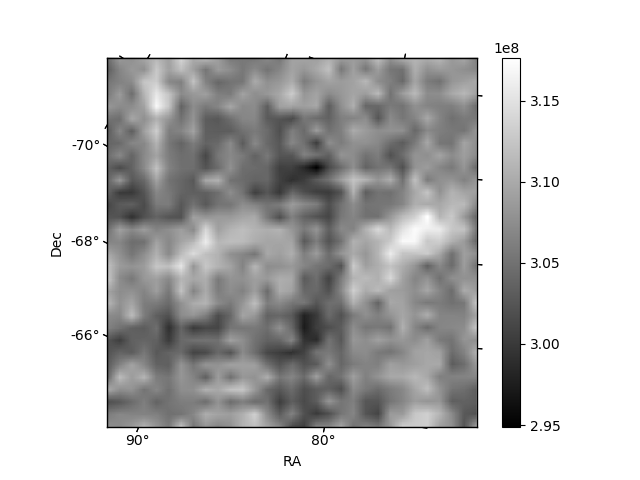
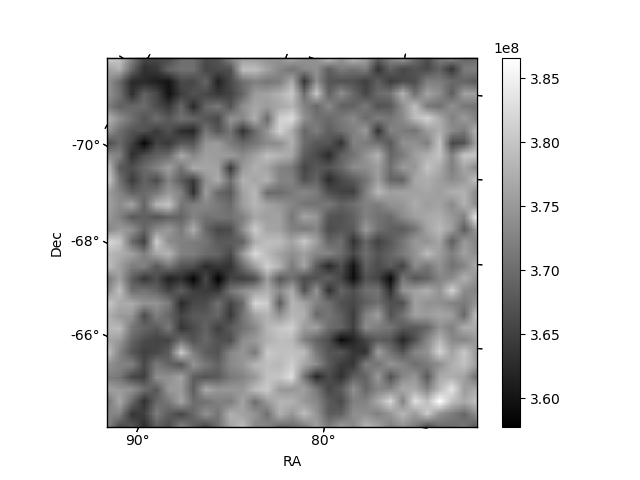
Histogram calculated using DETX and DETY for each event in the final _common_clean file
| Quadrant A | 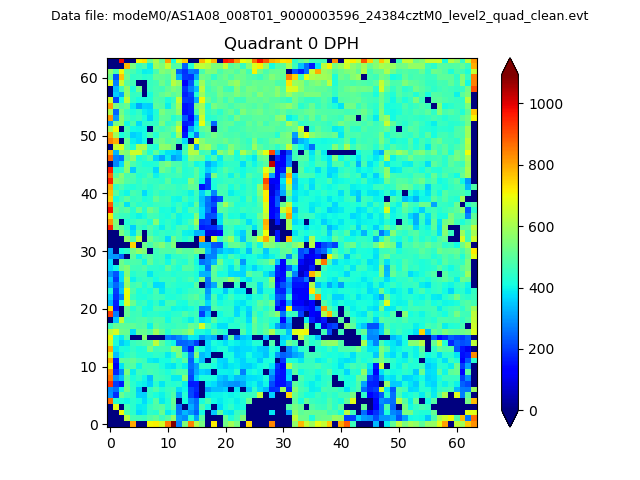 |
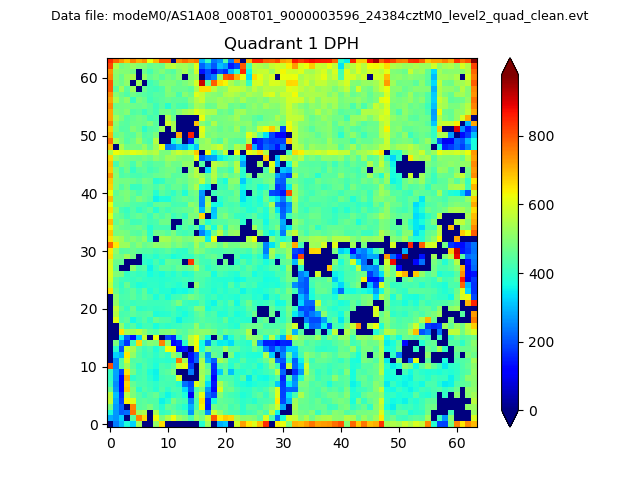 |
Quadrant B |
|---|---|---|---|
| Quadrant D | 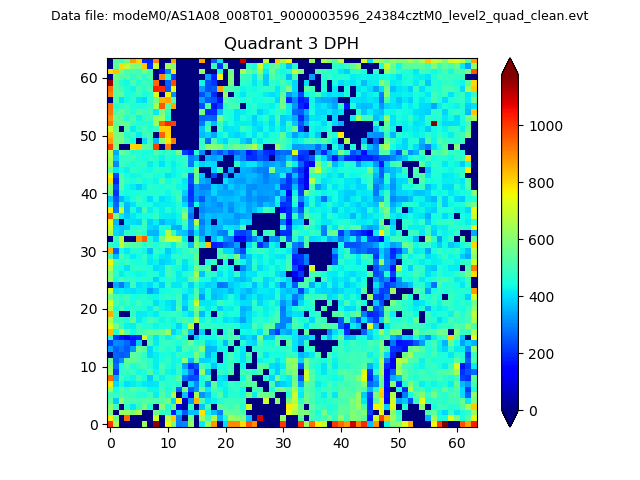 |
 |
Quadrant C |
| Plot type | Count rate plots | Images |
|---|---|---|
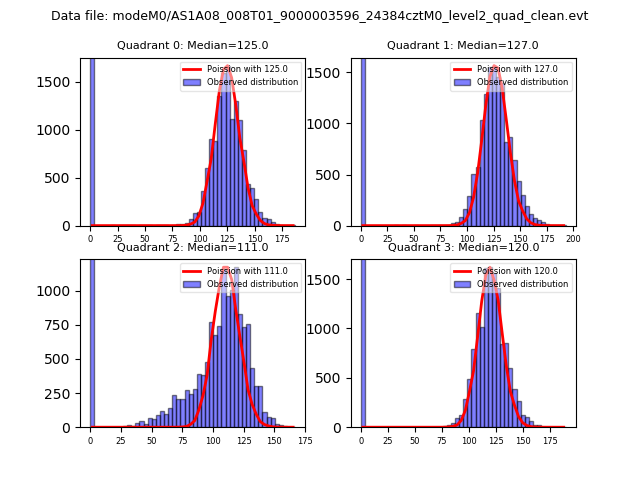
| Comparison with Poisson distribution Blue bars denote a histogram of data divided into 1 sec bins. Red curve is a Poisson curve with rate = median count rate of data. |
 |
 |
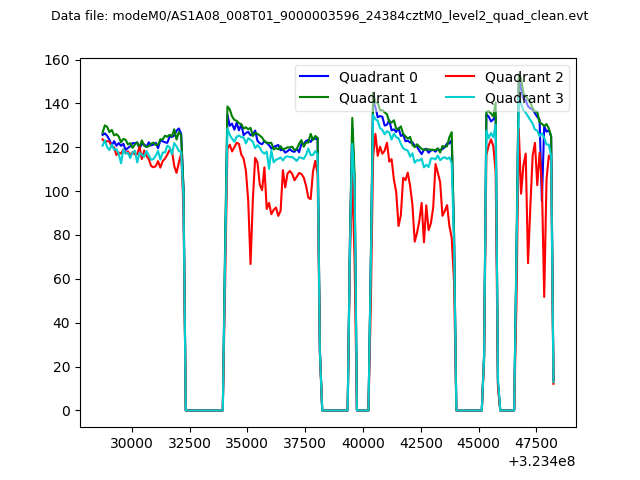
| Quadrant-wise count rates Data is divided into 100 sec bins |
 |
|
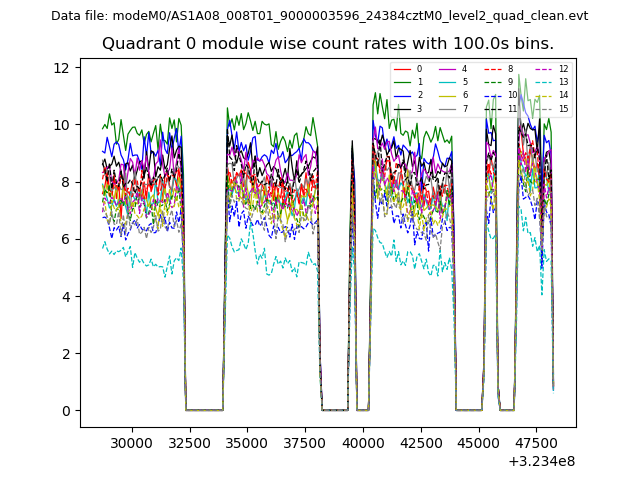
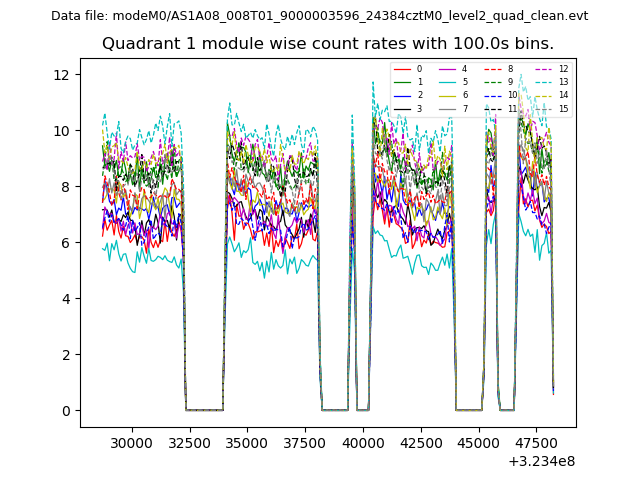
| Module-wise count rates for Quadrant A Data is divided into 100 sec bins |
 |
 |
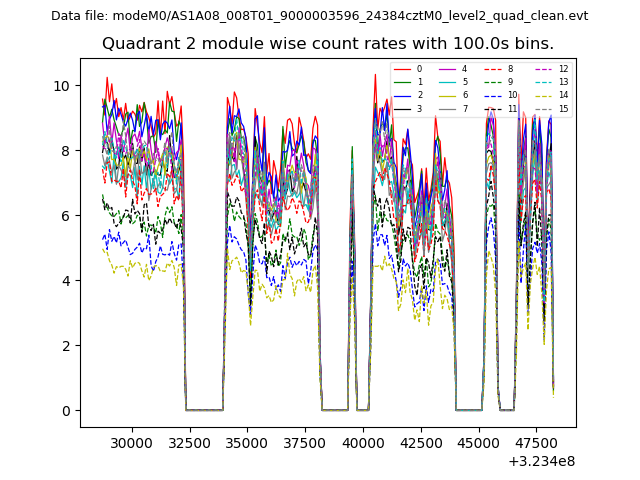
| Module-wise count rates for Quadrant B Data is divided into 100 sec bins |
 |
 |
| Module-wise count rates for Quadrant C Data is divided into 100 sec bins |
 |
 |
| Module-wise count rates for Quadrant D Data is divided into 100 sec bins |
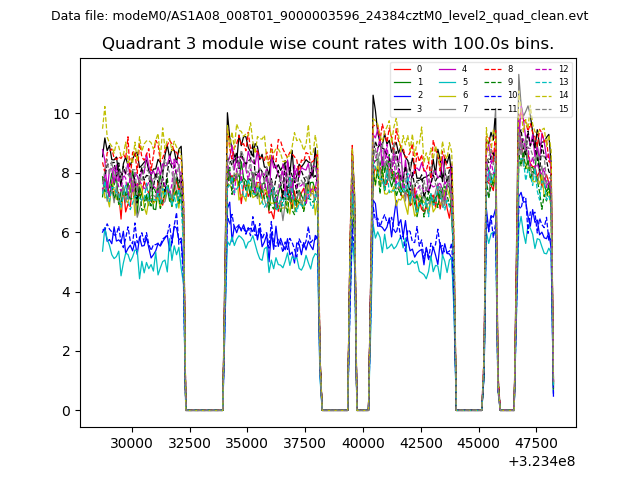 |
 |
| Parameter | Plot |
|---|---|
| CZT HV Monitor | 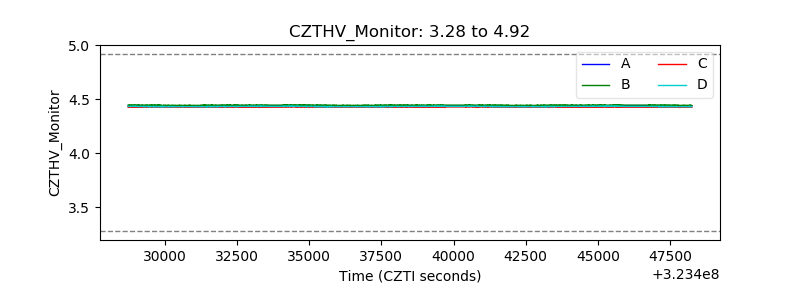 |
| D_VDD | 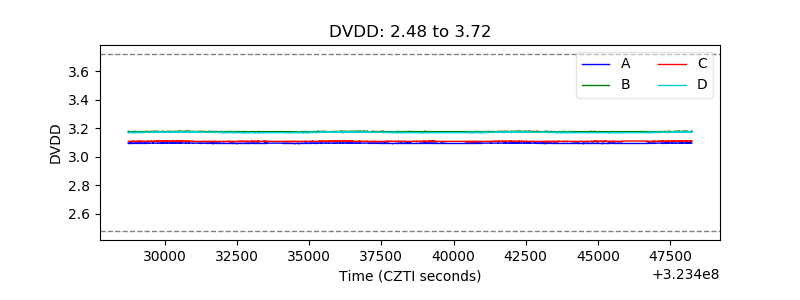 |
| Temperature 1 | 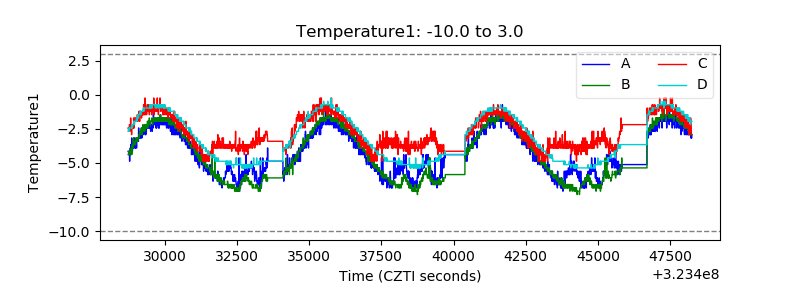 |
| Veto HV Monitor | 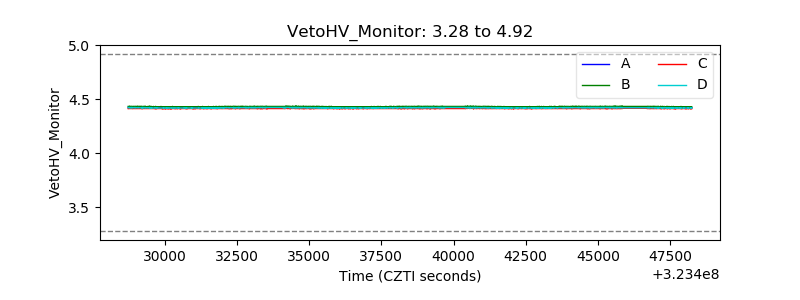 |
| Veto LLD | 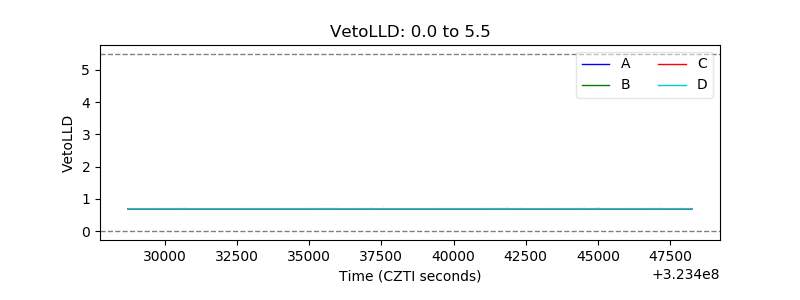 |
| Alpha Counter | 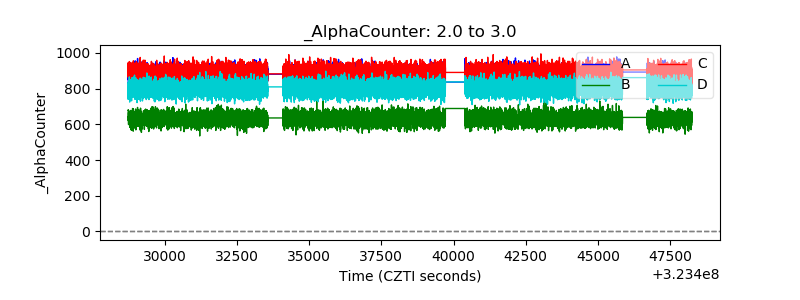 |
| _CPM_Rate | 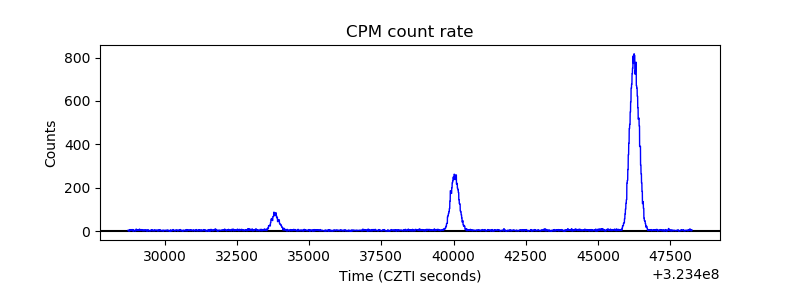 |
| CZT Counter | 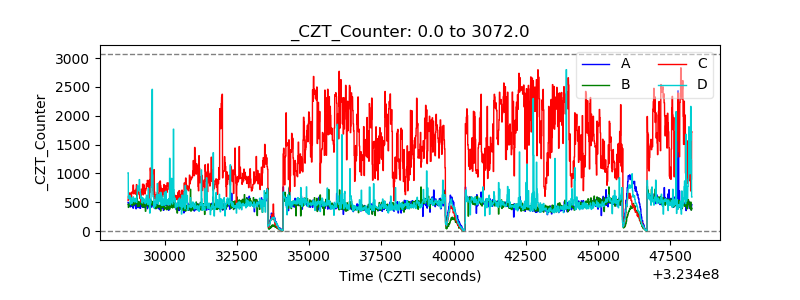 |
| +2.5 Volts monitor | 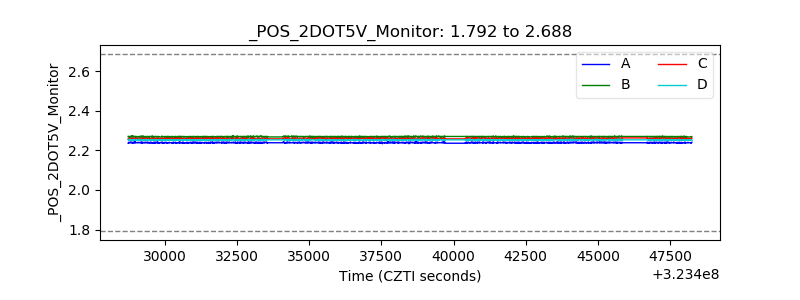 |
| +5 Volts monitor |  |
| _ROLL_ROT | 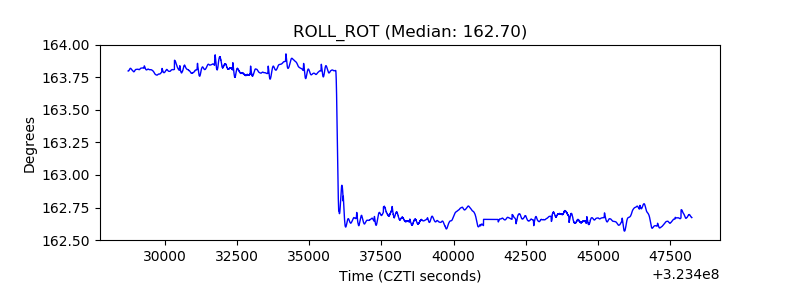 |
| _Roll_DEC | 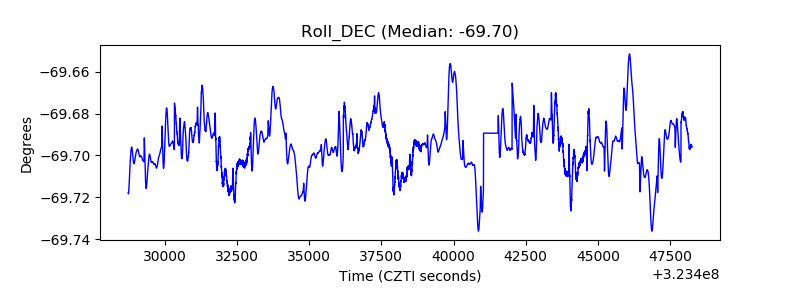 |
| _Roll_RA | 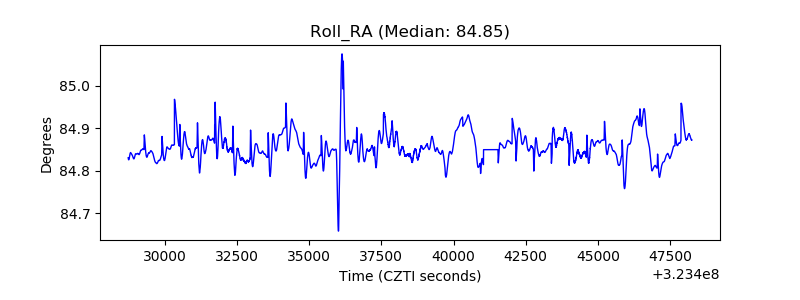 |
| Veto Counter | 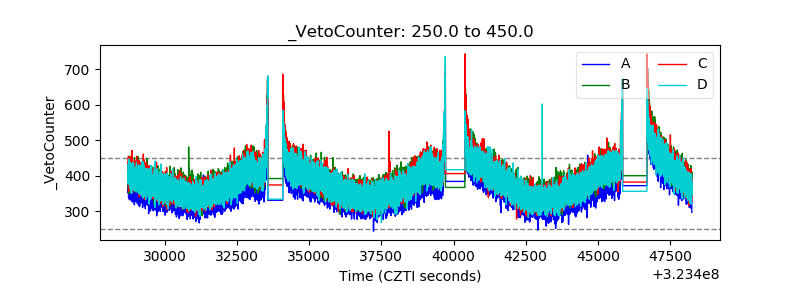 |