| Param | Original file | Final file |
|---|---|---|
| Filename | modeM0/AS1A08_008T01_9000003596_24387cztM0_level2.evt | modeM0/AS1A08_008T01_9000003596_24387cztM0_level2_quad_clean.evt |
| Size (bytes) | 862,341,120 | 93,888,000 |
| Size | 822.4 MB | 89.5 MB |
| Events in quadrant A | 3,084,822 | 716,636 |
| Events in quadrant B | 3,123,163 | 726,135 |
| Events in quadrant C | 15,175,657 | 311,991 |
| Events in quadrant D | 4,299,581 | 640,007 |
| Mode SS | |||
|---|---|---|---|
| Quadrant | BADHDUFLAG | Total packets | Discarded packets |
| A | 0 | 130 | 0 |
| B | 0 | 130 | 0 |
| C | 0 | 130 | 0 |
| D | 0 | 130 | 0 |
| Mode M0 | |||
|---|---|---|---|
| Quadrant | BADHDUFLAG | Total packets | Discarded packets |
| A | 0 | 13395 | 2 |
| B | 0 | 13428 | 2 |
| C | 0 | 49468 | 2 |
| D | 0 | 17149 | 2 |
| Mode M9 | |||
|---|---|---|---|
| Quadrant | BADHDUFLAG | Total packets | Discarded packets |
| A | 0 | 11 | 0 |
| B | 0 | 12 | 0 |
| C | 0 | 12 | 0 |
| D | 0 | 12 | 0 |
| Quadrant | Total seconds | Saturated seconds | Saturation percentage |
|---|---|---|---|
| A | 6392 | 28 | 0.438048% |
| B | 6392 | 37 | 0.578849% |
| C | 6392 | 6103 | 95.478723% |
| D | 6392 | 414 | 6.476846% |
Noise dominated data is calculated using 1-second bins in cleaned event files. If a bin has >2000 counts, and if more than 50% of those come from <1% of pixels, then it is considered to be noise-dominated and hence unusable.
| Quadrant | # 1 sec bins | Bins with >0 counts | Bins with >2000 counts | High rate bins dominated by noise | Noise dominated (total time) | Noise dominated (detector-on time) | Marked lightcurve |
|---|---|---|---|---|---|---|---|
| A | 7512 | 6393 | 0 | 0 | 0.00% | 0.00% | 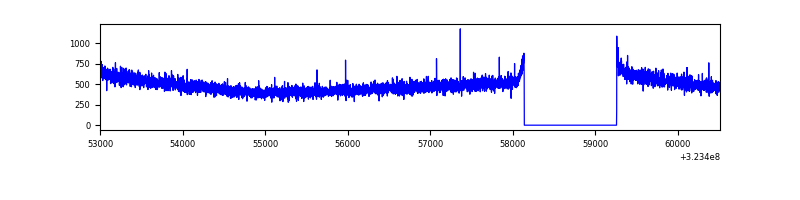 |
| B | 7512 | 6393 | 1 | 1 | 0.01% | 0.02% | 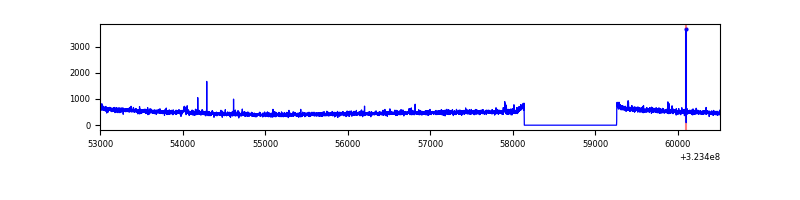 |
| C | 7512 | 6393 | 5513 | 5513 | 73.39% | 86.23% | 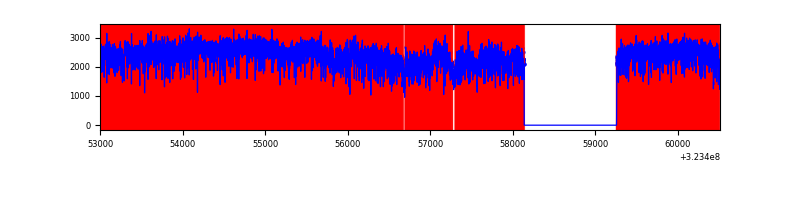 |
| D | 7512 | 6392 | 303 | 303 | 4.03% | 4.74% | 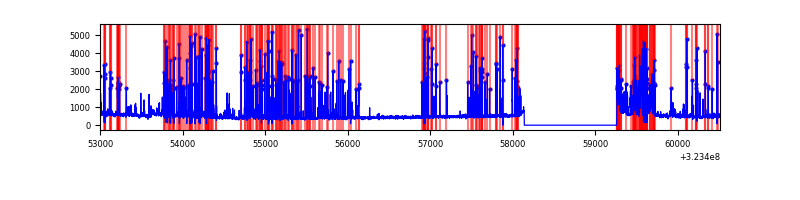 |
Top three noisy pixels from each quadrant. If the there are fewer than three noisy pixels in the level2.evt file, extra rows are filled as -1
| Pixel properties | Quadrant properties | ||||||
|---|---|---|---|---|---|---|---|
| Quadrant | DetID | PixID | Counts | Sigma | Mean | Median | Sigma |
| A | 13 | 254 | 9660 | 55.66 | 798 | 780 | 159.5 |
| A | 6 | 10 | 8091 | 45.83 | 798 | 780 | 159.5 |
| A | 3 | 137 | 6952 | 38.69 | 798 | 780 | 159.5 |
| B | 12 | 111 | 17779 | 114.77 | 790 | 773 | 148.2 |
| B | 11 | 111 | 15660 | 100.47 | 790 | 773 | 148.2 |
| B | 14 | 111 | 13662 | 86.99 | 790 | 773 | 148.2 |
| C | 7 | 247 | 13255111 | 127436.54 | 446 | 448 | 104.0 |
| C | 2 | 16 | 76124 | 727.58 | 446 | 448 | 104.0 |
| C | 14 | 238 | 67778 | 647.34 | 446 | 448 | 104.0 |
| D | 1 | 52 | 1008890 | 5612.05 | 735 | 711 | 179.6 |
| D | 12 | 233 | 387831 | 2154.91 | 735 | 711 | 179.6 |
| D | 8 | 195 | 31715 | 172.58 | 735 | 711 | 179.6 |
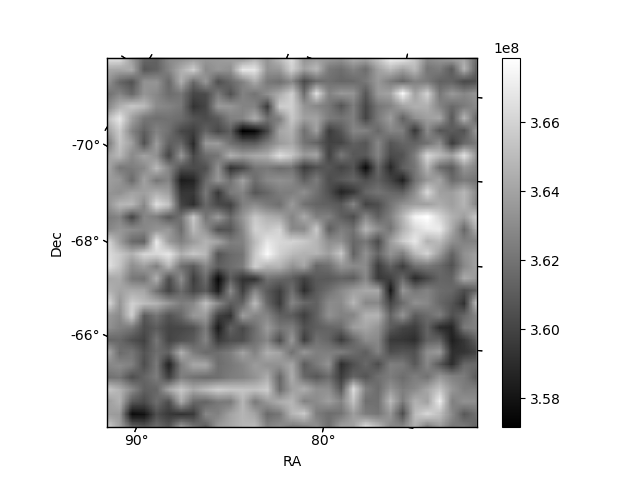
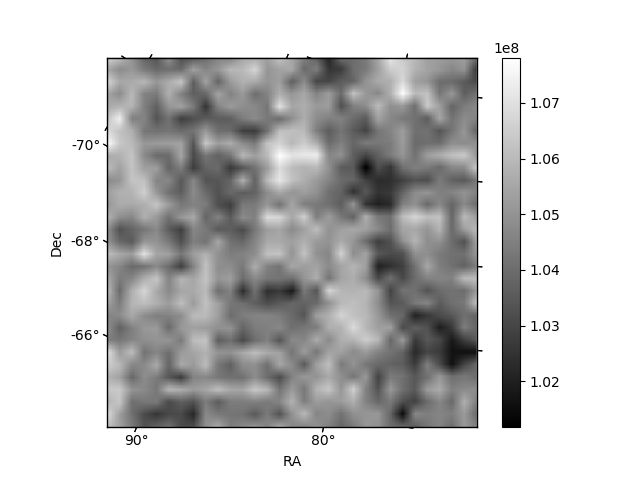
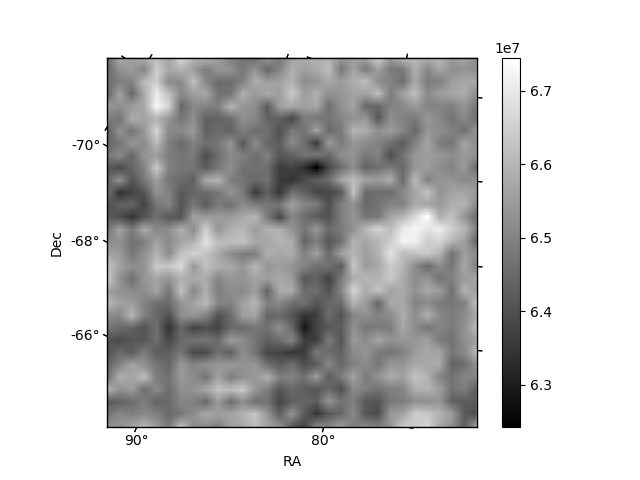
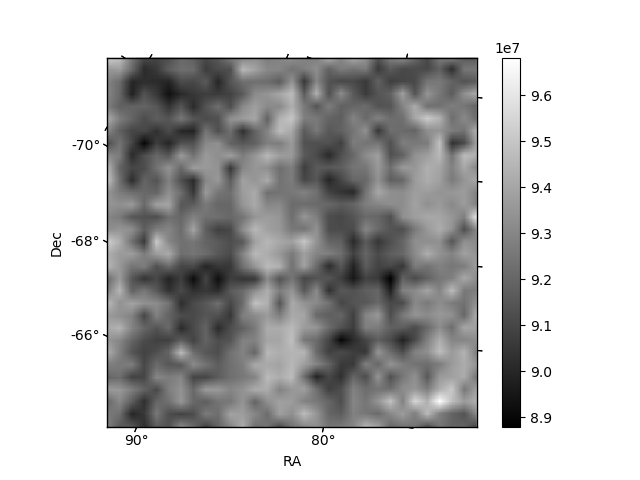
Histogram calculated using DETX and DETY for each event in the final _common_clean file
| Quadrant A | 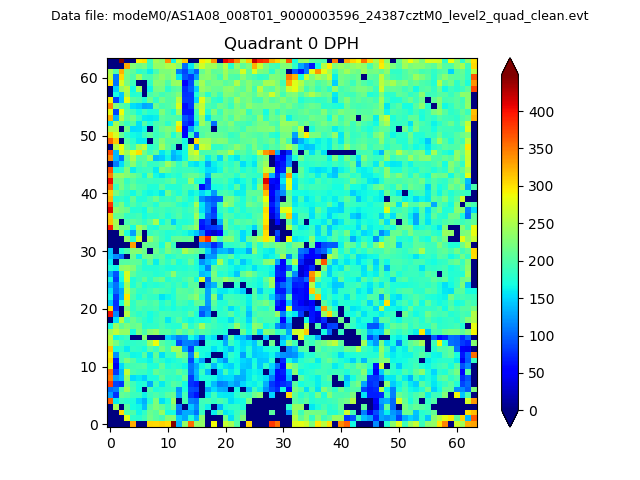 |
 |
Quadrant B |
|---|---|---|---|
| Quadrant D | 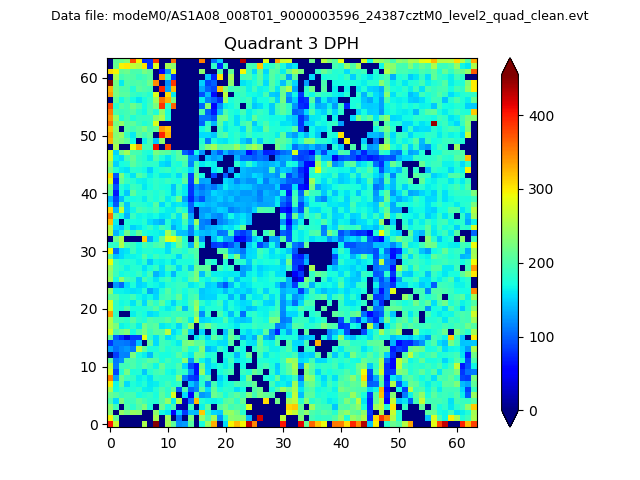 |
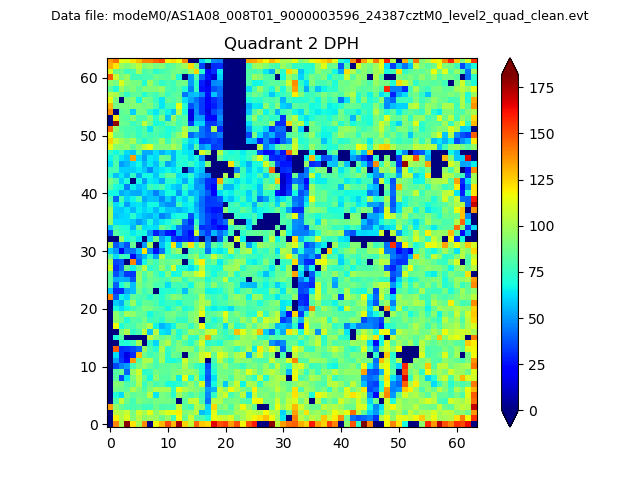 |
Quadrant C |
| Plot type | Count rate plots | Images |
|---|---|---|
| Comparison with Poisson distribution Blue bars denote a histogram of data divided into 1 sec bins. Red curve is a Poisson curve with rate = median count rate of data. |
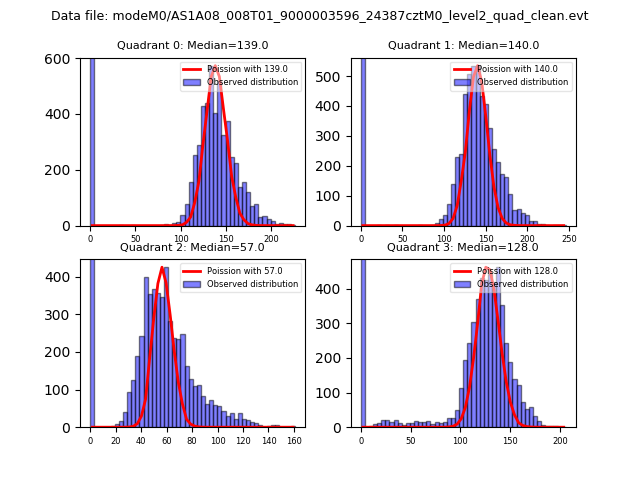 |
 |
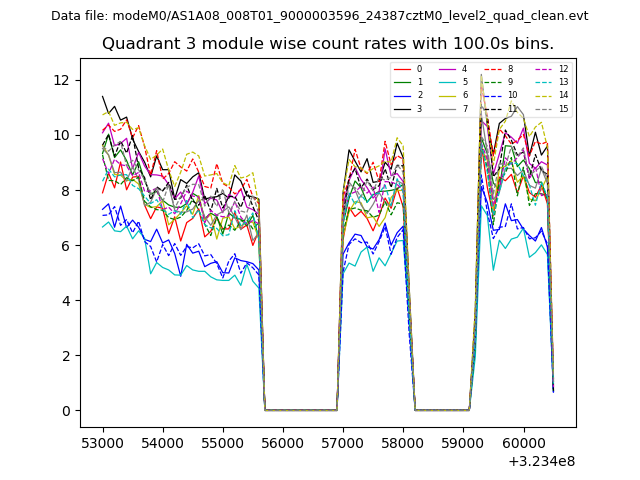
| Quadrant-wise count rates Data is divided into 100 sec bins |
 |
|
| Module-wise count rates for Quadrant A Data is divided into 100 sec bins |
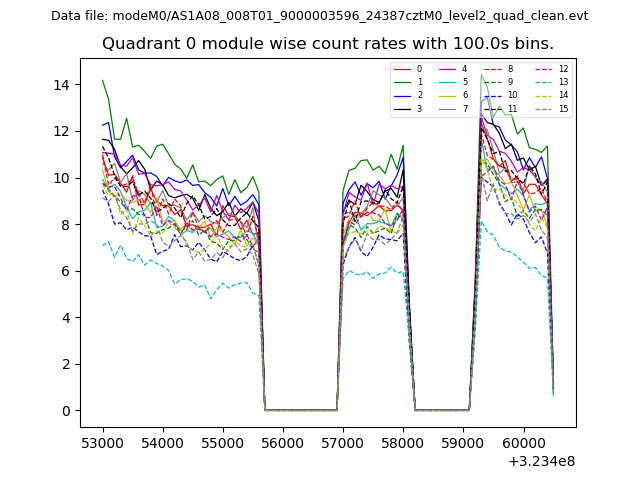 |
 |
| Module-wise count rates for Quadrant B Data is divided into 100 sec bins |
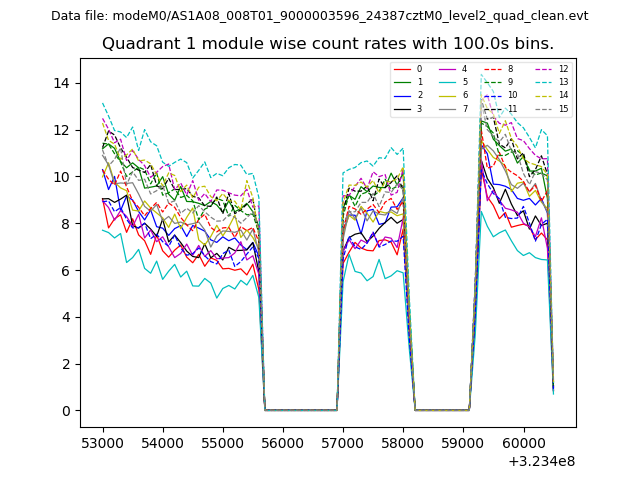 |
 |
| Module-wise count rates for Quadrant C Data is divided into 100 sec bins |
 |
 |
| Module-wise count rates for Quadrant D Data is divided into 100 sec bins |
 |
 |
| Parameter | Plot |
|---|---|
| CZT HV Monitor |  |
| D_VDD | 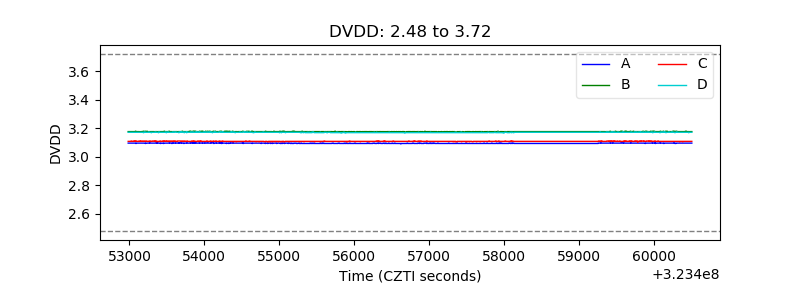 |
| Temperature 1 | 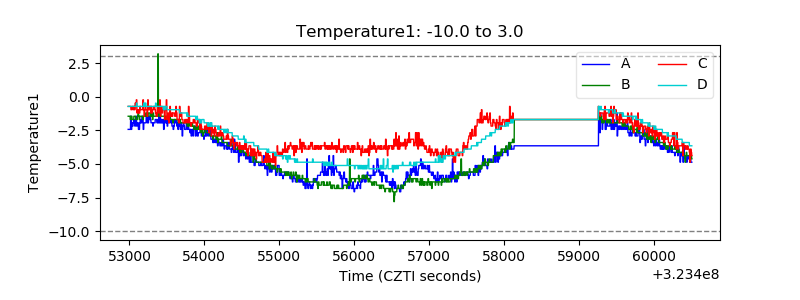 |
| Veto HV Monitor | 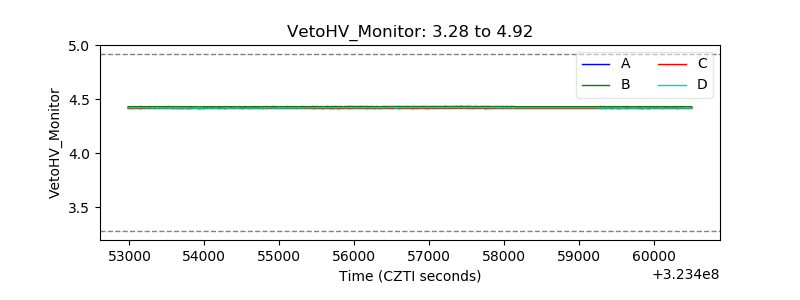 |
| Veto LLD | 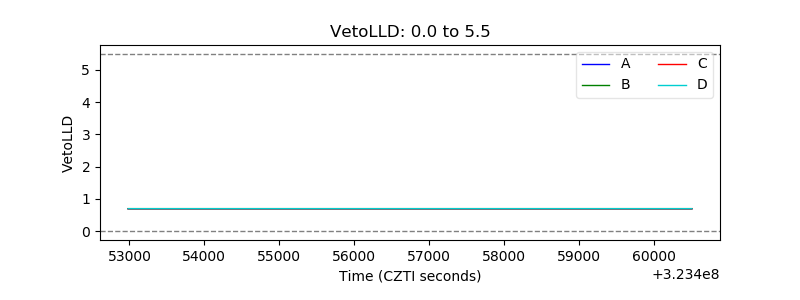 |
| Alpha Counter | 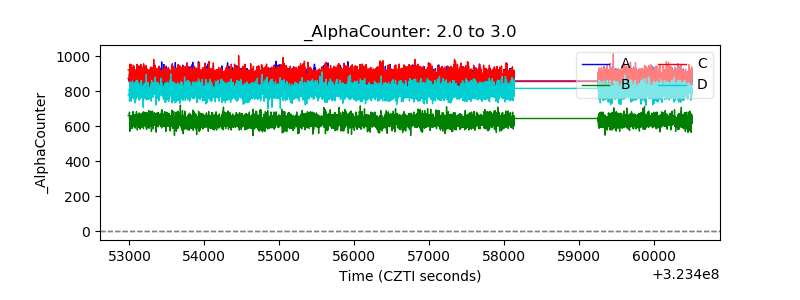 |
| _CPM_Rate | 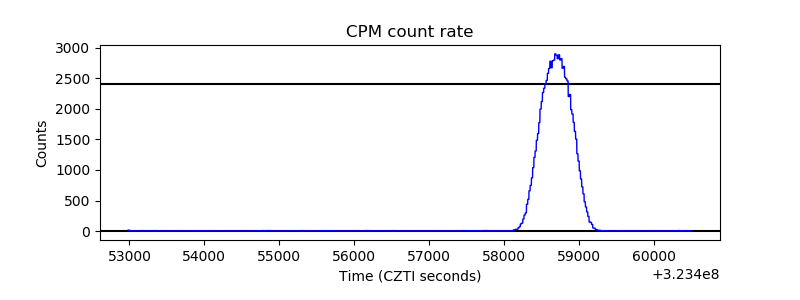 |
| CZT Counter | 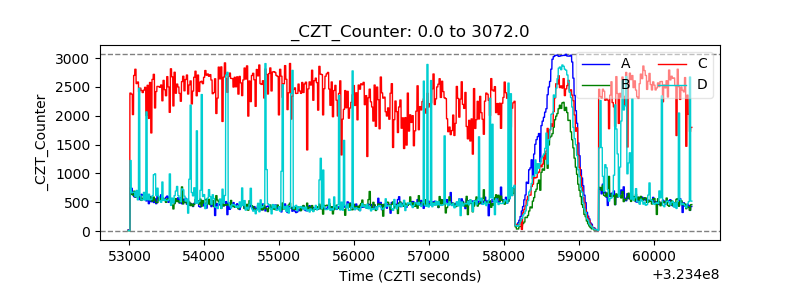 |
| +2.5 Volts monitor |  |
| +5 Volts monitor |  |
| _ROLL_ROT | 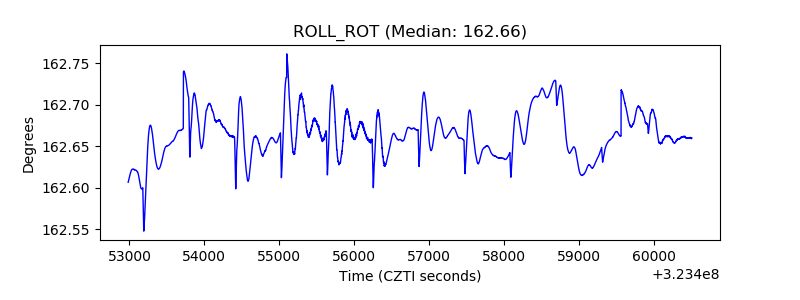 |
| _Roll_DEC | 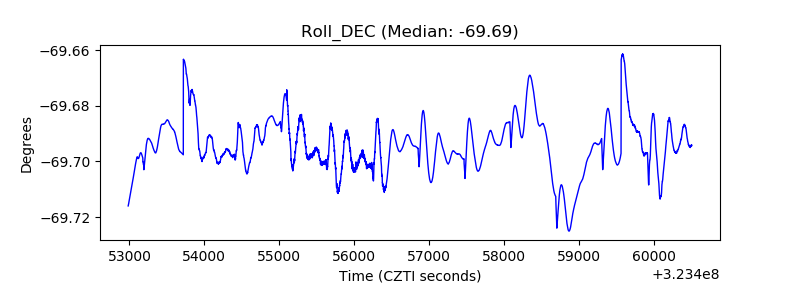 |
| _Roll_RA | 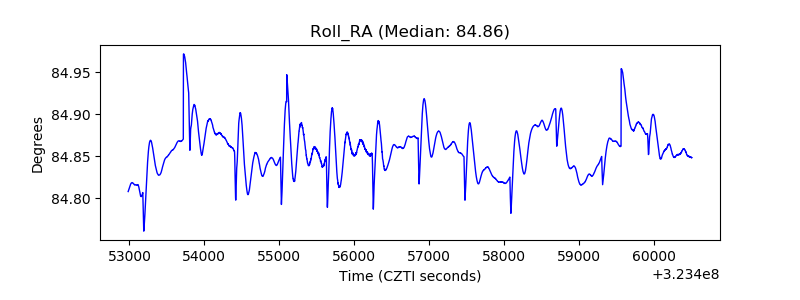 |
| Veto Counter | 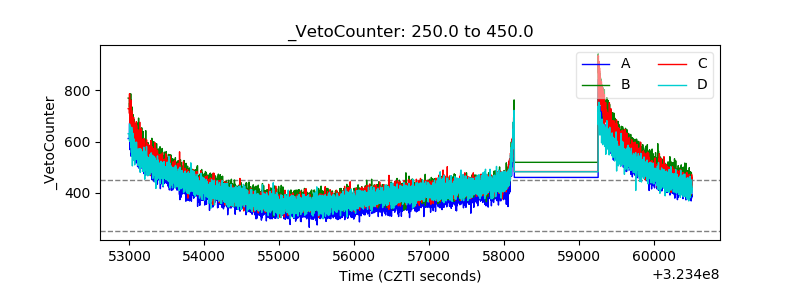 |