| Param | Original file | Final file |
|---|---|---|
| Filename | modeM0/AS1A08_008T01_9000003596_24389cztM0_level2.evt | modeM0/AS1A08_008T01_9000003596_24389cztM0_level2_quad_clean.evt |
| Size (bytes) | 813,787,200 | 100,177,920 |
| Size | 776.1 MB | 95.5 MB |
| Events in quadrant A | 3,068,460 | 741,613 |
| Events in quadrant B | 3,150,298 | 762,679 |
| Events in quadrant C | 13,902,261 | 423,816 |
| Events in quadrant D | 4,108,966 | 674,906 |
| Mode SS | |||
|---|---|---|---|
| Quadrant | BADHDUFLAG | Total packets | Discarded packets |
| A | 0 | 124 | 0 |
| B | 0 | 124 | 0 |
| C | 0 | 124 | 0 |
| D | 0 | 124 | 0 |
| Mode M0 | |||
|---|---|---|---|
| Quadrant | BADHDUFLAG | Total packets | Discarded packets |
| A | 0 | 12951 | 2 |
| B | 0 | 13128 | 2 |
| C | 0 | 45453 | 2 |
| D | 0 | 16249 | 2 |
| Mode M9 | |||
|---|---|---|---|
| Quadrant | BADHDUFLAG | Total packets | Discarded packets |
| A | 0 | 15 | 0 |
| B | 0 | 16 | 0 |
| C | 0 | 16 | 0 |
| D | 0 | 16 | 0 |
| Quadrant | Total seconds | Saturated seconds | Saturation percentage |
|---|---|---|---|
| A | 6144 | 25 | 0.406901% |
| B | 6144 | 33 | 0.537109% |
| C | 6144 | 5333 | 86.800130% |
| D | 6144 | 266 | 4.329427% |
Noise dominated data is calculated using 1-second bins in cleaned event files. If a bin has >2000 counts, and if more than 50% of those come from <1% of pixels, then it is considered to be noise-dominated and hence unusable.
| Quadrant | # 1 sec bins | Bins with >0 counts | Bins with >2000 counts | High rate bins dominated by noise | Noise dominated (total time) | Noise dominated (detector-on time) | Marked lightcurve |
|---|---|---|---|---|---|---|---|
| A | 7444 | 6145 | 0 | 0 | 0.00% | 0.00% | 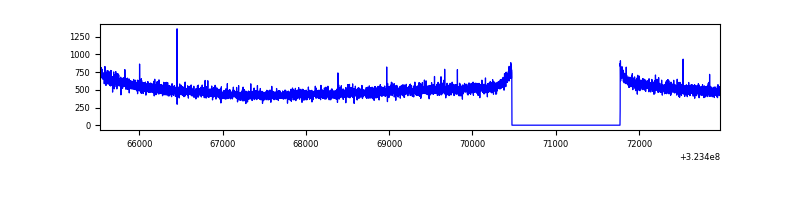 |
| B | 7444 | 6145 | 0 | 0 | 0.00% | 0.00% | 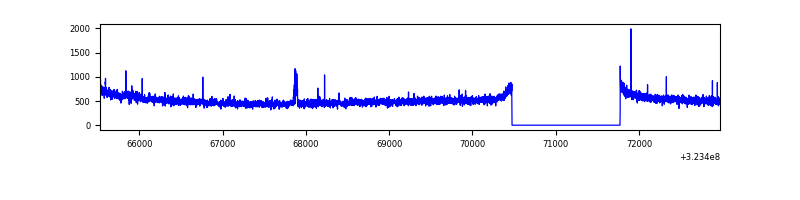 |
| C | 7444 | 6145 | 4894 | 4894 | 65.74% | 79.64% | 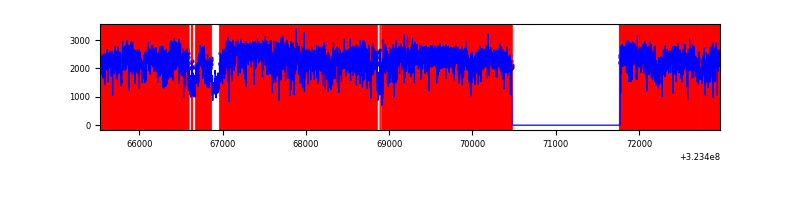 |
| D | 7444 | 6145 | 232 | 232 | 3.12% | 3.78% | 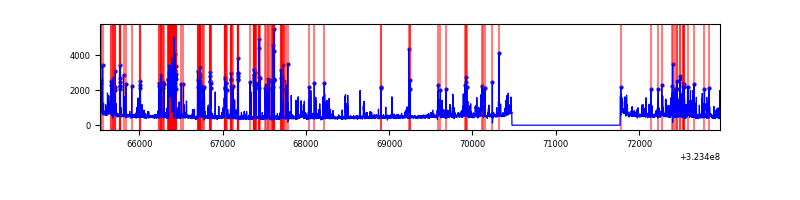 |
Top three noisy pixels from each quadrant. If the there are fewer than three noisy pixels in the level2.evt file, extra rows are filled as -1
| Pixel properties | Quadrant properties | ||||||
|---|---|---|---|---|---|---|---|
| Quadrant | DetID | PixID | Counts | Sigma | Mean | Median | Sigma |
| A | 13 | 254 | 10573 | 61.2 | 796 | 780 | 160.0 |
| A | 0 | 226 | 6896 | 38.22 | 796 | 780 | 160.0 |
| A | 3 | 137 | 6861 | 38.0 | 796 | 780 | 160.0 |
| B | 0 | 230 | 19490 | 126.24 | 797 | 779 | 148.2 |
| B | 12 | 111 | 17151 | 110.46 | 797 | 779 | 148.2 |
| B | 11 | 111 | 15322 | 98.12 | 797 | 779 | 148.2 |
| C | 7 | 247 | 11805391 | 103149.36 | 504 | 507 | 114.4 |
| C | 14 | 238 | 78296 | 679.71 | 504 | 507 | 114.4 |
| C | 7 | 226 | 31073 | 267.08 | 504 | 507 | 114.4 |
| D | 1 | 52 | 993059 | 5630.69 | 741 | 721 | 176.2 |
| D | 12 | 233 | 244186 | 1381.46 | 741 | 721 | 176.2 |
| D | 2 | 234 | 27929 | 154.38 | 741 | 721 | 176.2 |
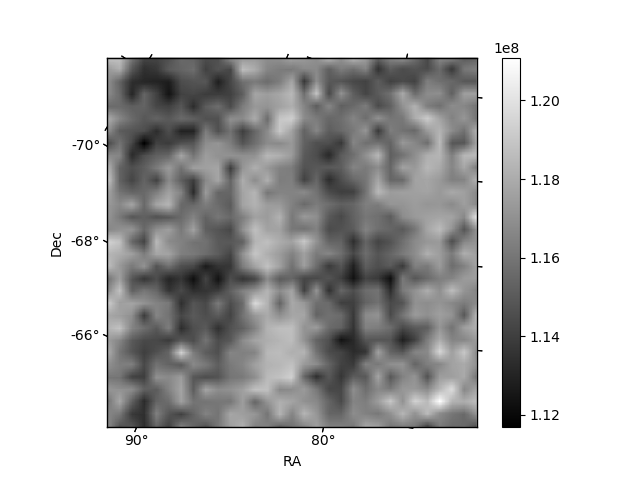
Histogram calculated using DETX and DETY for each event in the final _common_clean file
| Quadrant A | 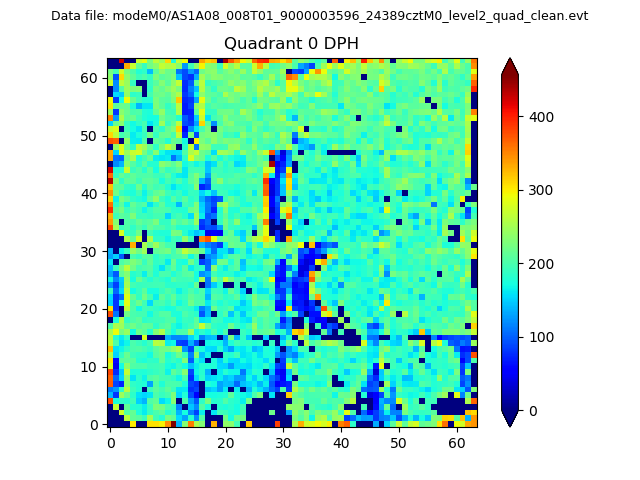 |
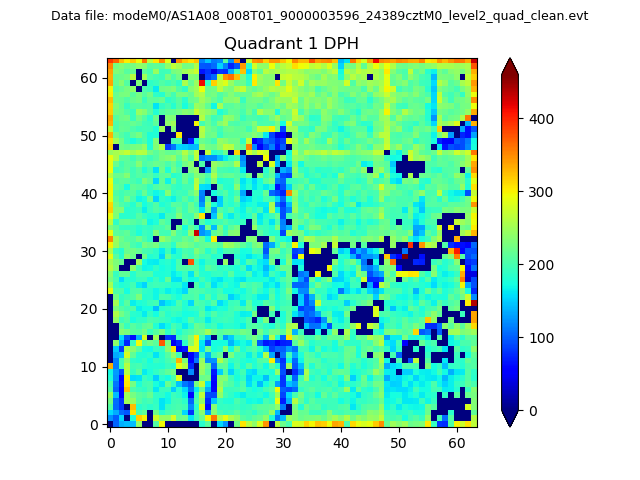 |
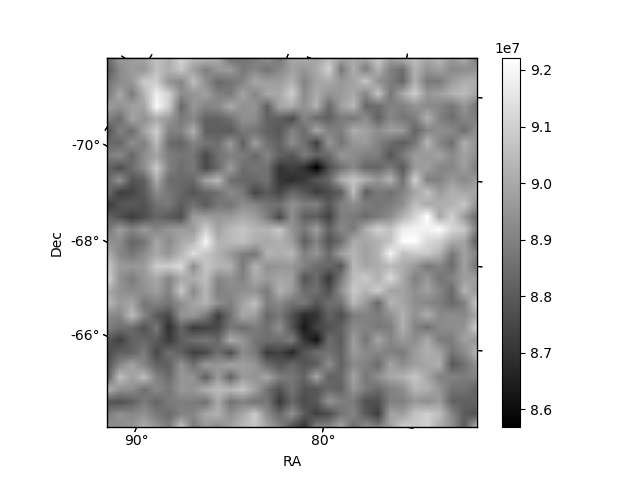
Quadrant B |
|---|---|---|---|
| Quadrant D | 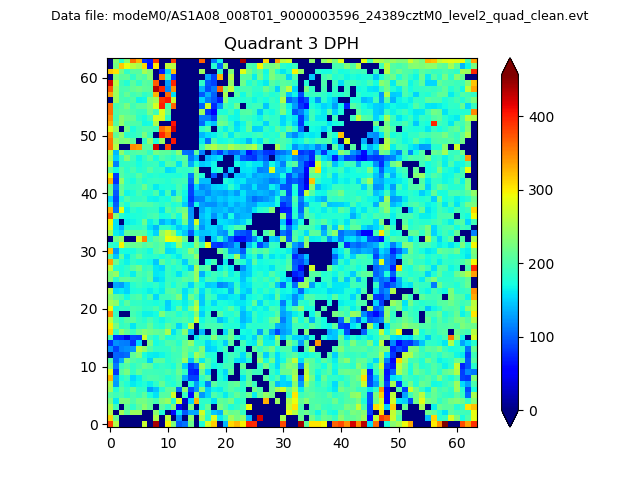 |
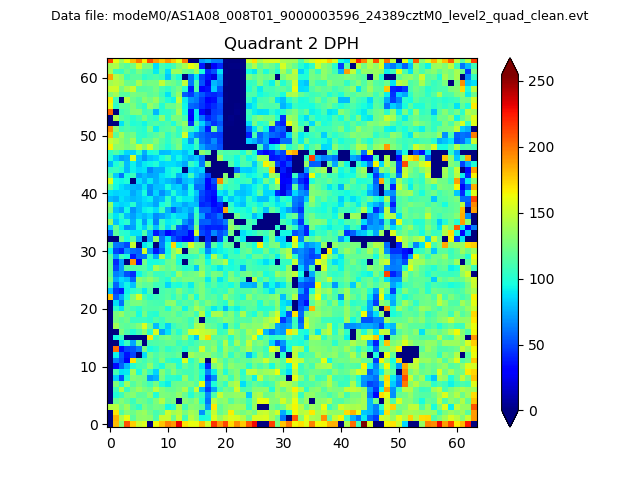 |
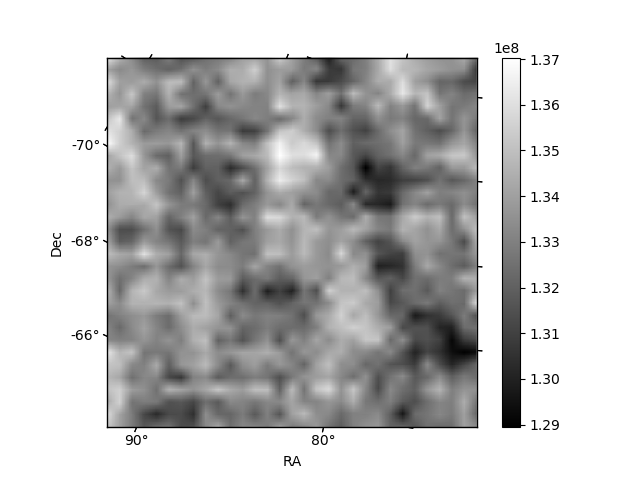
Quadrant C |
| Plot type | Count rate plots | Images |
|---|---|---|
| Comparison with Poisson distribution Blue bars denote a histogram of data divided into 1 sec bins. Red curve is a Poisson curve with rate = median count rate of data. |
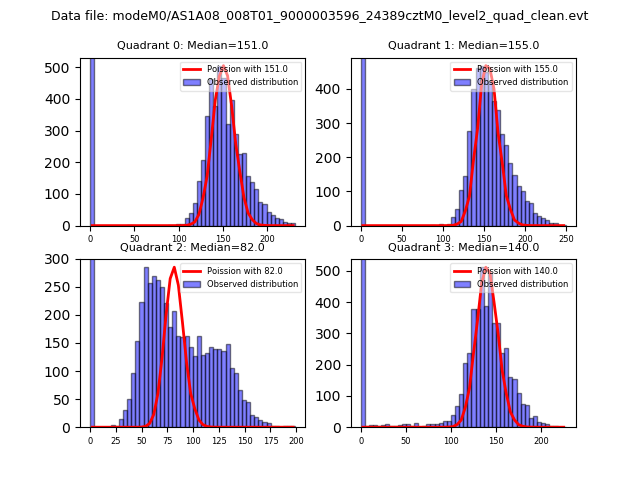 |
 |
| Quadrant-wise count rates Data is divided into 100 sec bins |
 |
|
| Module-wise count rates for Quadrant A Data is divided into 100 sec bins |
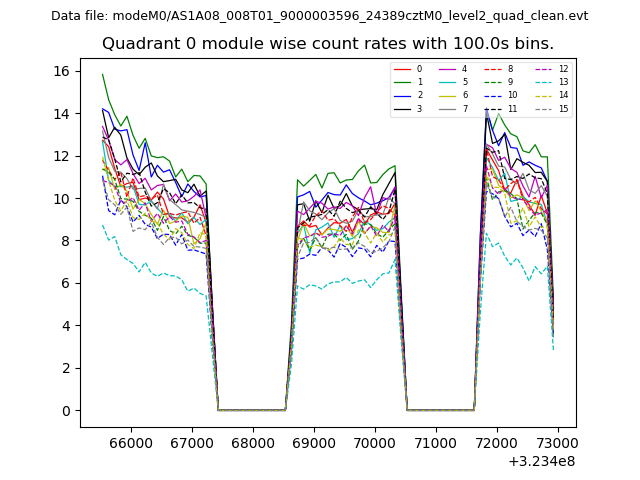 |
 |
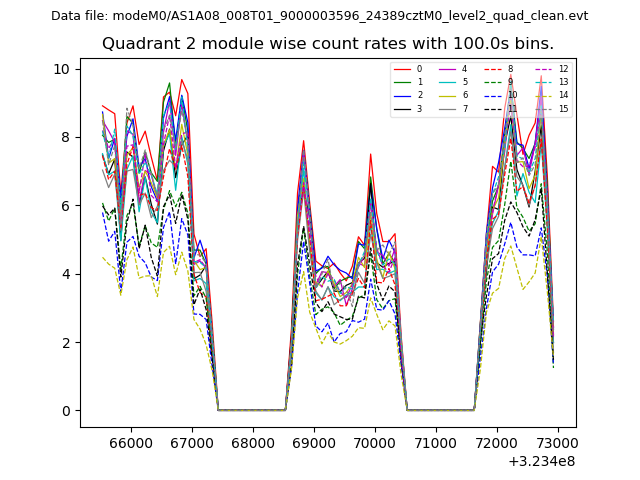
| Module-wise count rates for Quadrant B Data is divided into 100 sec bins |
 |
 |
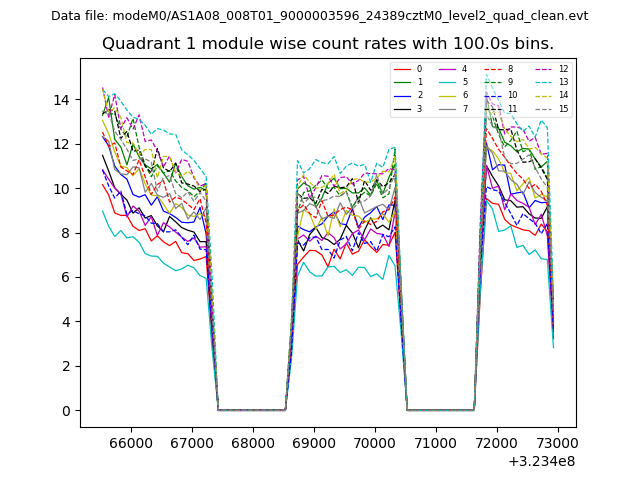
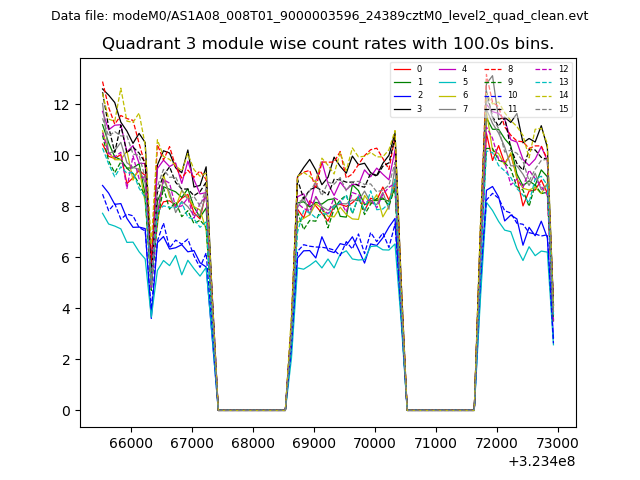
| Module-wise count rates for Quadrant C Data is divided into 100 sec bins |
 |
 |
| Module-wise count rates for Quadrant D Data is divided into 100 sec bins |
 |
 |
| Parameter | Plot |
|---|---|
| CZT HV Monitor | 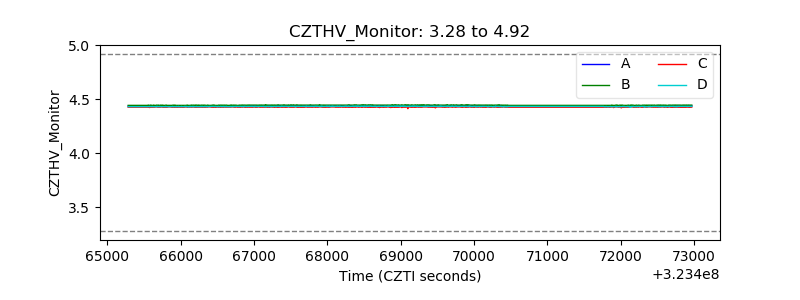 |
| D_VDD | 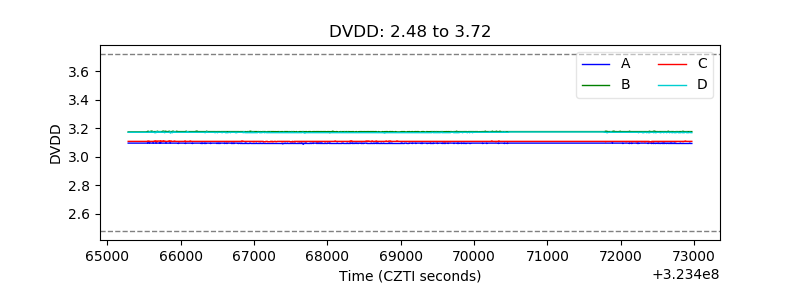 |
| Temperature 1 |  |
| Veto HV Monitor | 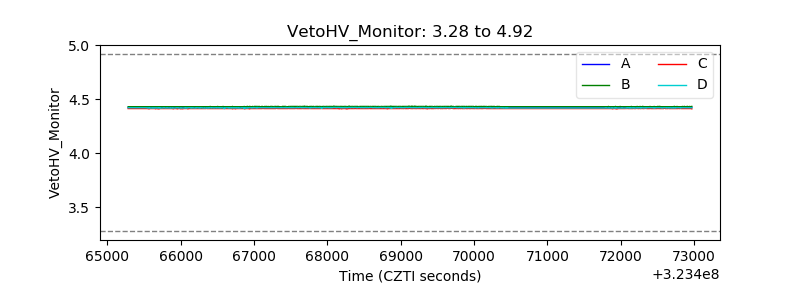 |
| Veto LLD |  |
| Alpha Counter | 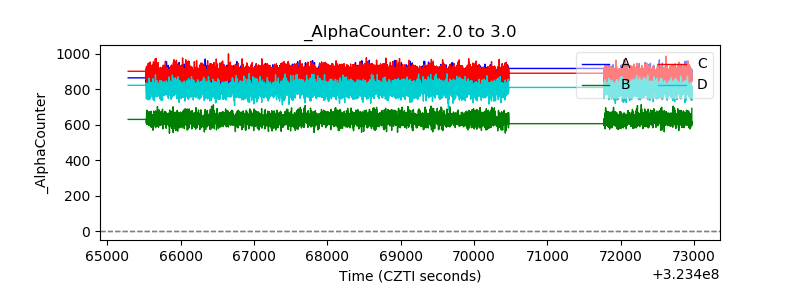 |
| _CPM_Rate | 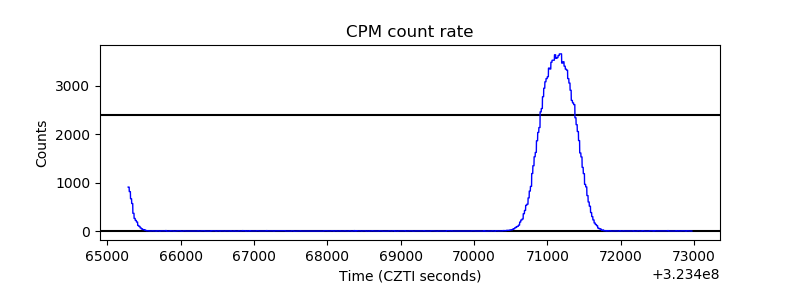 |
| CZT Counter | 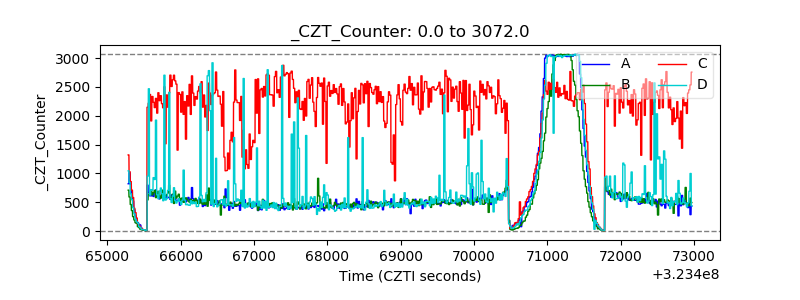 |
| +2.5 Volts monitor |  |
| +5 Volts monitor |  |
| _ROLL_ROT | 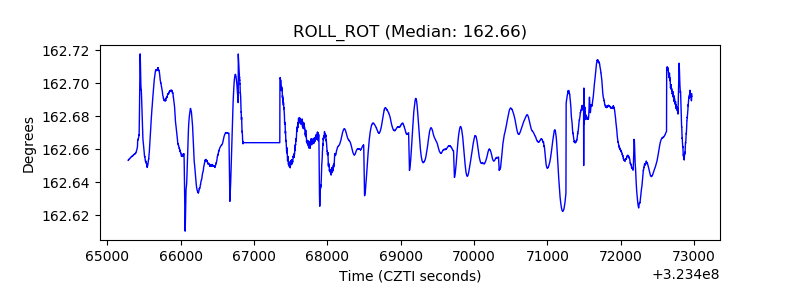 |
| _Roll_DEC |  |
| _Roll_RA | 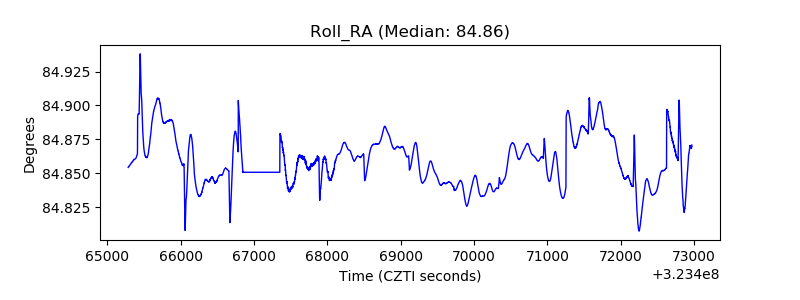 |
| Veto Counter | 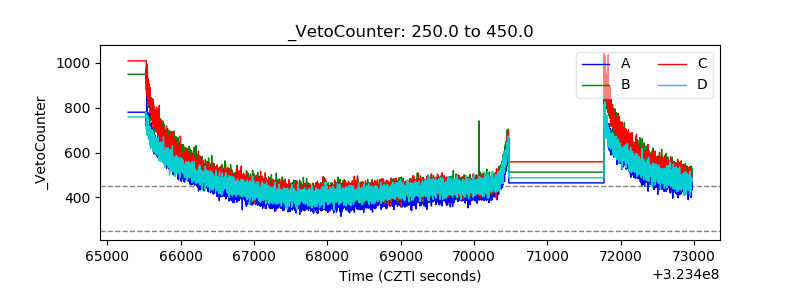 |