| Param | Original file | Final file |
|---|---|---|
| Filename | modeM0/AS1A08_008T01_9000003596_24390cztM0_level2.evt | modeM0/AS1A08_008T01_9000003596_24390cztM0_level2_quad_clean.evt |
| Size (bytes) | 694,434,240 | 102,268,800 |
| Size | 662.3 MB | 97.5 MB |
| Events in quadrant A | 3,083,988 | 707,294 |
| Events in quadrant B | 3,192,210 | 730,042 |
| Events in quadrant C | 10,214,824 | 573,148 |
| Events in quadrant D | 4,120,611 | 652,717 |
| Mode SS | |||
|---|---|---|---|
| Quadrant | BADHDUFLAG | Total packets | Discarded packets |
| A | 0 | 128 | 0 |
| B | 0 | 128 | 0 |
| C | 0 | 128 | 0 |
| D | 0 | 128 | 0 |
| Mode M0 | |||
|---|---|---|---|
| Quadrant | BADHDUFLAG | Total packets | Discarded packets |
| A | 0 | 12943 | 2 |
| B | 0 | 13165 | 2 |
| C | 0 | 34650 | 2 |
| D | 0 | 16322 | 2 |
| Mode M9 | |||
|---|---|---|---|
| Quadrant | BADHDUFLAG | Total packets | Discarded packets |
| A | 0 | 15 | 0 |
| B | 0 | 16 | 0 |
| C | 0 | 16 | 0 |
| D | 0 | 16 | 0 |
| Quadrant | Total seconds | Saturated seconds | Saturation percentage |
|---|---|---|---|
| A | 6197 | 25 | 0.403421% |
| B | 6197 | 43 | 0.693884% |
| C | 6197 | 2325 | 37.518154% |
| D | 6197 | 190 | 3.066000% |
Noise dominated data is calculated using 1-second bins in cleaned event files. If a bin has >2000 counts, and if more than 50% of those come from <1% of pixels, then it is considered to be noise-dominated and hence unusable.
| Quadrant | # 1 sec bins | Bins with >0 counts | Bins with >2000 counts | High rate bins dominated by noise | Noise dominated (total time) | Noise dominated (detector-on time) | Marked lightcurve |
|---|---|---|---|---|---|---|---|
| A | 7547 | 6198 | 0 | 0 | 0.00% | 0.00% | 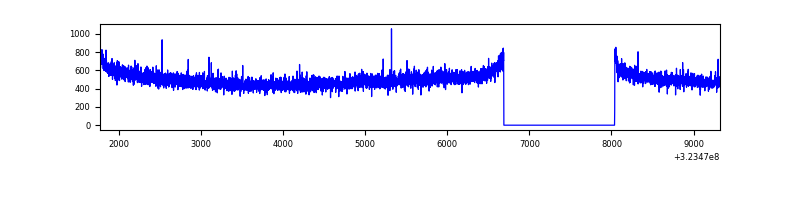 |
| B | 7547 | 6198 | 1 | 1 | 0.01% | 0.02% | 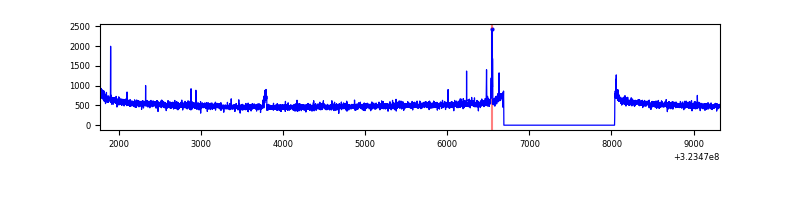 |
| C | 7547 | 6198 | 1789 | 1789 | 23.70% | 28.86% | 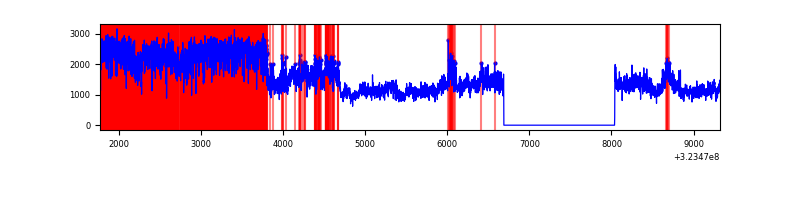 |
| D | 7547 | 6198 | 138 | 138 | 1.83% | 2.23% | 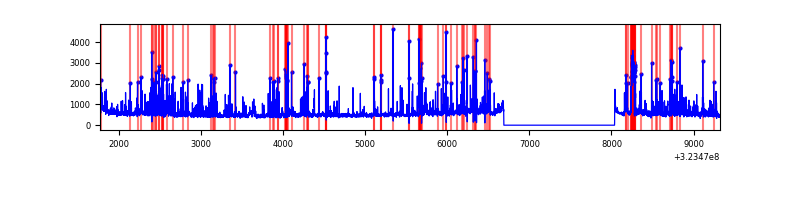 |
Top three noisy pixels from each quadrant. If the there are fewer than three noisy pixels in the level2.evt file, extra rows are filled as -1
| Pixel properties | Quadrant properties | ||||||
|---|---|---|---|---|---|---|---|
| Quadrant | DetID | PixID | Counts | Sigma | Mean | Median | Sigma |
| A | 13 | 254 | 10216 | 60.02 | 799 | 786 | 157.1 |
| A | 0 | 226 | 6881 | 38.8 | 799 | 786 | 157.1 |
| A | 3 | 137 | 6833 | 38.49 | 799 | 786 | 157.1 |
| B | 0 | 190 | 24791 | 161.21 | 804 | 786 | 148.9 |
| B | 0 | 230 | 18016 | 115.71 | 804 | 786 | 148.9 |
| B | 12 | 111 | 17071 | 109.36 | 804 | 786 | 148.9 |
| C | 7 | 247 | 7425381 | 48472.02 | 676 | 681 | 153.2 |
| C | 14 | 238 | 108414 | 703.33 | 676 | 681 | 153.2 |
| C | 2 | 16 | 28958 | 184.61 | 676 | 681 | 153.2 |
| D | 1 | 52 | 909359 | 4993.77 | 757 | 736 | 182.0 |
| D | 12 | 233 | 112173 | 612.46 | 757 | 736 | 182.0 |
| D | 7 | 223 | 64044 | 347.94 | 757 | 736 | 182.0 |
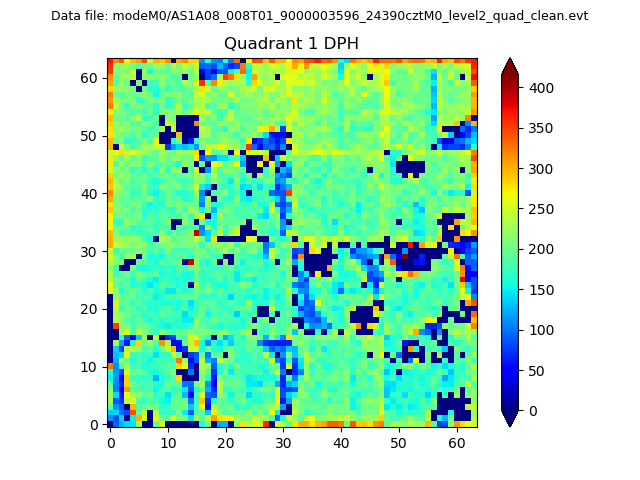
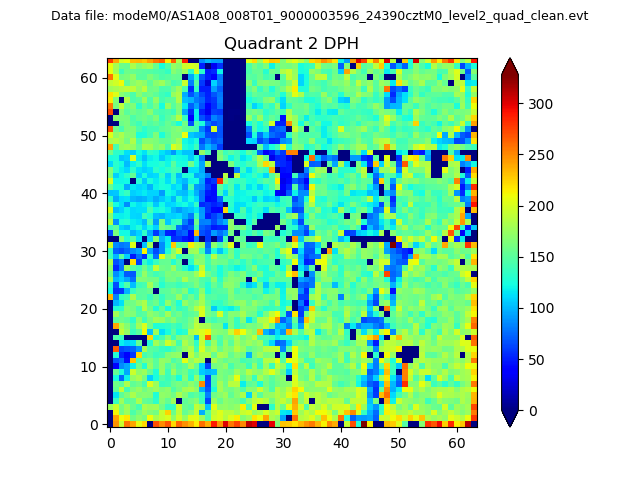
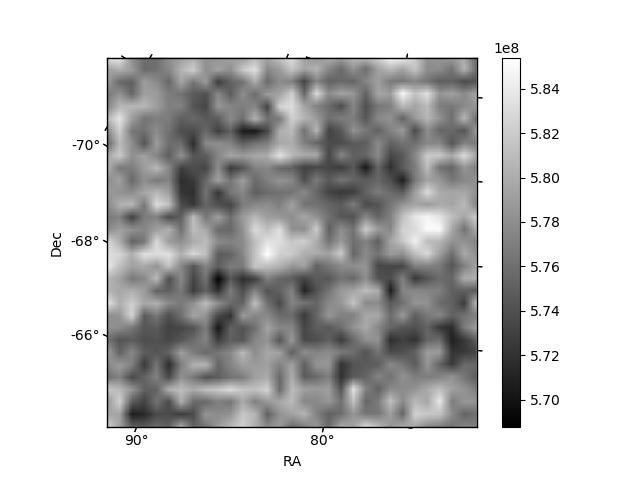
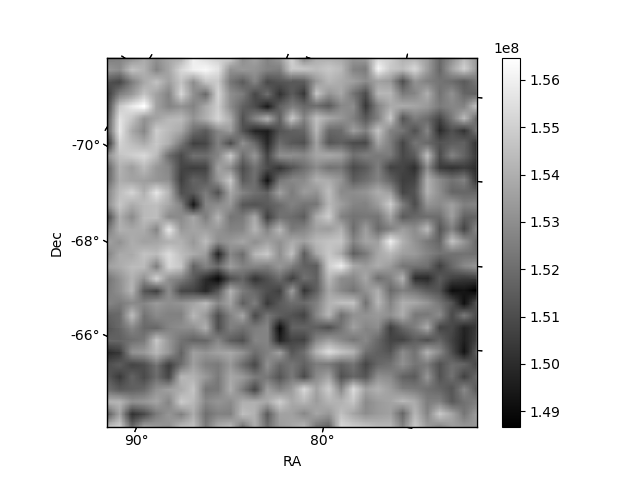
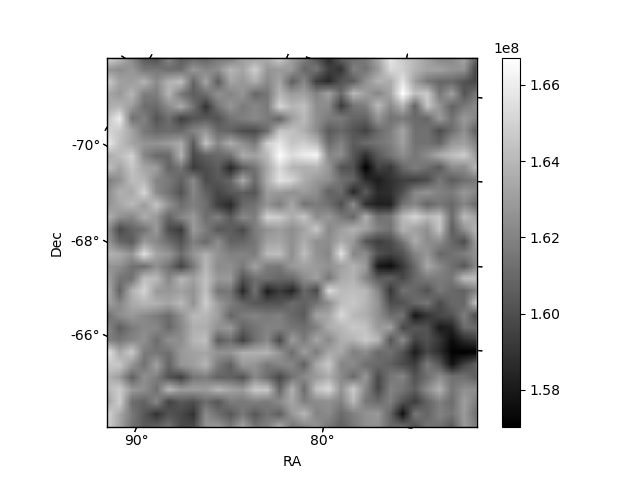
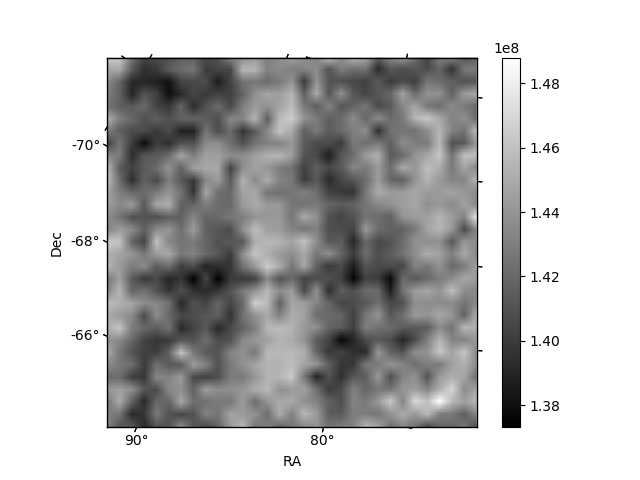
Histogram calculated using DETX and DETY for each event in the final _common_clean file
| Quadrant A |  |
 |
Quadrant B |
|---|---|---|---|
| Quadrant D | 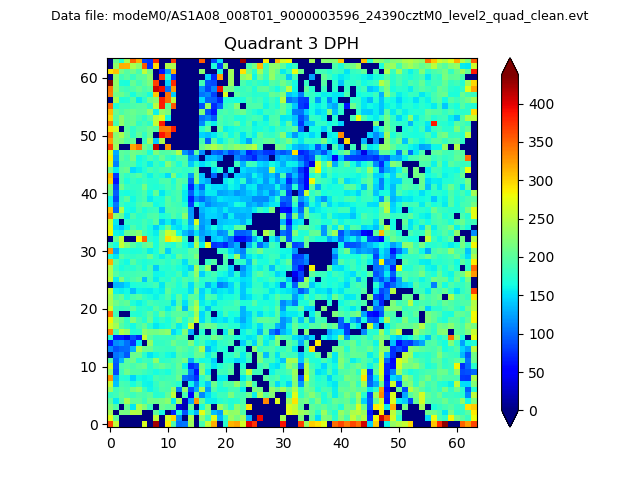 |
 |
Quadrant C |
| Plot type | Count rate plots | Images |
|---|---|---|
| Comparison with Poisson distribution Blue bars denote a histogram of data divided into 1 sec bins. Red curve is a Poisson curve with rate = median count rate of data. |
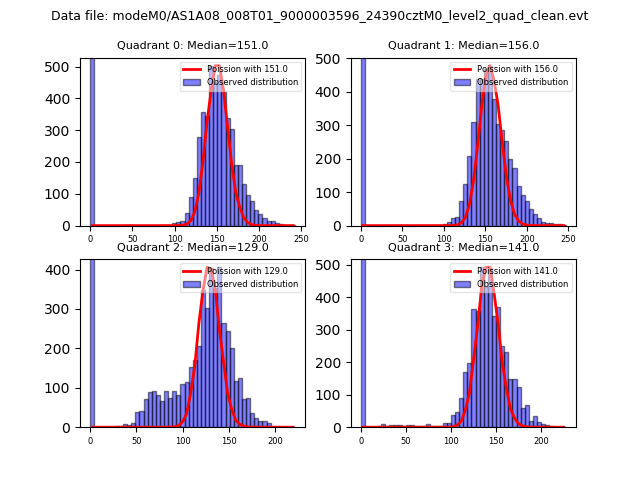 |
 |
| Quadrant-wise count rates Data is divided into 100 sec bins |
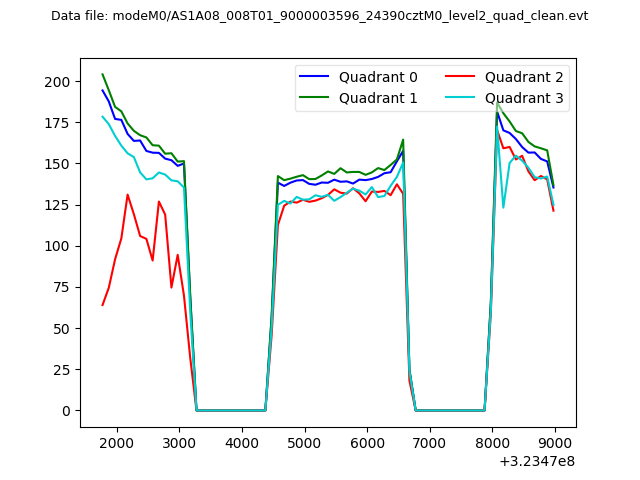 |
|
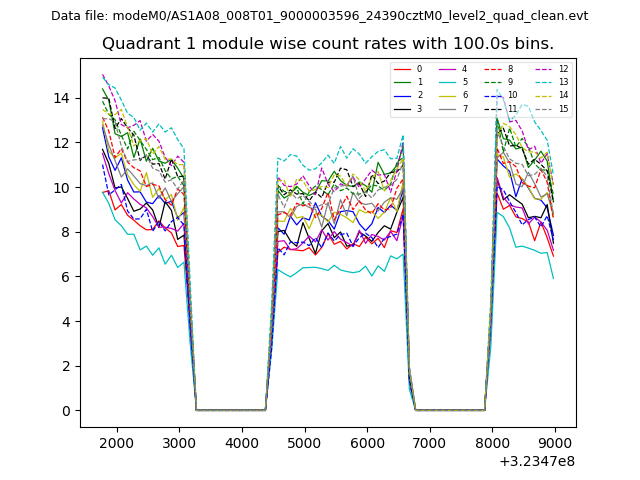
| Module-wise count rates for Quadrant A Data is divided into 100 sec bins |
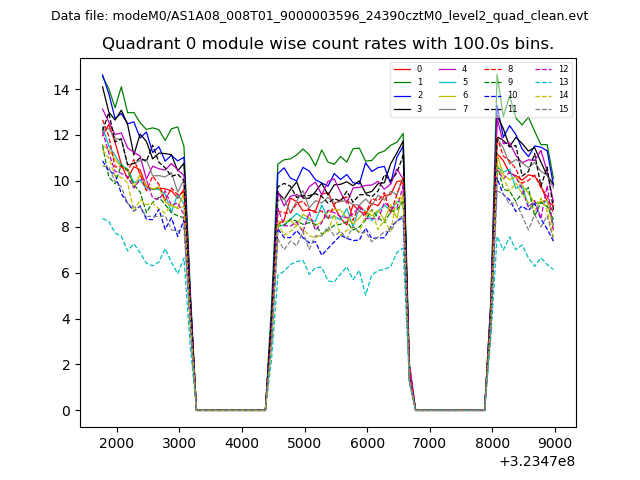 |
 |
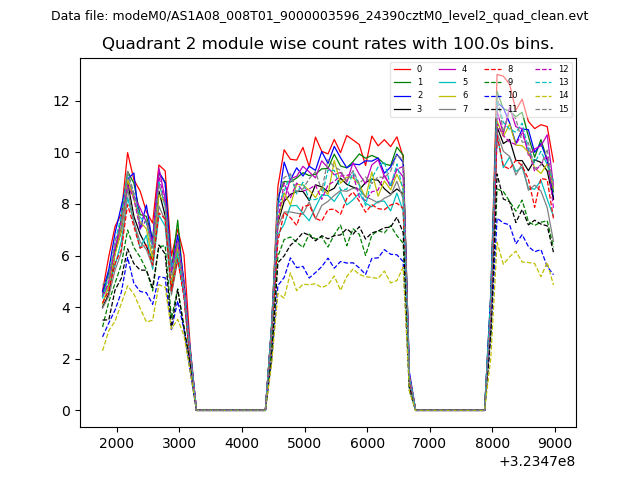
| Module-wise count rates for Quadrant B Data is divided into 100 sec bins |
 |
 |
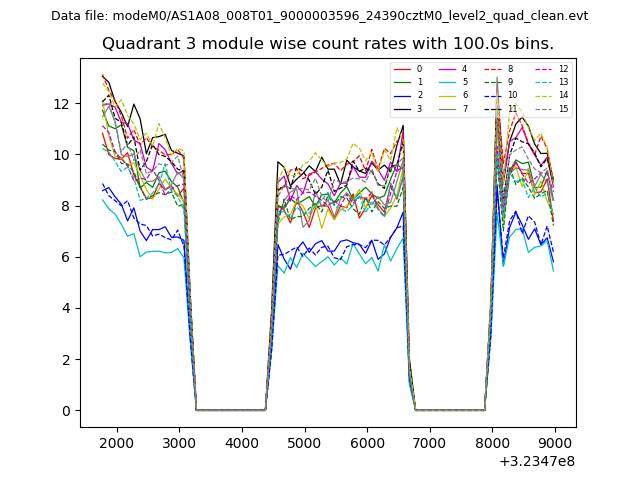
| Module-wise count rates for Quadrant C Data is divided into 100 sec bins |
 |
 |
| Module-wise count rates for Quadrant D Data is divided into 100 sec bins |
 |
 |
| Parameter | Plot |
|---|---|
| CZT HV Monitor | 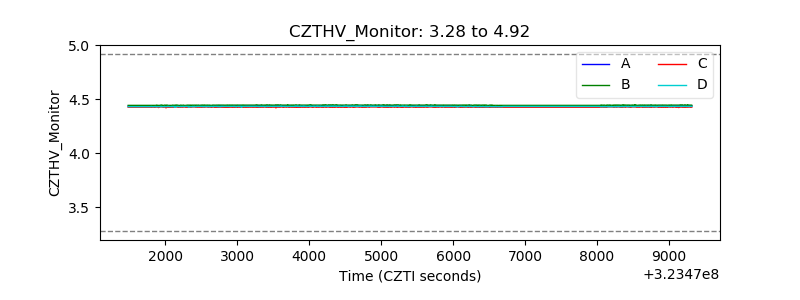 |
| D_VDD | 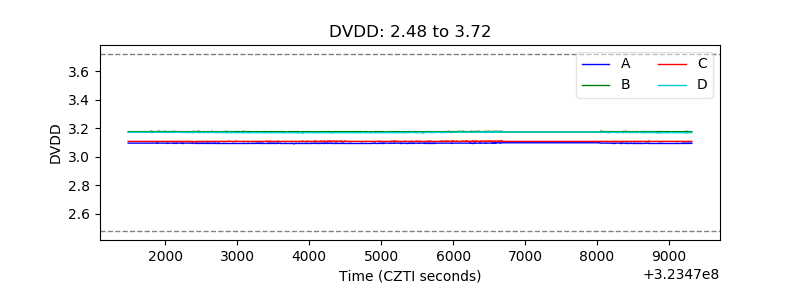 |
| Temperature 1 | 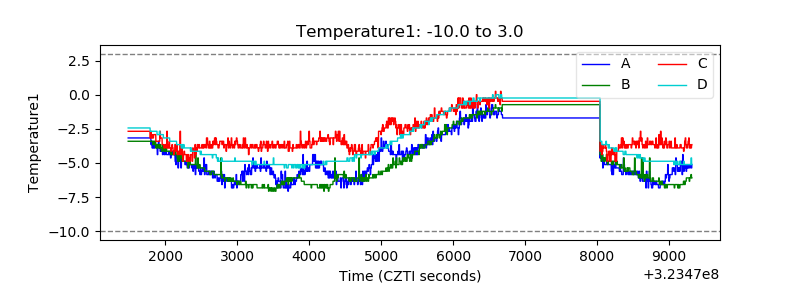 |
| Veto HV Monitor | 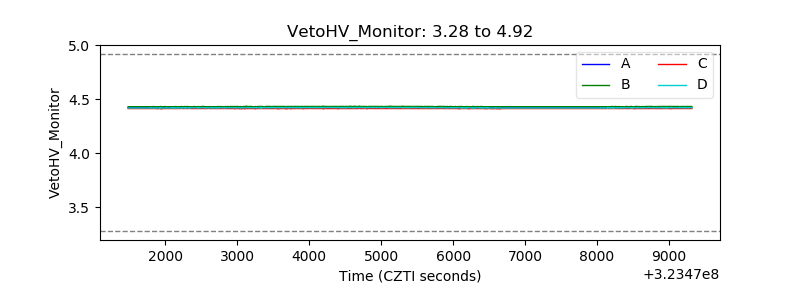 |
| Veto LLD | 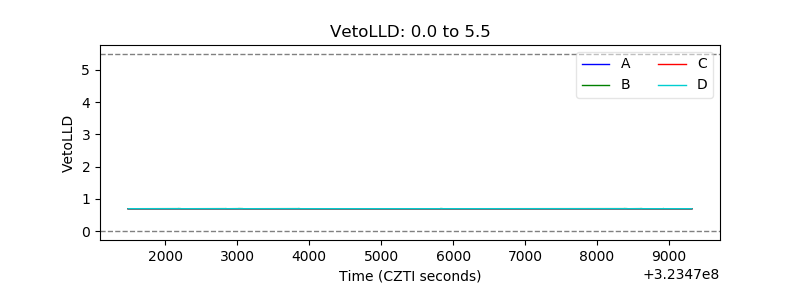 |
| Alpha Counter | 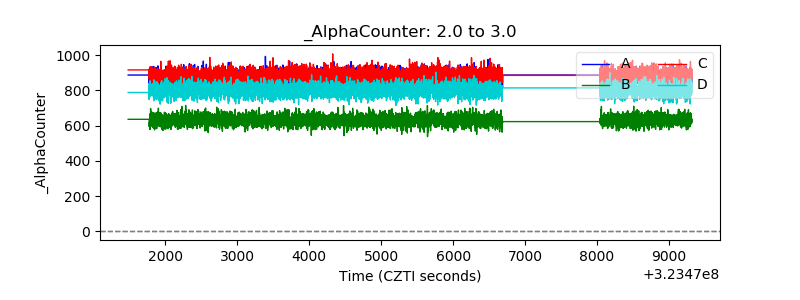 |
| _CPM_Rate | 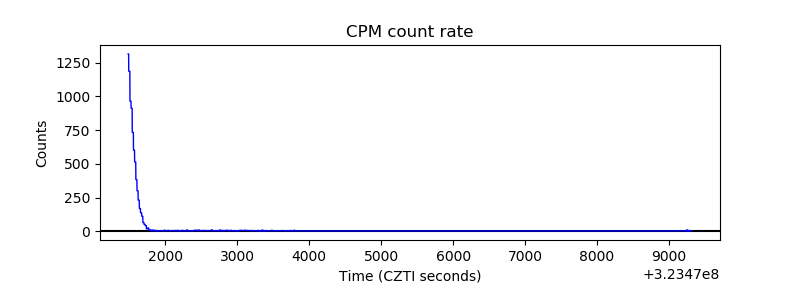 |
| CZT Counter | 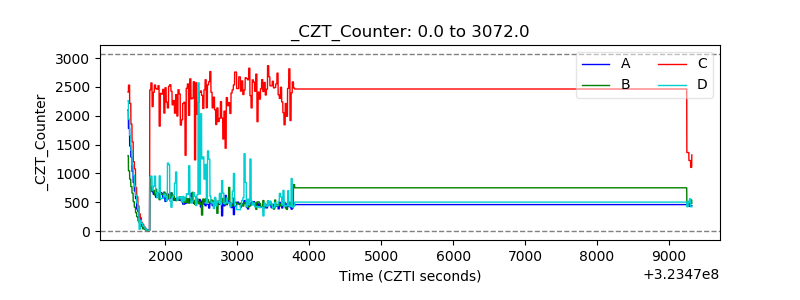 |
| +2.5 Volts monitor |  |
| +5 Volts monitor | 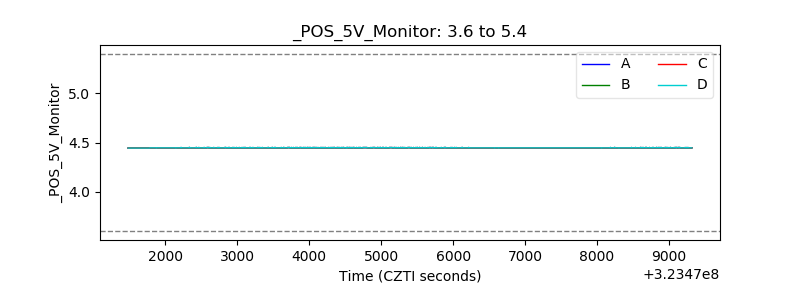 |
| _ROLL_ROT | 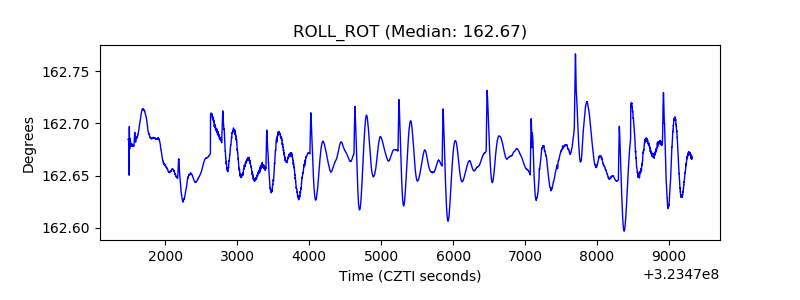 |
| _Roll_DEC | 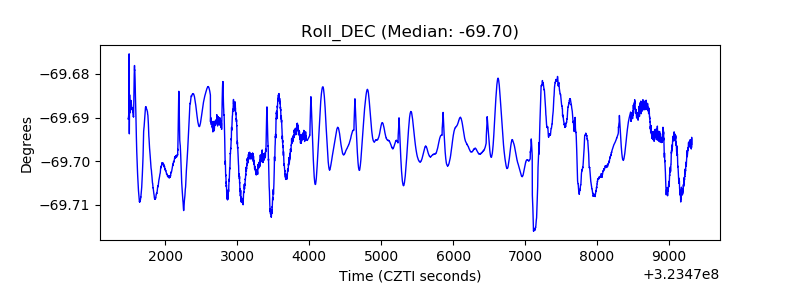 |
| _Roll_RA | 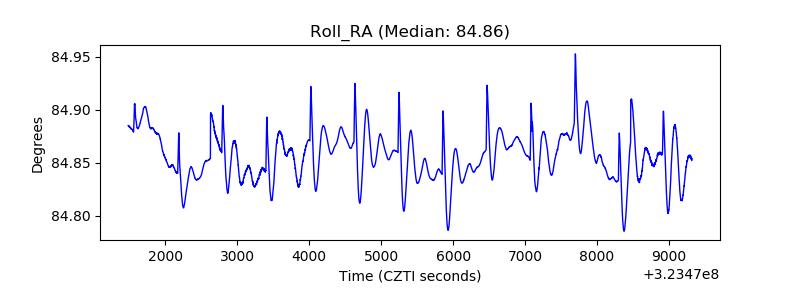 |
| Veto Counter | 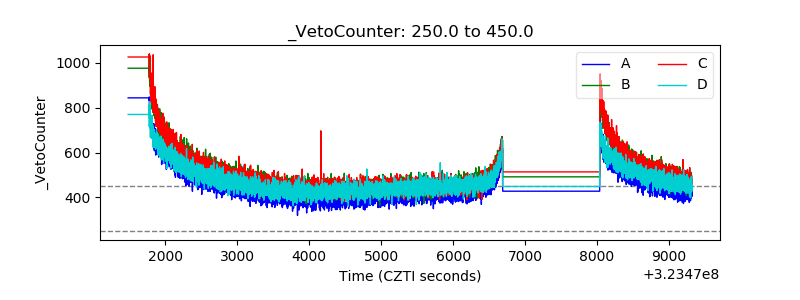 |