| Param | Original file | Final file |
|---|---|---|
| Filename | modeM0/AS1A08_008T01_9000003596_24391cztM0_level2.evt | modeM0/AS1A08_008T01_9000003596_24391cztM0_level2_quad_clean.evt |
| Size (bytes) | 611,498,880 | 94,403,520 |
| Size | 583.2 MB | 90.0 MB |
| Events in quadrant A | 3,057,881 | 625,975 |
| Events in quadrant B | 3,310,341 | 640,963 |
| Events in quadrant C | 7,302,099 | 582,567 |
| Events in quadrant D | 4,427,359 | 573,771 |
| Mode SS | |||
|---|---|---|---|
| Quadrant | BADHDUFLAG | Total packets | Discarded packets |
| A | 0 | 126 | 0 |
| B | 0 | 126 | 0 |
| C | 0 | 126 | 0 |
| D | 0 | 126 | 0 |
| Mode M0 | |||
|---|---|---|---|
| Quadrant | BADHDUFLAG | Total packets | Discarded packets |
| A | 0 | 12859 | 2 |
| B | 0 | 13570 | 2 |
| C | 0 | 26179 | 2 |
| D | 0 | 17248 | 2 |
| Mode M9 | |||
|---|---|---|---|
| Quadrant | BADHDUFLAG | Total packets | Discarded packets |
| A | 0 | 24 | 0 |
| B | 0 | 25 | 0 |
| C | 0 | 25 | 0 |
| D | 0 | 25 | 0 |
| Quadrant | Total seconds | Saturated seconds | Saturation percentage |
|---|---|---|---|
| A | 6241 | 24 | 0.384554% |
| B | 6241 | 124 | 1.986861% |
| C | 6241 | 485 | 7.771191% |
| D | 6241 | 324 | 5.191476% |
Noise dominated data is calculated using 1-second bins in cleaned event files. If a bin has >2000 counts, and if more than 50% of those come from <1% of pixels, then it is considered to be noise-dominated and hence unusable.
| Quadrant | # 1 sec bins | Bins with >0 counts | Bins with >2000 counts | High rate bins dominated by noise | Noise dominated (total time) | Noise dominated (detector-on time) | Marked lightcurve |
|---|---|---|---|---|---|---|---|
| A | 7531 | 6242 | 1 | 1 | 0.01% | 0.02% | 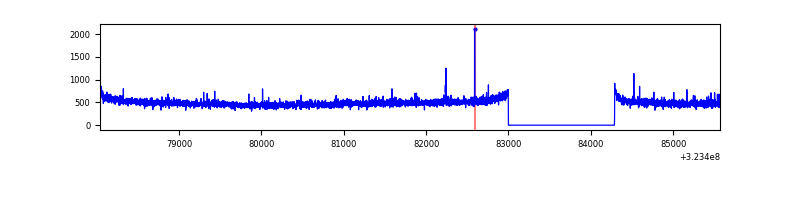 |
| B | 7531 | 6242 | 10 | 10 | 0.13% | 0.16% | 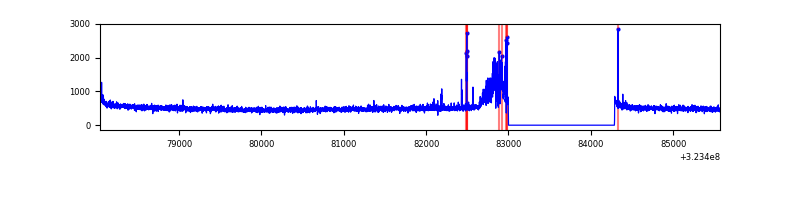 |
| C | 7531 | 6242 | 52 | 52 | 0.69% | 0.83% | 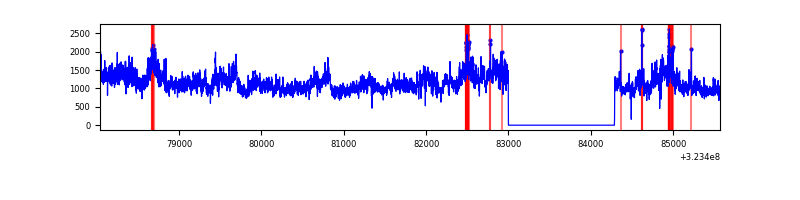 |
| D | 7531 | 6242 | 263 | 263 | 3.49% | 4.21% | 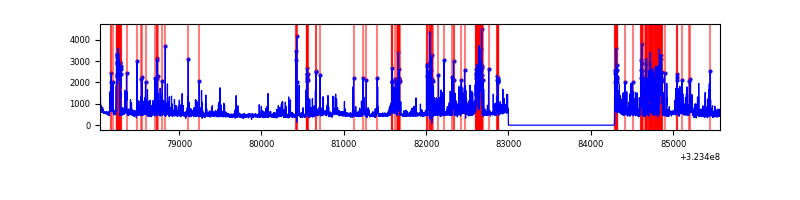 |
Top three noisy pixels from each quadrant. If the there are fewer than three noisy pixels in the level2.evt file, extra rows are filled as -1
| Pixel properties | Quadrant properties | ||||||
|---|---|---|---|---|---|---|---|
| Quadrant | DetID | PixID | Counts | Sigma | Mean | Median | Sigma |
| A | 6 | 10 | 17856 | 109.29 | 787 | 772 | 156.3 |
| A | 13 | 254 | 10606 | 62.91 | 787 | 772 | 156.3 |
| A | 3 | 137 | 6792 | 38.51 | 787 | 772 | 156.3 |
| B | 15 | 33 | 174118 | 1186.03 | 788 | 769 | 146.2 |
| B | 0 | 190 | 26216 | 174.1 | 788 | 769 | 146.2 |
| B | 12 | 111 | 17163 | 112.17 | 788 | 769 | 146.2 |
| C | 7 | 247 | 4223898 | 24777.12 | 747 | 753 | 170.4 |
| C | 14 | 238 | 122216 | 712.62 | 747 | 753 | 170.4 |
| C | 2 | 16 | 21550 | 122.02 | 747 | 753 | 170.4 |
| D | 1 | 52 | 1119339 | 6200.96 | 749 | 727 | 180.4 |
| D | 12 | 233 | 307358 | 1699.79 | 749 | 727 | 180.4 |
| D | 12 | 218 | 50144 | 273.94 | 749 | 727 | 180.4 |
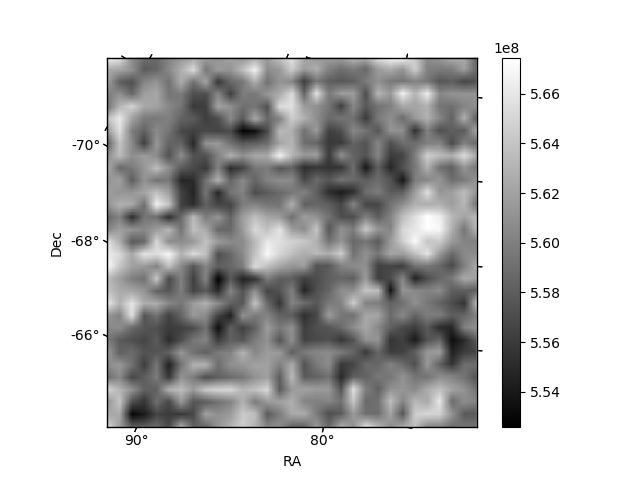
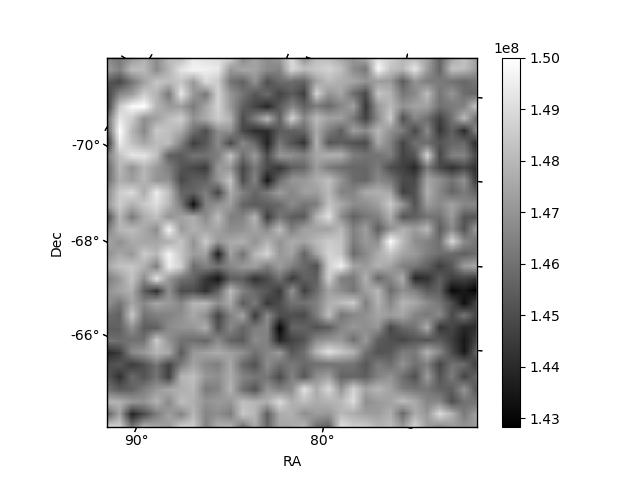
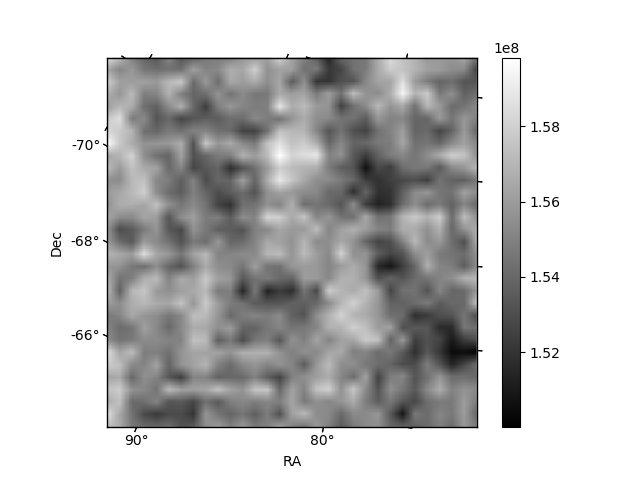
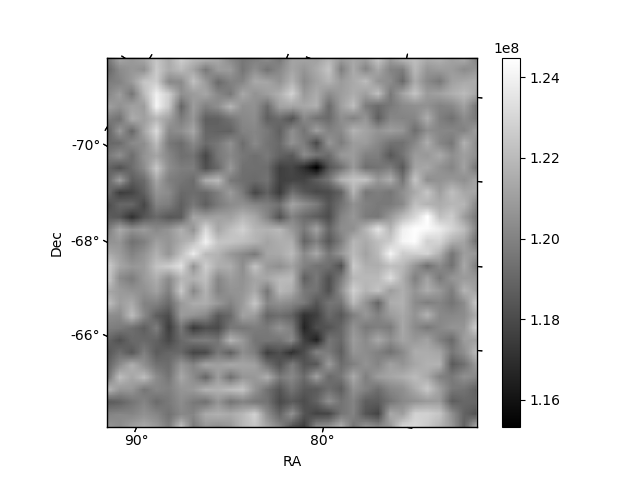
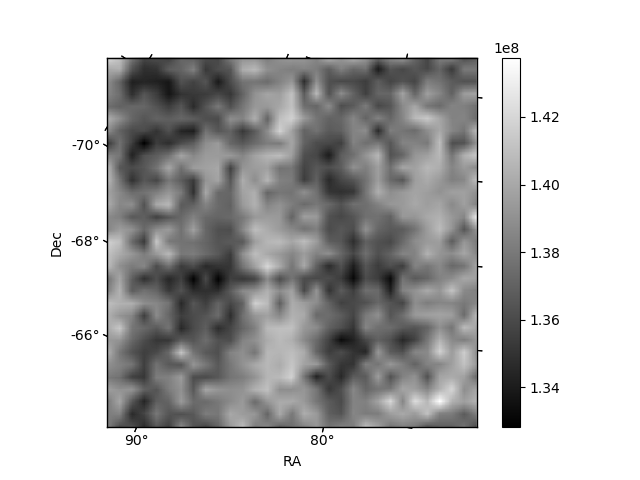
Histogram calculated using DETX and DETY for each event in the final _common_clean file
| Quadrant A | 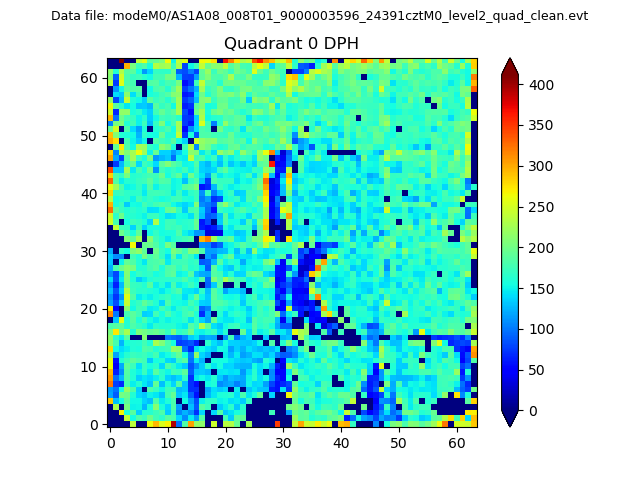 |
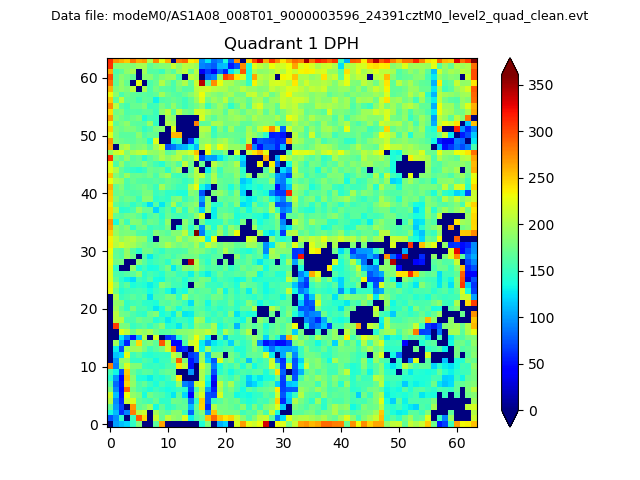 |
Quadrant B |
|---|---|---|---|
| Quadrant D | 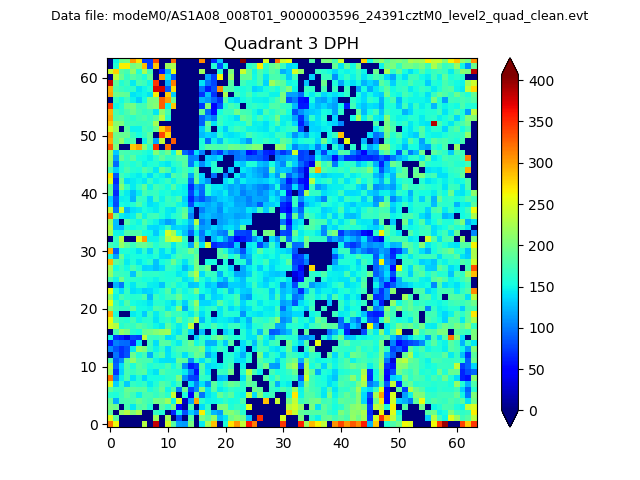 |
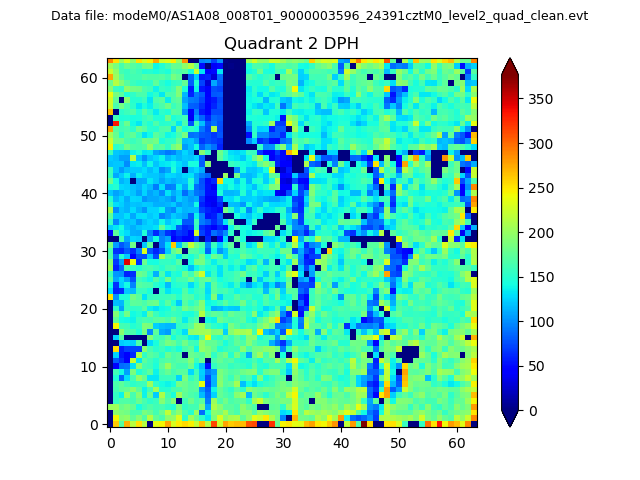 |
Quadrant C |
| Plot type | Count rate plots | Images |
|---|---|---|
| Comparison with Poisson distribution Blue bars denote a histogram of data divided into 1 sec bins. Red curve is a Poisson curve with rate = median count rate of data. |
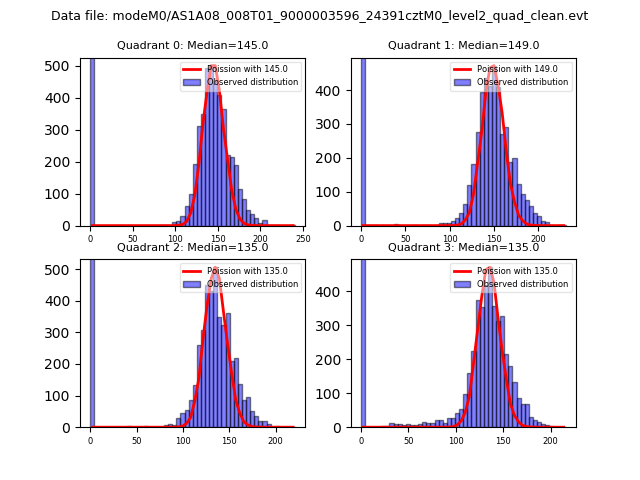 |
 |
| Quadrant-wise count rates Data is divided into 100 sec bins |
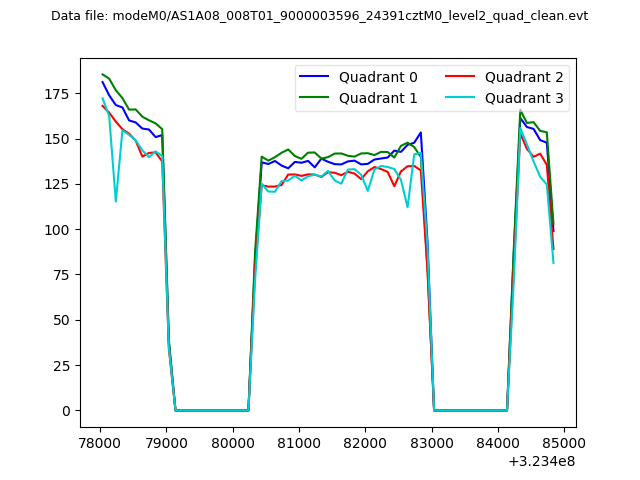 |
|
| Module-wise count rates for Quadrant A Data is divided into 100 sec bins |
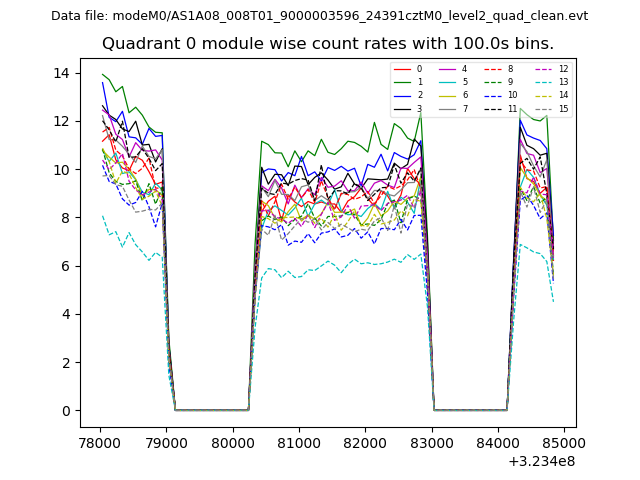 |
 |
| Module-wise count rates for Quadrant B Data is divided into 100 sec bins |
 |
 |
| Module-wise count rates for Quadrant C Data is divided into 100 sec bins |
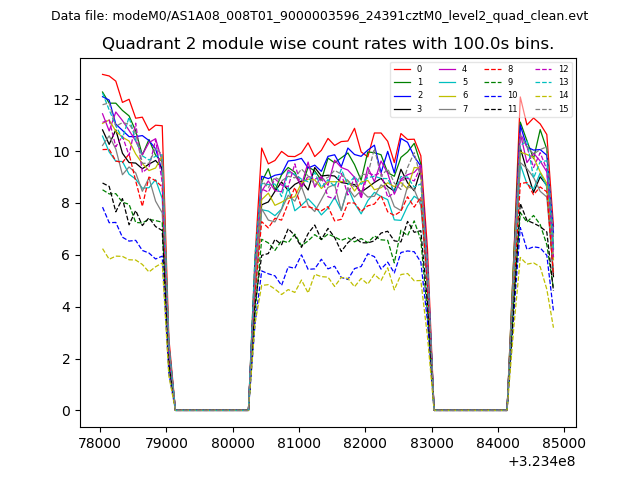 |
 |
| Module-wise count rates for Quadrant D Data is divided into 100 sec bins |
 |
 |
| Parameter | Plot |
|---|---|
| CZT HV Monitor | 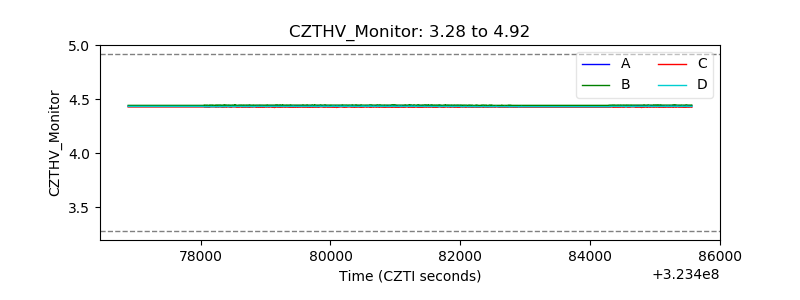 |
| D_VDD | 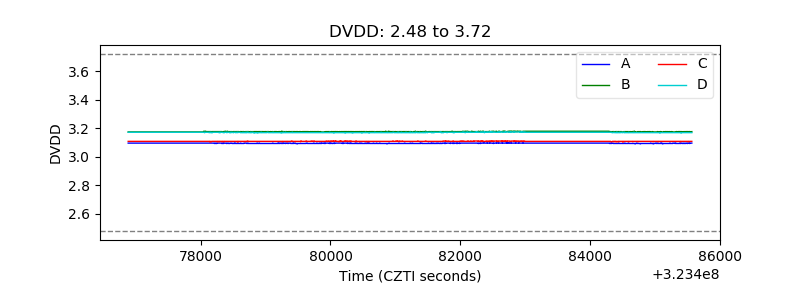 |
| Temperature 1 | 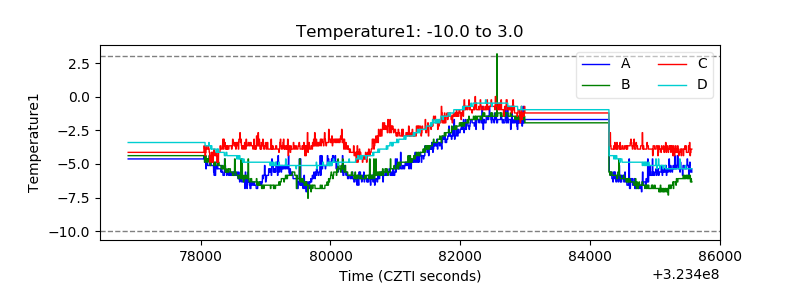 |
| Veto HV Monitor | 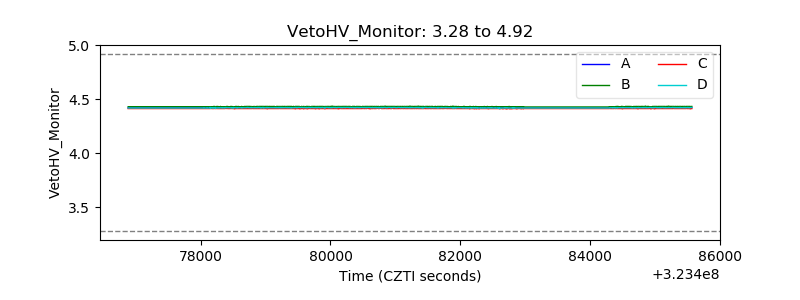 |
| Veto LLD |  |
| Alpha Counter | 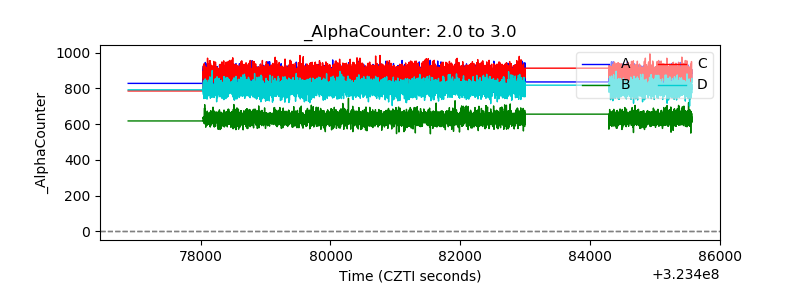 |
| _CPM_Rate | 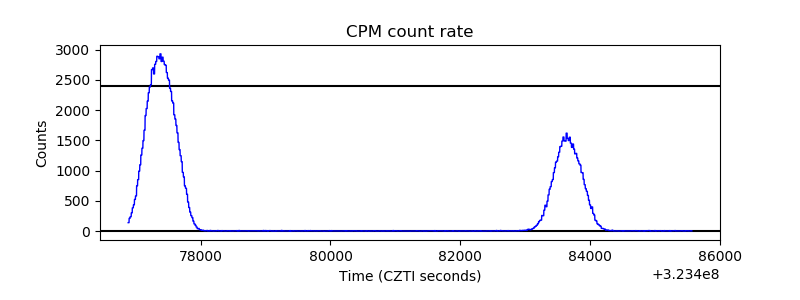 |
| CZT Counter | 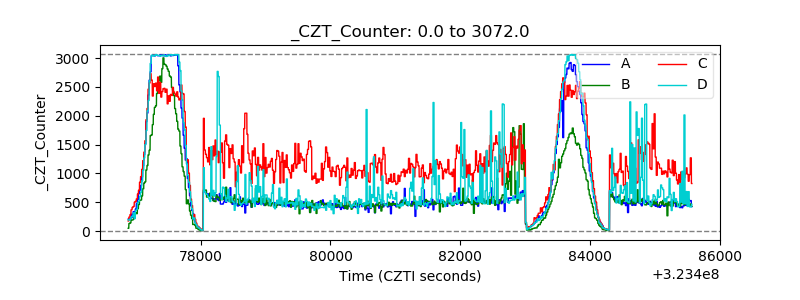 |
| +2.5 Volts monitor |  |
| +5 Volts monitor |  |
| _ROLL_ROT | 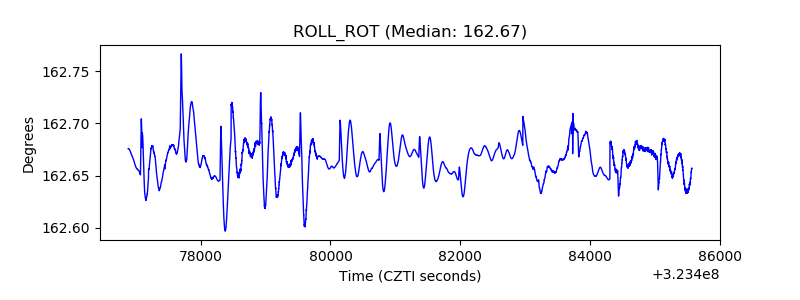 |
| _Roll_DEC | 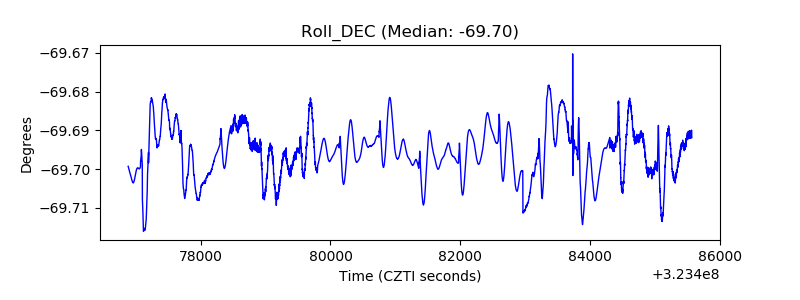 |
| _Roll_RA | 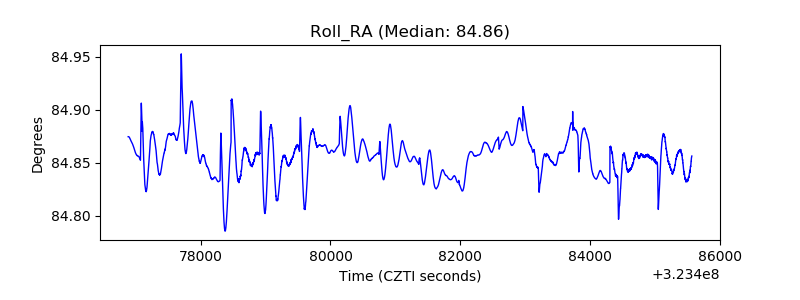 |
| Veto Counter |  |