| Param | Original file | Final file |
|---|---|---|
| Filename | modeM0/AS1A08_008T01_9000003596_24392cztM0_level2.evt | modeM0/AS1A08_008T01_9000003596_24392cztM0_level2_quad_clean.evt |
| Size (bytes) | 675,996,480 | 87,137,280 |
| Size | 644.7 MB | 83.1 MB |
| Events in quadrant A | 3,326,753 | 562,934 |
| Events in quadrant B | 3,305,758 | 578,222 |
| Events in quadrant C | 7,071,643 | 527,607 |
| Events in quadrant D | 6,315,300 | 501,921 |
| Mode SS | |||
|---|---|---|---|
| Quadrant | BADHDUFLAG | Total packets | Discarded packets |
| A | 0 | 136 | 0 |
| B | 0 | 136 | 0 |
| C | 0 | 136 | 0 |
| D | 0 | 136 | 0 |
| Mode M0 | |||
|---|---|---|---|
| Quadrant | BADHDUFLAG | Total packets | Discarded packets |
| A | 0 | 14090 | 2 |
| B | 0 | 13960 | 2 |
| C | 0 | 25887 | 2 |
| D | 0 | 23287 | 2 |
| Mode M9 | |||
|---|---|---|---|
| Quadrant | BADHDUFLAG | Total packets | Discarded packets |
| A | 0 | 21 | 0 |
| B | 0 | 21 | 0 |
| C | 0 | 22 | 0 |
| D | 0 | 22 | 0 |
| Quadrant | Total seconds | Saturated seconds | Saturation percentage |
|---|---|---|---|
| A | 6709 | 19 | 0.283202% |
| B | 6709 | 35 | 0.521687% |
| C | 6709 | 396 | 5.902519% |
| D | 6709 | 873 | 13.012371% |
Noise dominated data is calculated using 1-second bins in cleaned event files. If a bin has >2000 counts, and if more than 50% of those come from <1% of pixels, then it is considered to be noise-dominated and hence unusable.
| Quadrant | # 1 sec bins | Bins with >0 counts | Bins with >2000 counts | High rate bins dominated by noise | Noise dominated (total time) | Noise dominated (detector-on time) | Marked lightcurve |
|---|---|---|---|---|---|---|---|
| A | 7804 | 6710 | 3 | 3 | 0.04% | 0.04% | 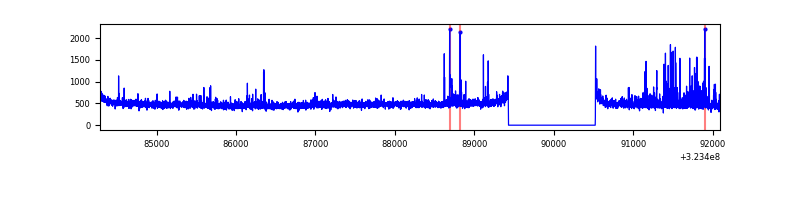 |
| B | 7804 | 6710 | 5 | 5 | 0.06% | 0.07% | 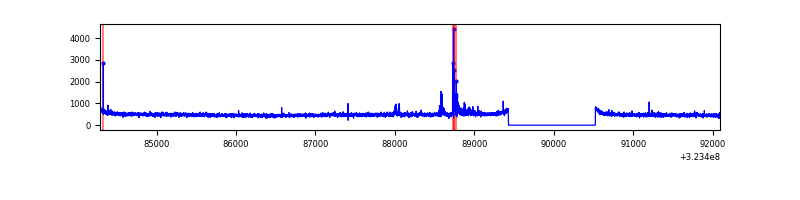 |
| C | 7804 | 6710 | 65 | 65 | 0.83% | 0.97% | 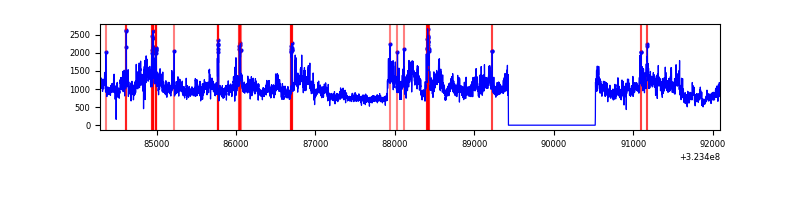 |
| D | 7804 | 6710 | 720 | 720 | 9.23% | 10.73% | 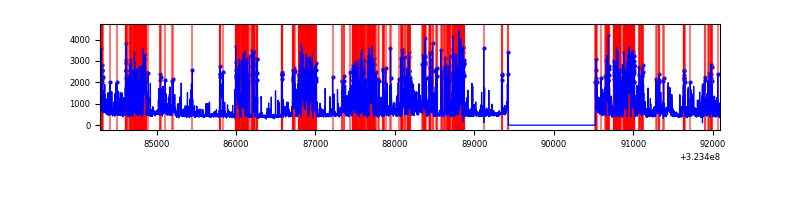 |
Top three noisy pixels from each quadrant. If the there are fewer than three noisy pixels in the level2.evt file, extra rows are filled as -1
| Pixel properties | Quadrant properties | ||||||
|---|---|---|---|---|---|---|---|
| Quadrant | DetID | PixID | Counts | Sigma | Mean | Median | Sigma |
| A | 6 | 10 | 172715 | 1057.52 | 818 | 802 | 162.6 |
| A | 13 | 254 | 10465 | 59.44 | 818 | 802 | 162.6 |
| A | 0 | 226 | 7062 | 38.51 | 818 | 802 | 162.6 |
| B | 15 | 33 | 48982 | 315.35 | 820 | 798 | 152.8 |
| B | 4 | 52 | 20471 | 128.76 | 820 | 798 | 152.8 |
| B | 12 | 111 | 18357 | 114.92 | 820 | 798 | 152.8 |
| C | 7 | 247 | 3878999 | 21797.17 | 780 | 787 | 177.9 |
| C | 14 | 238 | 125840 | 702.85 | 780 | 787 | 177.9 |
| C | 3 | 233 | 15134 | 80.64 | 780 | 787 | 177.9 |
| D | 1 | 52 | 3251180 | 17762.54 | 760 | 736 | 183.0 |
| D | 12 | 233 | 129429 | 703.26 | 760 | 736 | 183.0 |
| D | 2 | 234 | 29547 | 157.44 | 760 | 736 | 183.0 |
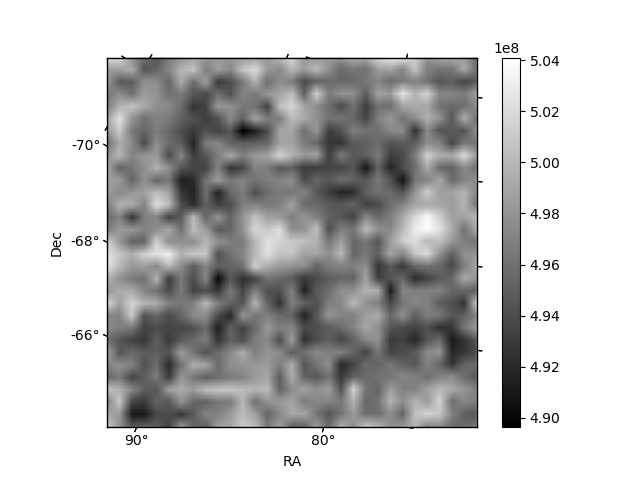
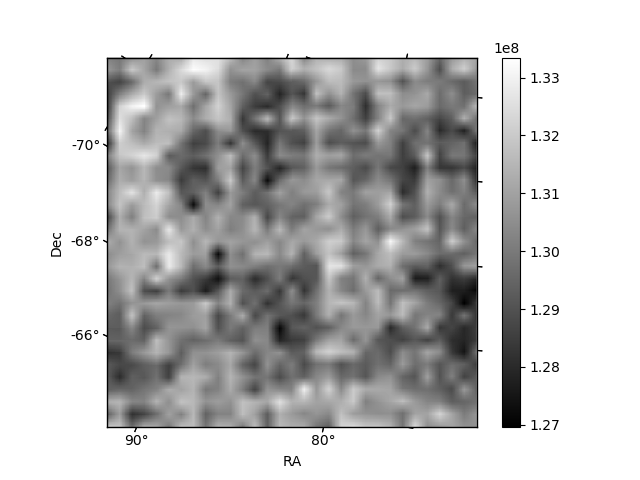
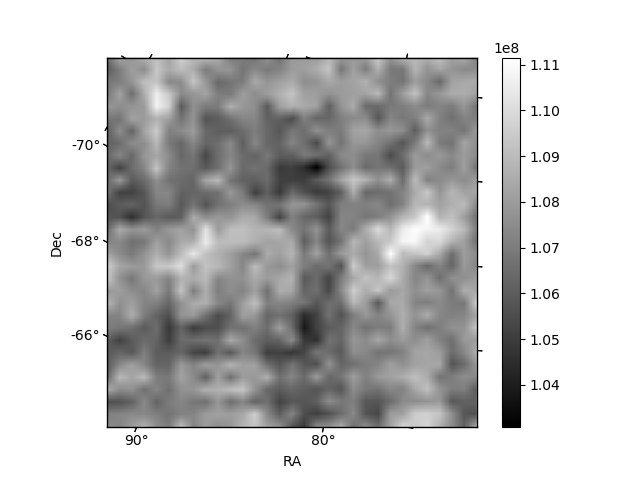
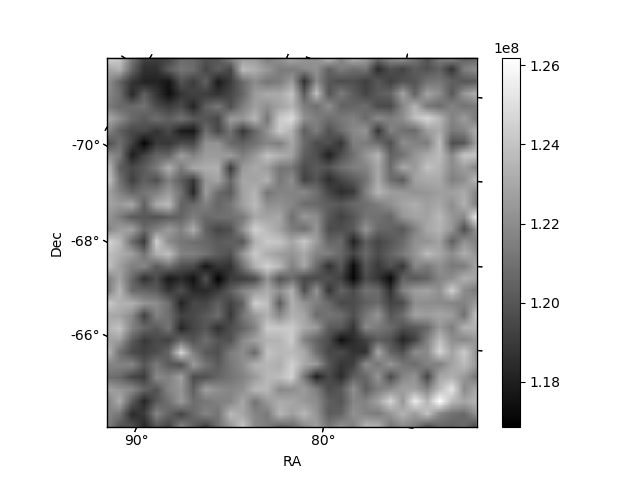
Histogram calculated using DETX and DETY for each event in the final _common_clean file
| Quadrant A |  |
 |
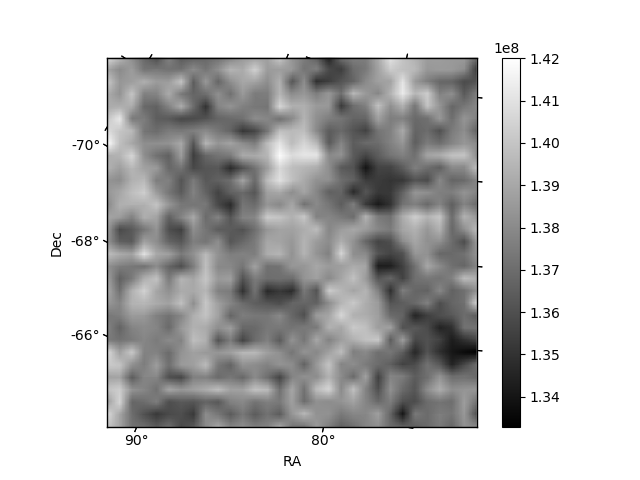
Quadrant B |
|---|---|---|---|
| Quadrant D |  |
 |
Quadrant C |
| Plot type | Count rate plots | Images |
|---|---|---|
| Comparison with Poisson distribution Blue bars denote a histogram of data divided into 1 sec bins. Red curve is a Poisson curve with rate = median count rate of data. |
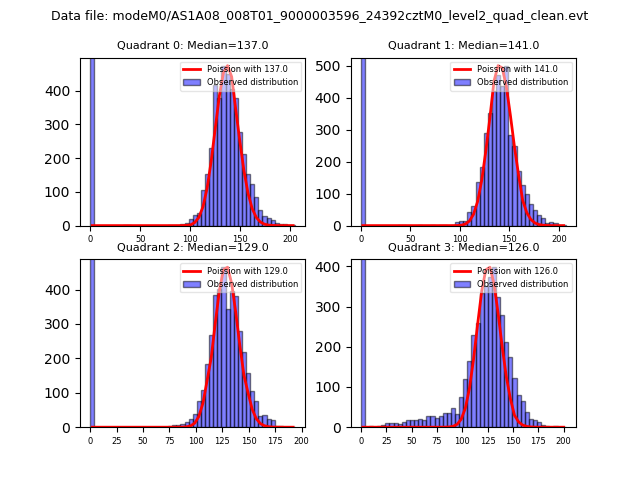 |
 |
| Quadrant-wise count rates Data is divided into 100 sec bins |
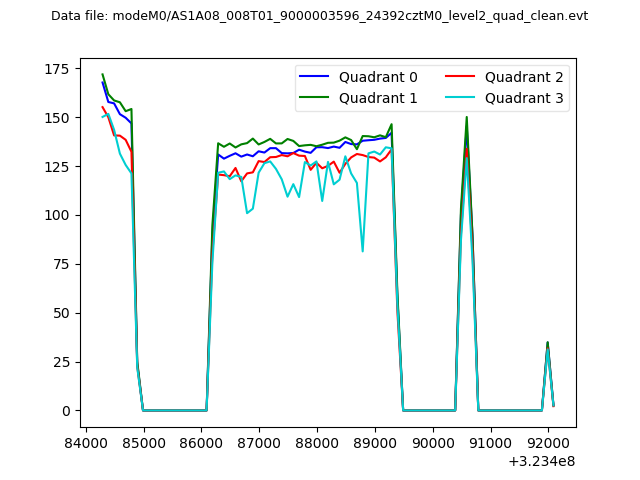 |
|
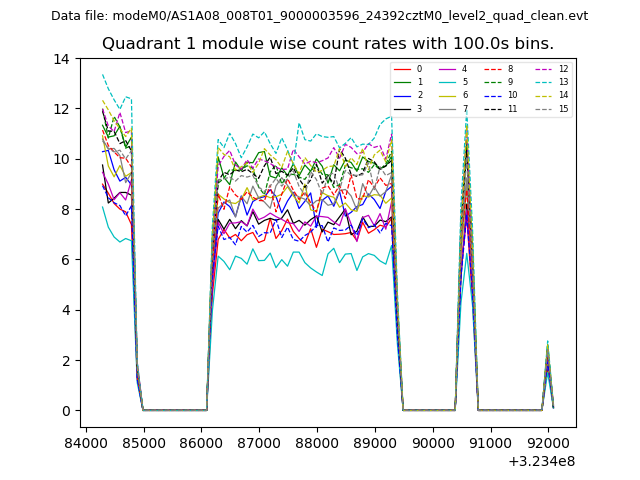
| Module-wise count rates for Quadrant A Data is divided into 100 sec bins |
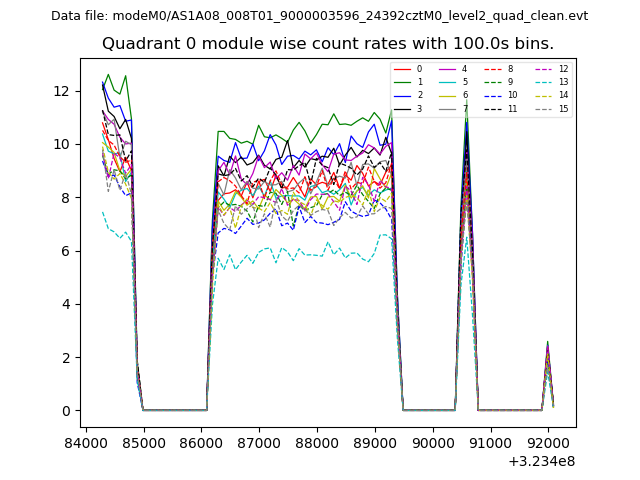 |
 |
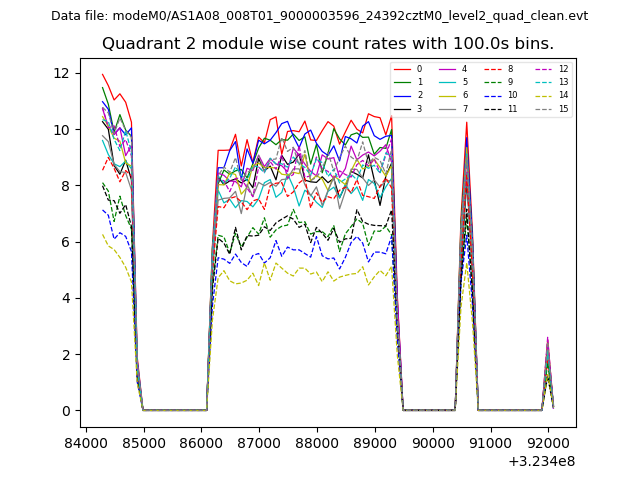
| Module-wise count rates for Quadrant B Data is divided into 100 sec bins |
 |
 |
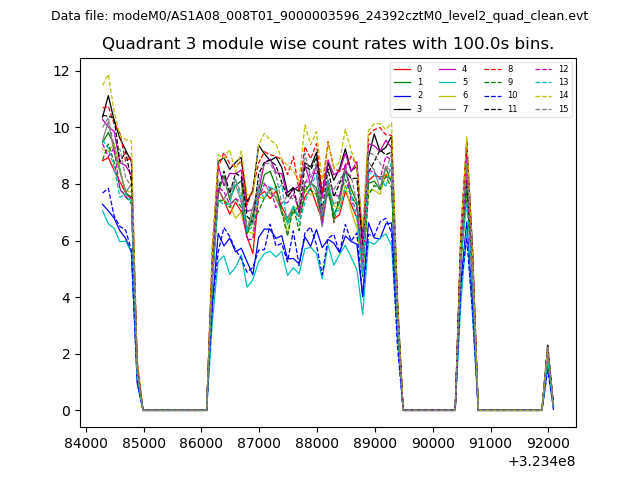
| Module-wise count rates for Quadrant C Data is divided into 100 sec bins |
 |
 |
| Module-wise count rates for Quadrant D Data is divided into 100 sec bins |
 |
 |
| Parameter | Plot |
|---|---|
| CZT HV Monitor | 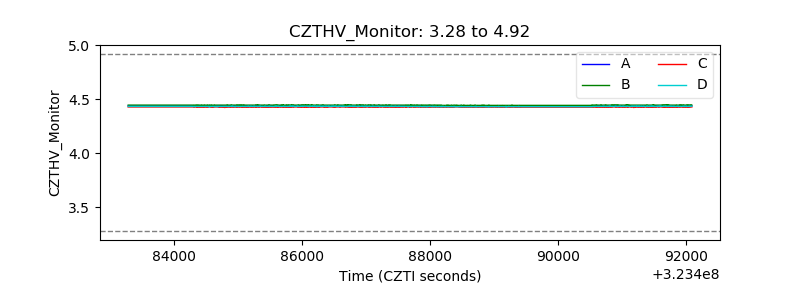 |
| D_VDD | 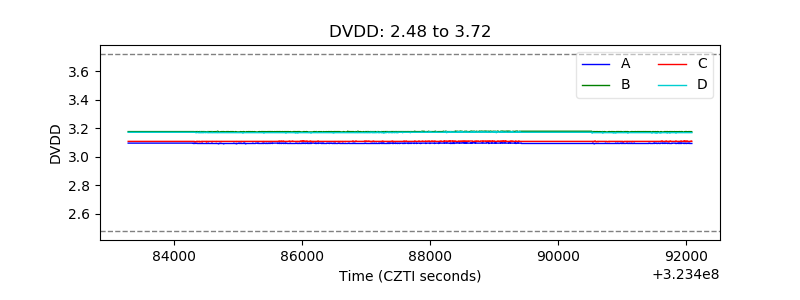 |
| Temperature 1 | 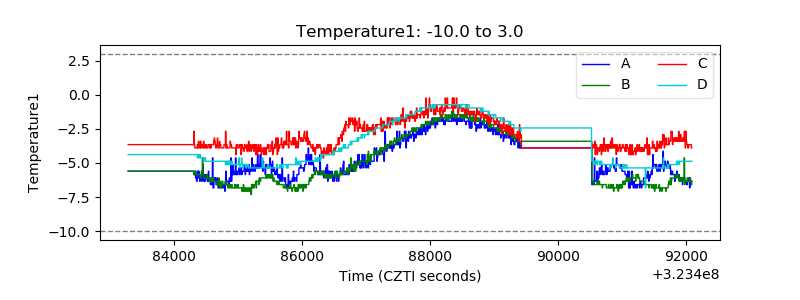 |
| Veto HV Monitor | 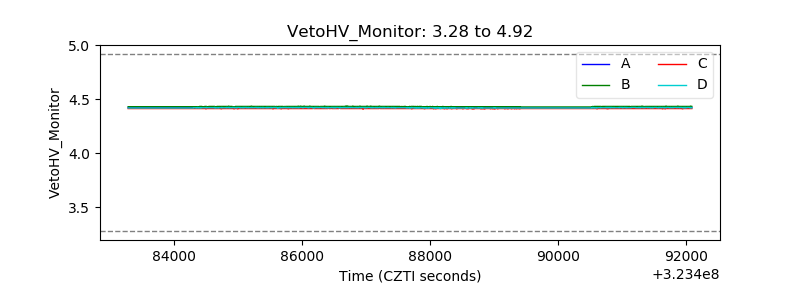 |
| Veto LLD | 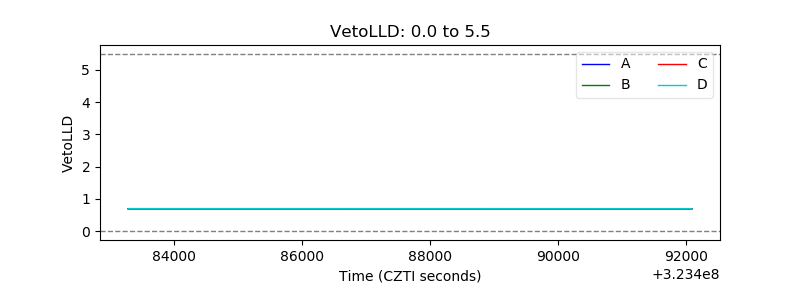 |
| Alpha Counter | 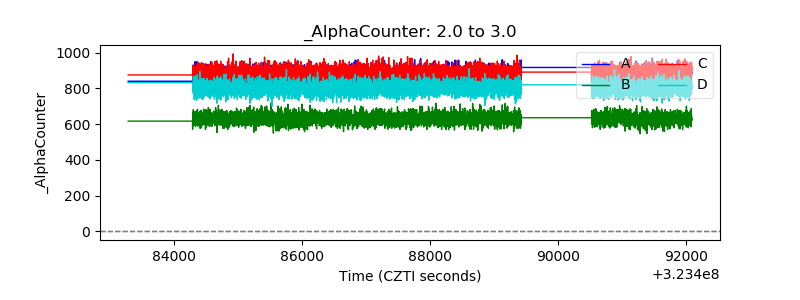 |
| _CPM_Rate | 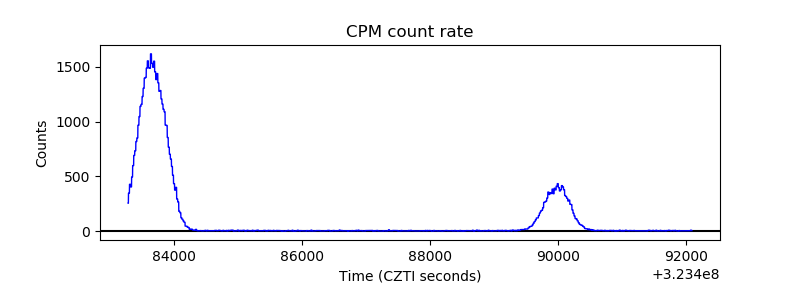 |
| CZT Counter | 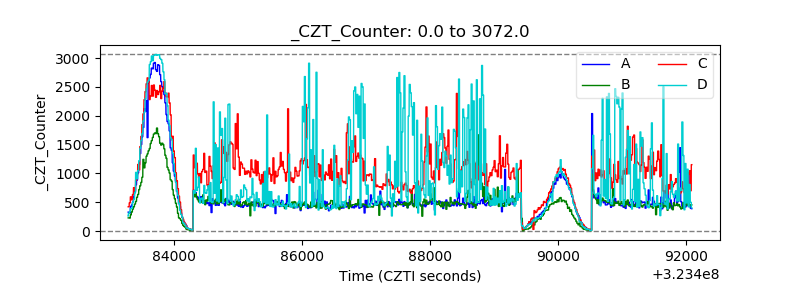 |
| +2.5 Volts monitor |  |
| +5 Volts monitor | 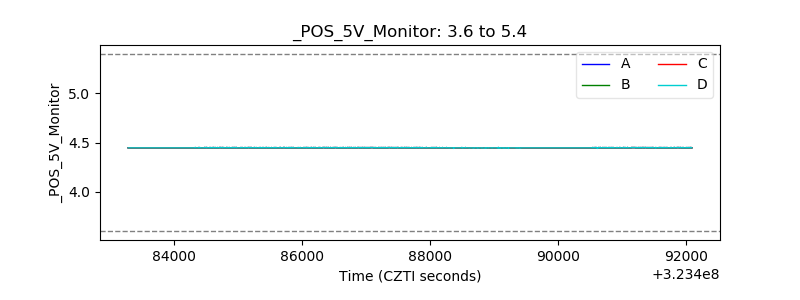 |
| _ROLL_ROT | 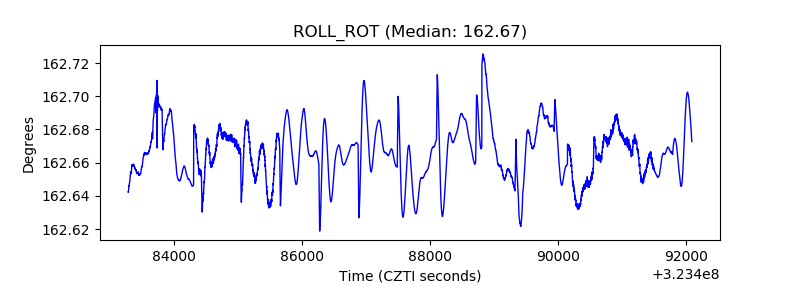 |
| _Roll_DEC | 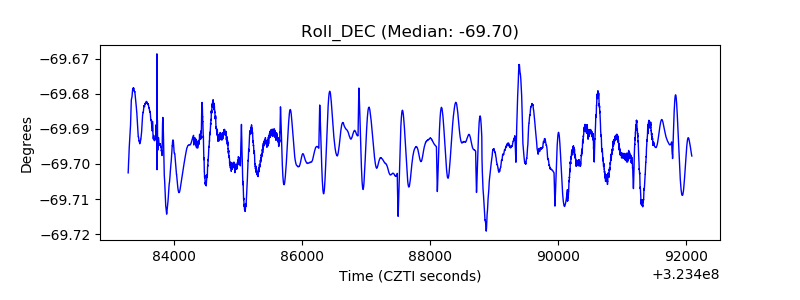 |
| _Roll_RA | 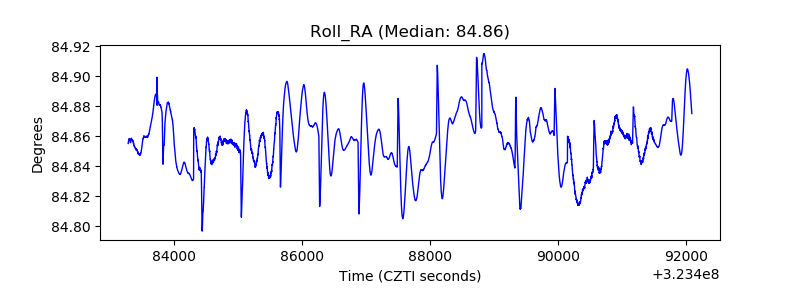 |
| Veto Counter | 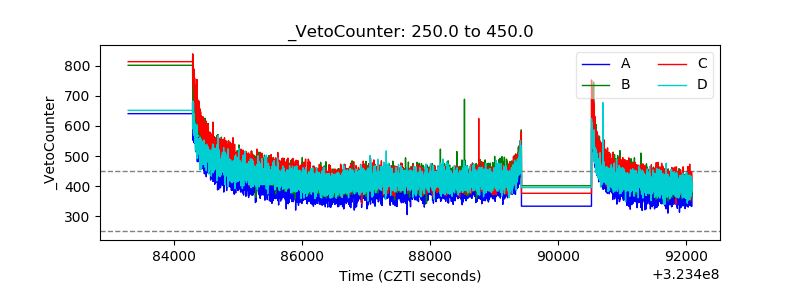 |