| Param | Original file | Final file |
|---|---|---|
| Filename | modeM0/AS1A08_008T01_9000003596_24393cztM0_level2.evt | modeM0/AS1A08_008T01_9000003596_24393cztM0_level2_quad_clean.evt |
| Size (bytes) | 598,999,680 | 95,613,120 |
| Size | 571.3 MB | 91.2 MB |
| Events in quadrant A | 4,194,561 | 605,972 |
| Events in quadrant B | 3,450,410 | 625,710 |
| Events in quadrant C | 4,503,507 | 593,549 |
| Events in quadrant D | 5,502,764 | 566,999 |
| Mode SS | |||
|---|---|---|---|
| Quadrant | BADHDUFLAG | Total packets | Discarded packets |
| A | 0 | 146 | 0 |
| B | 0 | 146 | 0 |
| C | 0 | 146 | 0 |
| D | 0 | 146 | 0 |
| Mode M0 | |||
|---|---|---|---|
| Quadrant | BADHDUFLAG | Total packets | Discarded packets |
| A | 0 | 17216 | 2 |
| B | 0 | 14856 | 2 |
| C | 0 | 17991 | 2 |
| D | 0 | 21235 | 2 |
| Mode M9 | |||
|---|---|---|---|
| Quadrant | BADHDUFLAG | Total packets | Discarded packets |
| A | 0 | 8 | 0 |
| B | 0 | 9 | 0 |
| C | 0 | 9 | 0 |
| D | 0 | 9 | 0 |
| Quadrant | Total seconds | Saturated seconds | Saturation percentage |
|---|---|---|---|
| A | 7226 | 270 | 3.736507% |
| B | 7225 | 131 | 1.813149% |
| C | 7225 | 249 | 3.446367% |
| D | 7225 | 533 | 7.377163% |
Noise dominated data is calculated using 1-second bins in cleaned event files. If a bin has >2000 counts, and if more than 50% of those come from <1% of pixels, then it is considered to be noise-dominated and hence unusable.
| Quadrant | # 1 sec bins | Bins with >0 counts | Bins with >2000 counts | High rate bins dominated by noise | Noise dominated (total time) | Noise dominated (detector-on time) | Marked lightcurve |
|---|---|---|---|---|---|---|---|
| A | 7831 | 7227 | 116 | 116 | 1.48% | 1.61% | 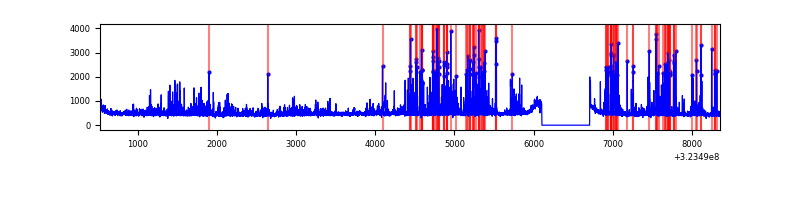 |
| B | 7830 | 7226 | 0 | 0 | 0.00% | 0.00% | 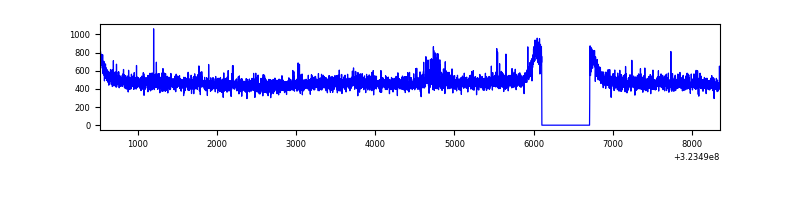 |
| C | 7830 | 7226 | 5 | 5 | 0.06% | 0.07% | 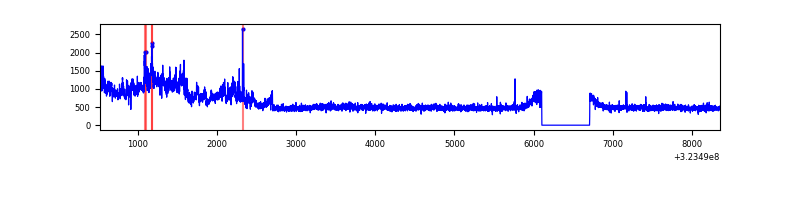 |
| D | 7830 | 7226 | 398 | 398 | 5.08% | 5.51% | 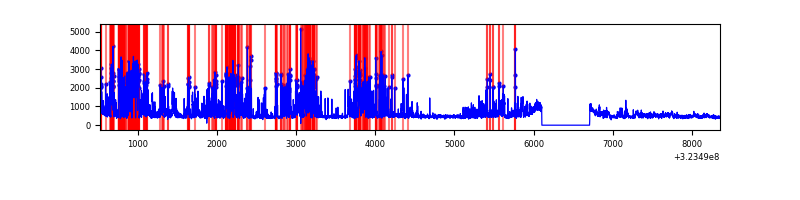 |
Top three noisy pixels from each quadrant. If the there are fewer than three noisy pixels in the level2.evt file, extra rows are filled as -1
| Pixel properties | Quadrant properties | ||||||
|---|---|---|---|---|---|---|---|
| Quadrant | DetID | PixID | Counts | Sigma | Mean | Median | Sigma |
| A | 6 | 10 | 845447 | 4838.74 | 868 | 850 | 174.5 |
| A | 13 | 254 | 11070 | 58.55 | 868 | 850 | 174.5 |
| A | 3 | 137 | 7626 | 38.82 | 868 | 850 | 174.5 |
| B | 12 | 111 | 20355 | 118.15 | 875 | 854 | 165.1 |
| B | 11 | 111 | 17719 | 102.18 | 875 | 854 | 165.1 |
| B | 15 | 33 | 17529 | 101.03 | 875 | 854 | 165.1 |
| C | 7 | 247 | 1079830 | 5609.84 | 839 | 844 | 192.3 |
| C | 14 | 238 | 133477 | 689.58 | 839 | 844 | 192.3 |
| C | 3 | 233 | 16749 | 82.69 | 839 | 844 | 192.3 |
| D | 1 | 52 | 2097011 | 10541.59 | 832 | 806 | 198.9 |
| D | 12 | 233 | 210446 | 1054.26 | 832 | 806 | 198.9 |
| D | 2 | 234 | 31609 | 154.9 | 832 | 806 | 198.9 |
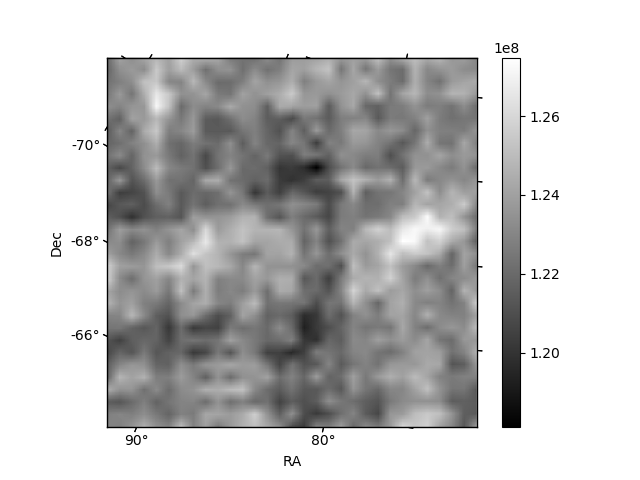
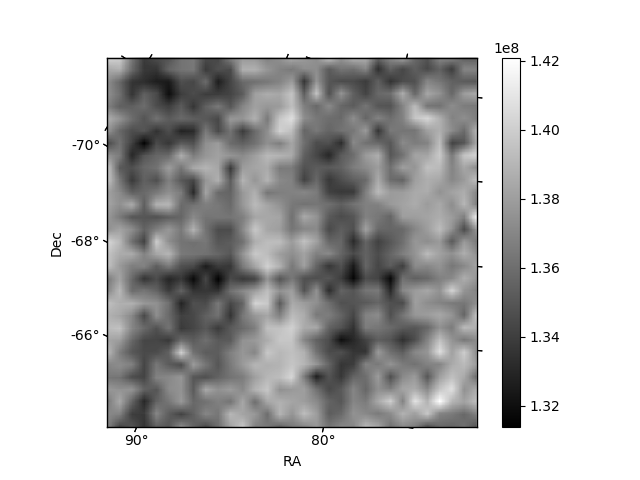
Histogram calculated using DETX and DETY for each event in the final _common_clean file
| Quadrant A | 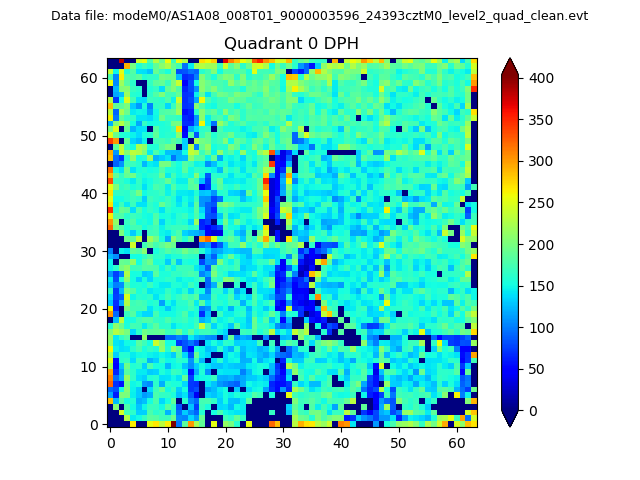 |
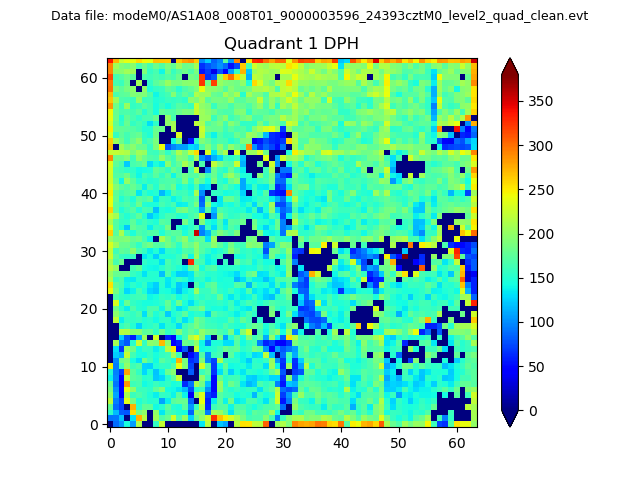 |
Quadrant B |
|---|---|---|---|
| Quadrant D | 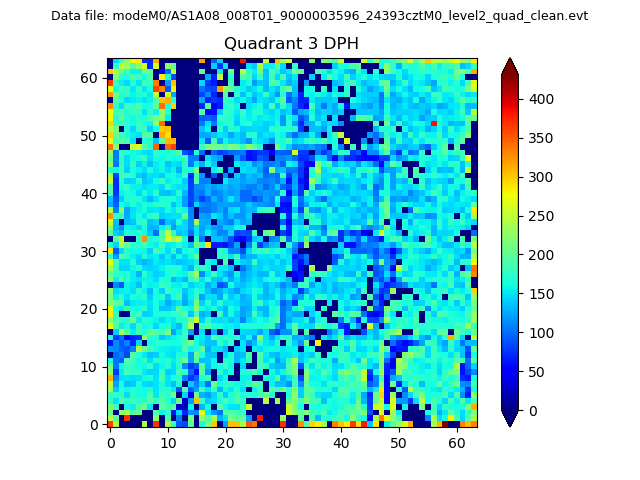 |
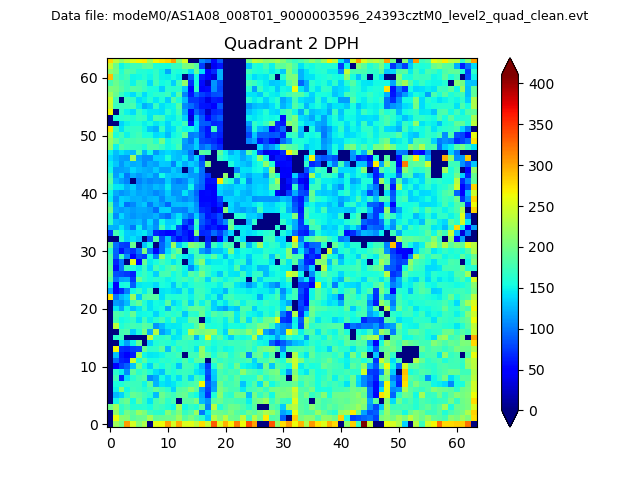 |
Quadrant C |
| Plot type | Count rate plots | Images |
|---|---|---|
| Comparison with Poisson distribution Blue bars denote a histogram of data divided into 1 sec bins. Red curve is a Poisson curve with rate = median count rate of data. |
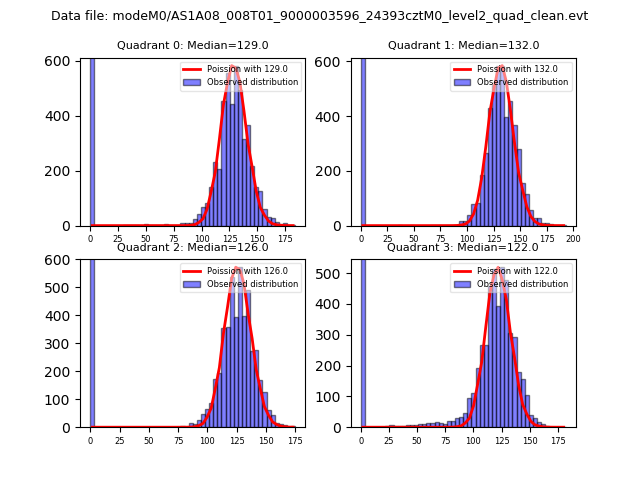 |
 |
| Quadrant-wise count rates Data is divided into 100 sec bins |
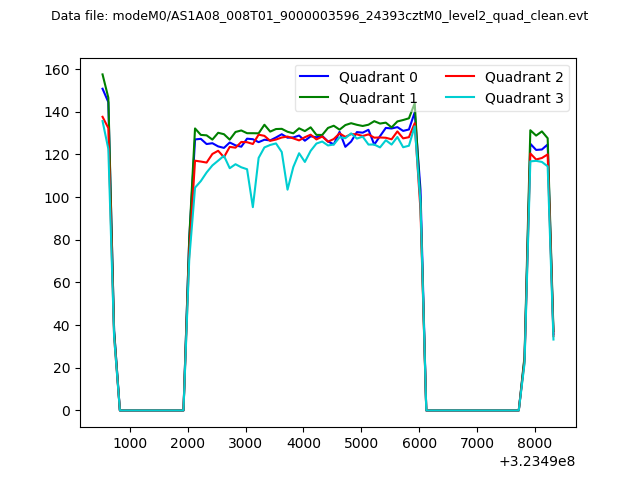 |
|
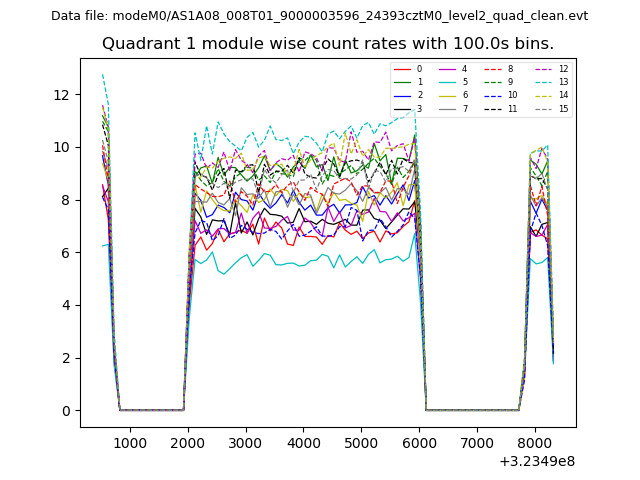
| Module-wise count rates for Quadrant A Data is divided into 100 sec bins |
 |
 |
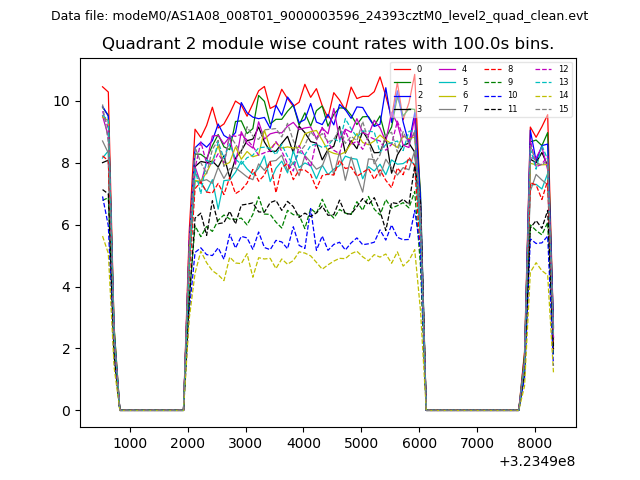
| Module-wise count rates for Quadrant B Data is divided into 100 sec bins |
 |
 |
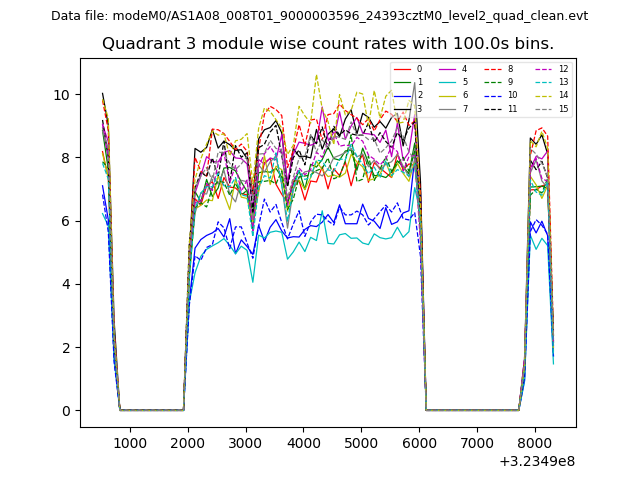
| Module-wise count rates for Quadrant C Data is divided into 100 sec bins |
 |
 |
| Module-wise count rates for Quadrant D Data is divided into 100 sec bins |
 |
 |
| Parameter | Plot |
|---|---|
| CZT HV Monitor | 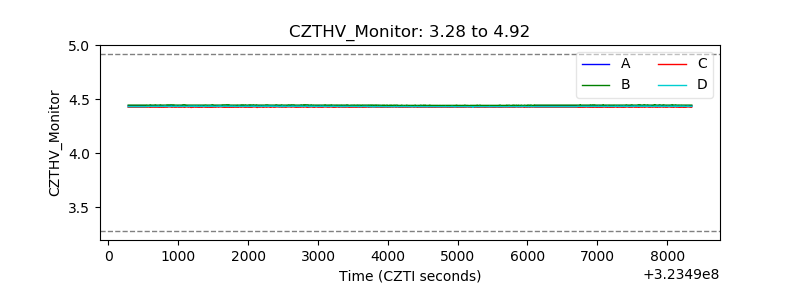 |
| D_VDD | 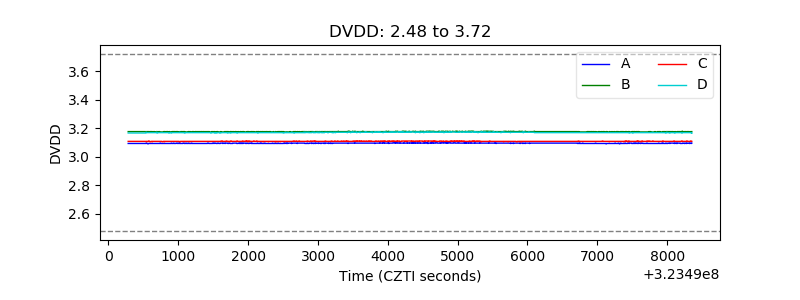 |
| Temperature 1 | 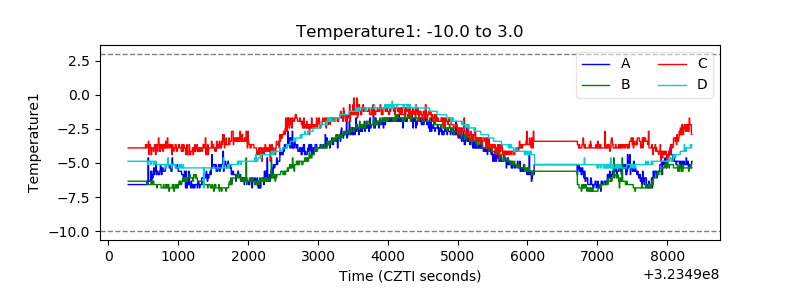 |
| Veto HV Monitor | 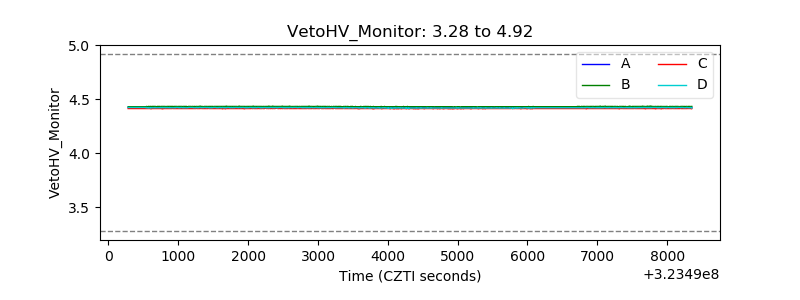 |
| Veto LLD | 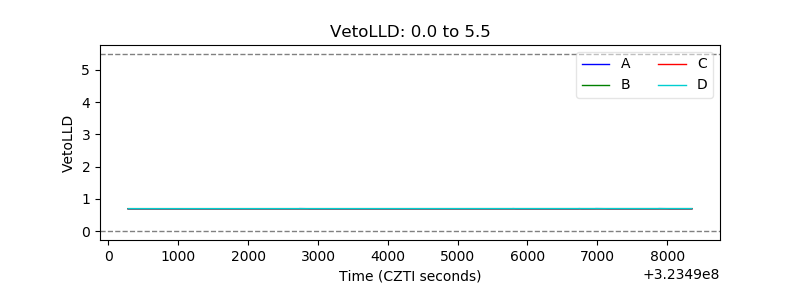 |
| Alpha Counter | 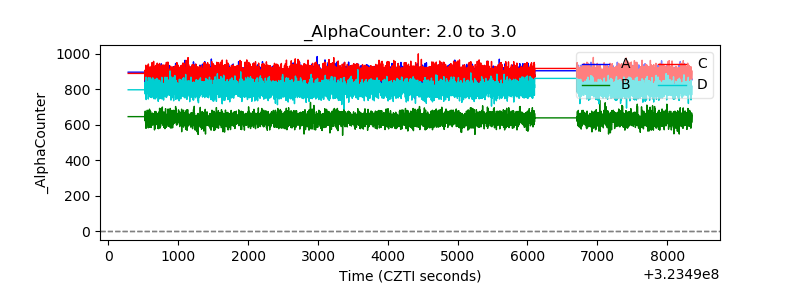 |
| _CPM_Rate | 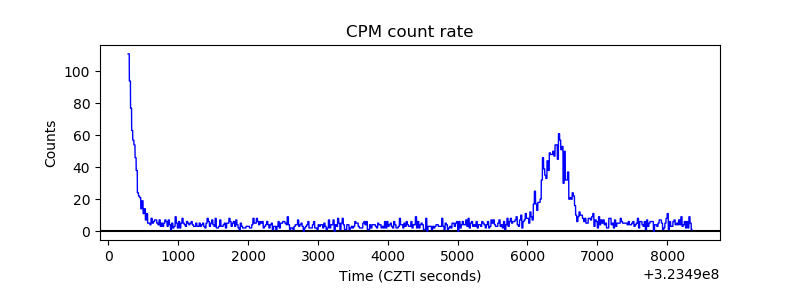 |
| CZT Counter | 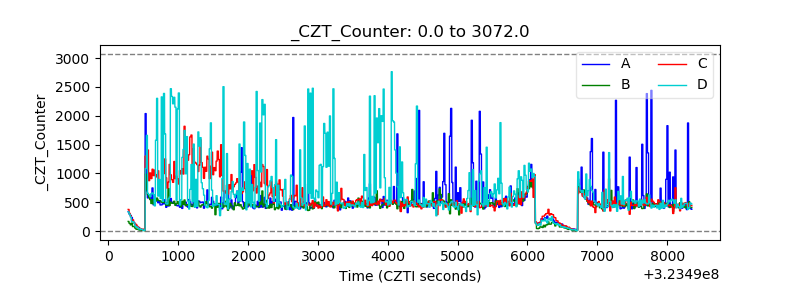 |
| +2.5 Volts monitor |  |
| +5 Volts monitor |  |
| _ROLL_ROT | 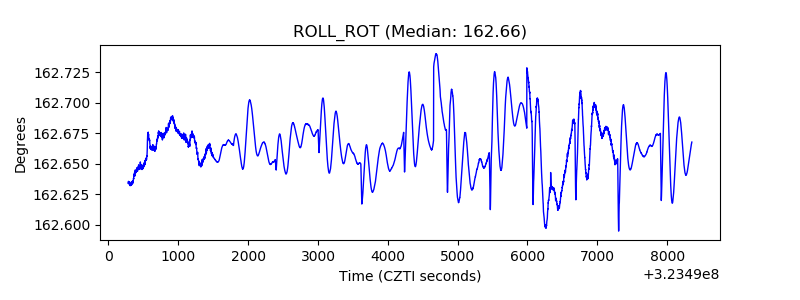 |
| _Roll_DEC |  |
| _Roll_RA | 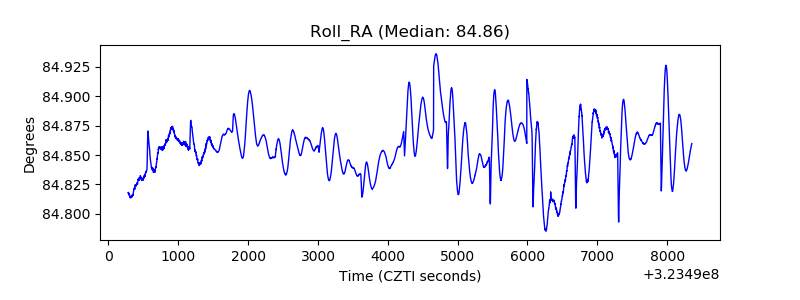 |
| Veto Counter | 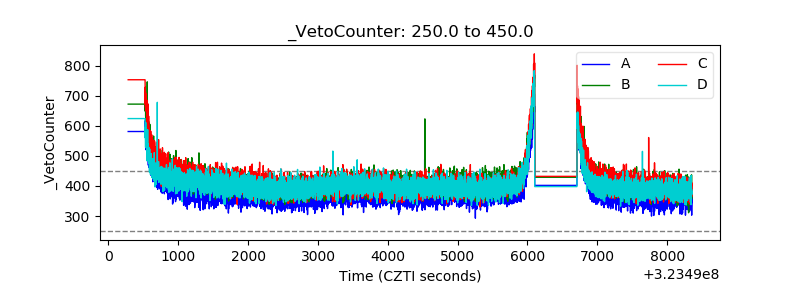 |