| Param | Original file | Final file |
|---|---|---|
| Filename | modeM0/AS1A08_008T01_9000003596_24394cztM0_level2.evt | modeM0/AS1A08_008T01_9000003596_24394cztM0_level2_quad_clean.evt |
| Size (bytes) | 490,020,480 | 102,741,120 |
| Size | 467.3 MB | 98.0 MB |
| Events in quadrant A | 3,655,475 | 662,807 |
| Events in quadrant B | 3,357,767 | 681,413 |
| Events in quadrant C | 3,410,328 | 649,449 |
| Events in quadrant D | 3,947,502 | 636,765 |
| Mode SS | |||
|---|---|---|---|
| Quadrant | BADHDUFLAG | Total packets | Discarded packets |
| A | 0 | 140 | 0 |
| B | 0 | 140 | 0 |
| C | 0 | 140 | 0 |
| D | 0 | 140 | 0 |
| Mode M0 | |||
|---|---|---|---|
| Quadrant | BADHDUFLAG | Total packets | Discarded packets |
| A | 0 | 15502 | 1 |
| B | 0 | 14476 | 1 |
| C | 0 | 14323 | 1 |
| D | 0 | 16382 | 1 |
| Mode M9 | |||
|---|---|---|---|
| Quadrant | BADHDUFLAG | Total packets | Discarded packets |
| A | 0 | 3 | 0 |
| B | 0 | 3 | 0 |
| C | 0 | 3 | 0 |
| D | 0 | 3 | 0 |
| Quadrant | Total seconds | Saturated seconds | Saturation percentage |
|---|---|---|---|
| A | 6906 | 244 | 3.533160% |
| B | 6907 | 180 | 2.606052% |
| C | 6907 | 199 | 2.881135% |
| D | 6907 | 153 | 2.215144% |
Noise dominated data is calculated using 1-second bins in cleaned event files. If a bin has >2000 counts, and if more than 50% of those come from <1% of pixels, then it is considered to be noise-dominated and hence unusable.
| Quadrant | # 1 sec bins | Bins with >0 counts | Bins with >2000 counts | High rate bins dominated by noise | Noise dominated (total time) | Noise dominated (detector-on time) | Marked lightcurve |
|---|---|---|---|---|---|---|---|
| A | 7161 | 6907 | 74 | 74 | 1.03% | 1.07% | 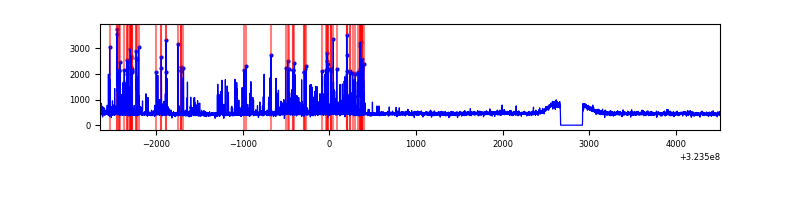 |
| B | 7162 | 6908 | 5 | 5 | 0.07% | 0.07% | 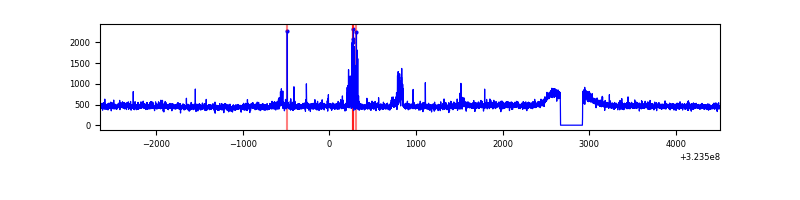 |
| C | 7162 | 6908 | 0 | 0 | 0.00% | 0.00% | 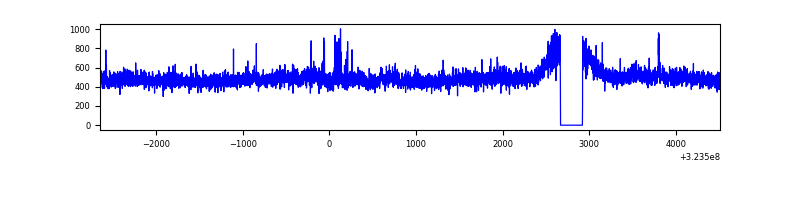 |
| D | 7162 | 6908 | 13 | 13 | 0.18% | 0.19% | 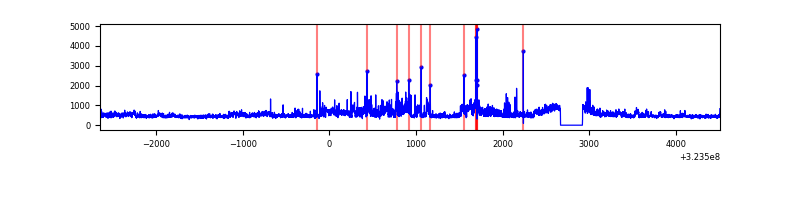 |
Top three noisy pixels from each quadrant. If the there are fewer than three noisy pixels in the level2.evt file, extra rows are filled as -1
| Pixel properties | Quadrant properties | ||||||
|---|---|---|---|---|---|---|---|
| Quadrant | DetID | PixID | Counts | Sigma | Mean | Median | Sigma |
| A | 6 | 10 | 478843 | 2865.79 | 824 | 803 | 166.8 |
| A | 13 | 254 | 10770 | 59.75 | 824 | 803 | 166.8 |
| A | 3 | 137 | 7547 | 40.43 | 824 | 803 | 166.8 |
| B | 15 | 33 | 90488 | 573.02 | 825 | 802 | 156.5 |
| B | 12 | 111 | 19397 | 118.81 | 825 | 802 | 156.5 |
| B | 11 | 111 | 17162 | 104.53 | 825 | 802 | 156.5 |
| C | 7 | 247 | 149114 | 806.31 | 794 | 796 | 183.9 |
| C | 14 | 238 | 125580 | 678.37 | 794 | 796 | 183.9 |
| C | 2 | 16 | 25900 | 136.47 | 794 | 796 | 183.9 |
| D | 1 | 52 | 791009 | 4035.31 | 807 | 782 | 195.8 |
| D | 8 | 195 | 77601 | 392.28 | 807 | 782 | 195.8 |
| D | 2 | 234 | 30753 | 153.05 | 807 | 782 | 195.8 |
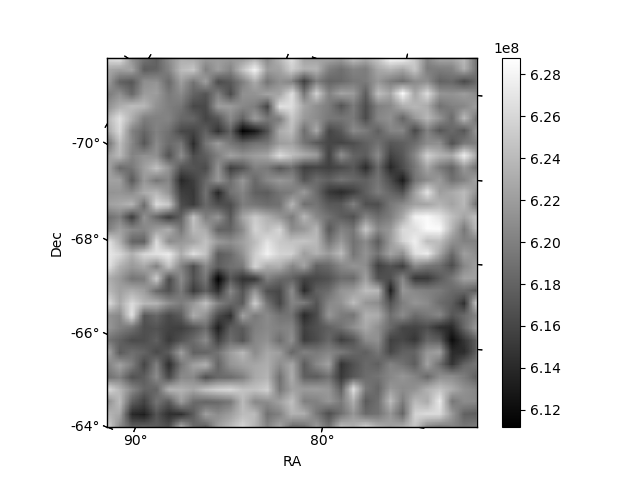
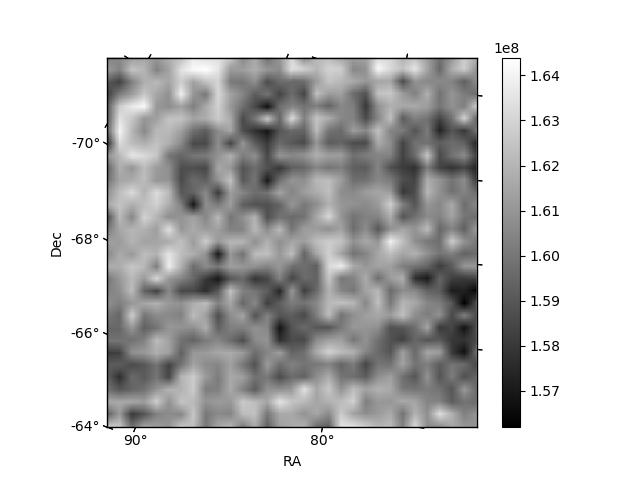
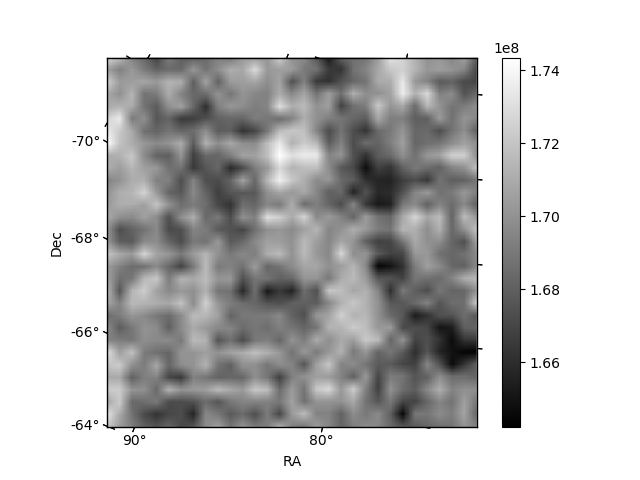
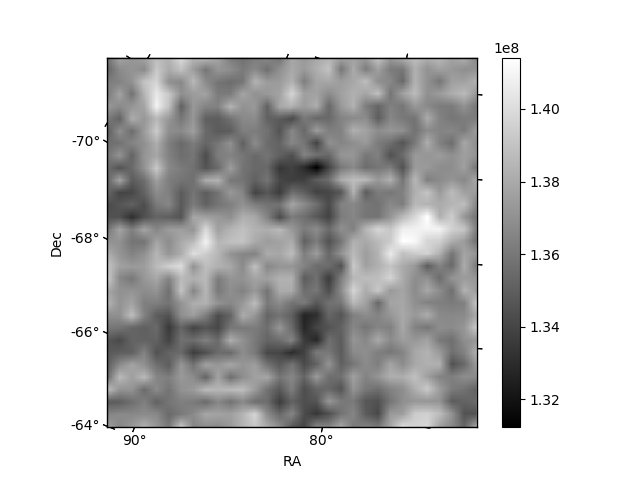
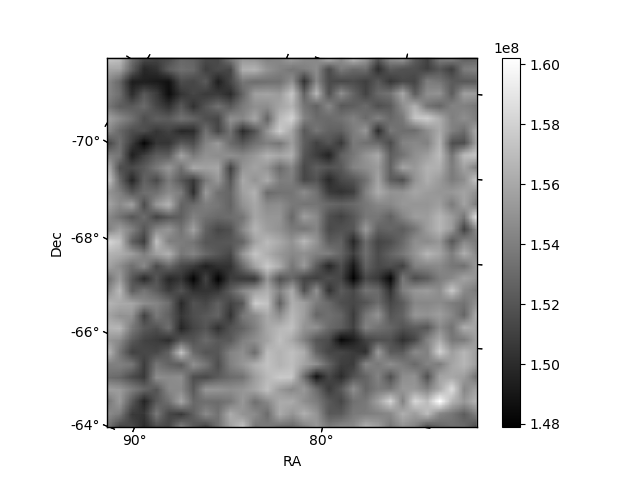
Histogram calculated using DETX and DETY for each event in the final _common_clean file
| Quadrant A | 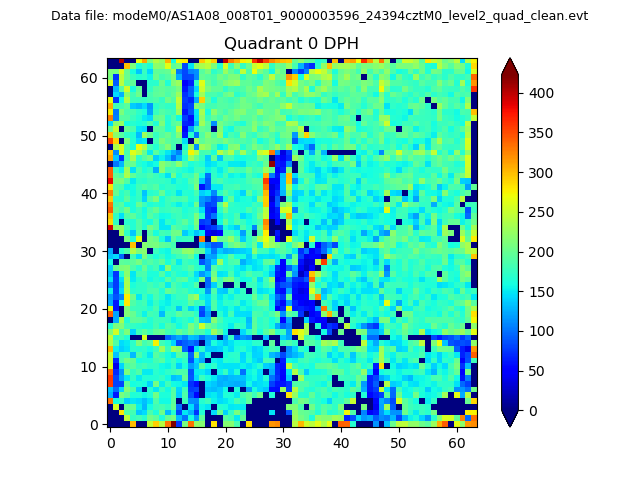 |
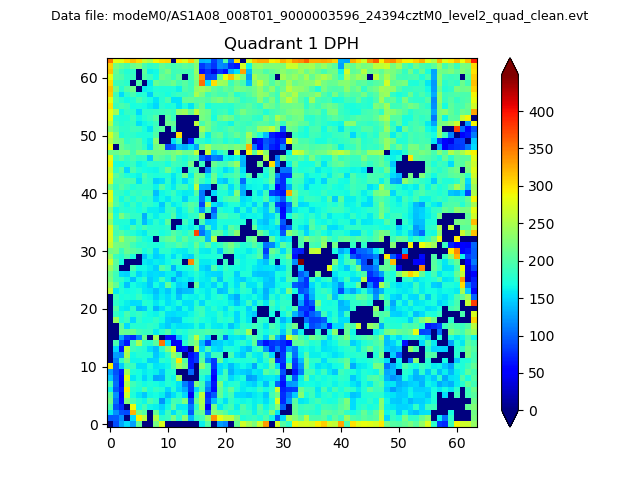 |
Quadrant B |
|---|---|---|---|
| Quadrant D | 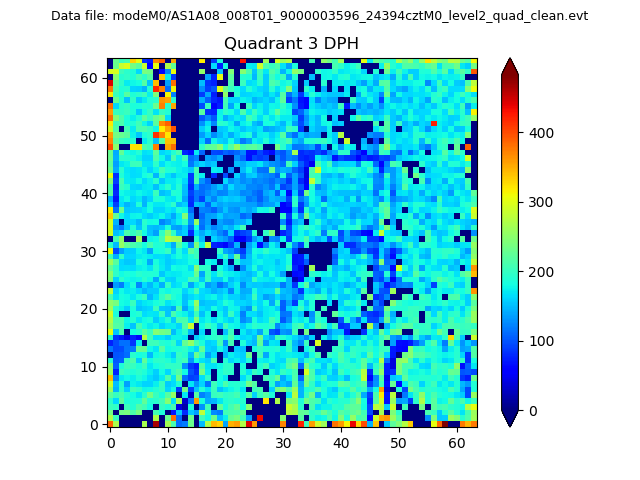 |
 |
Quadrant C |
| Plot type | Count rate plots | Images |
|---|---|---|
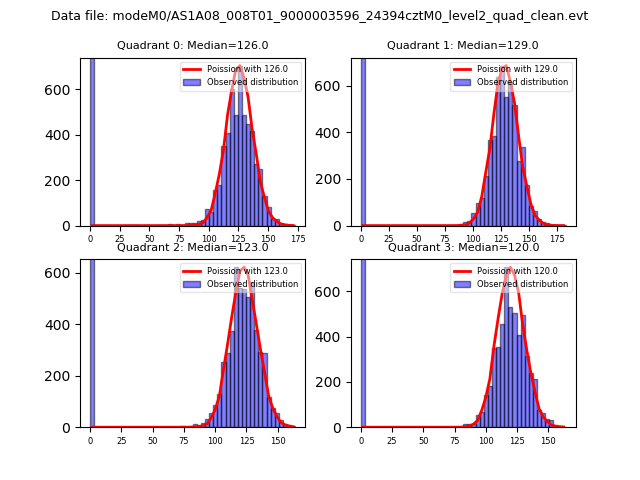
| Comparison with Poisson distribution Blue bars denote a histogram of data divided into 1 sec bins. Red curve is a Poisson curve with rate = median count rate of data. |
 |
 |
| Quadrant-wise count rates Data is divided into 100 sec bins |
 |
|
| Module-wise count rates for Quadrant A Data is divided into 100 sec bins |
 |
 |
| Module-wise count rates for Quadrant B Data is divided into 100 sec bins |
 |
 |
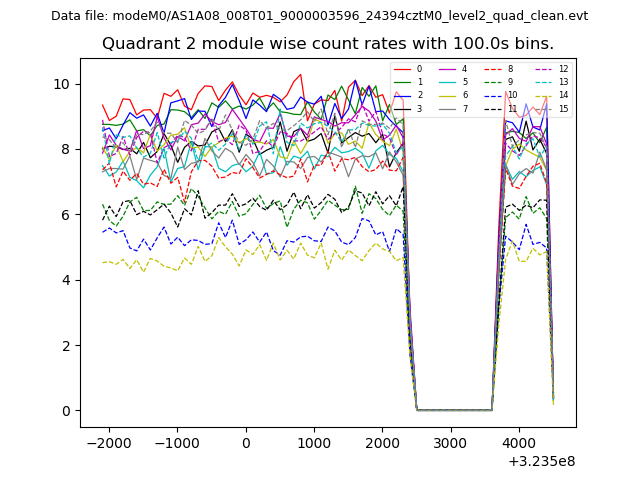
| Module-wise count rates for Quadrant C Data is divided into 100 sec bins |
 |
 |
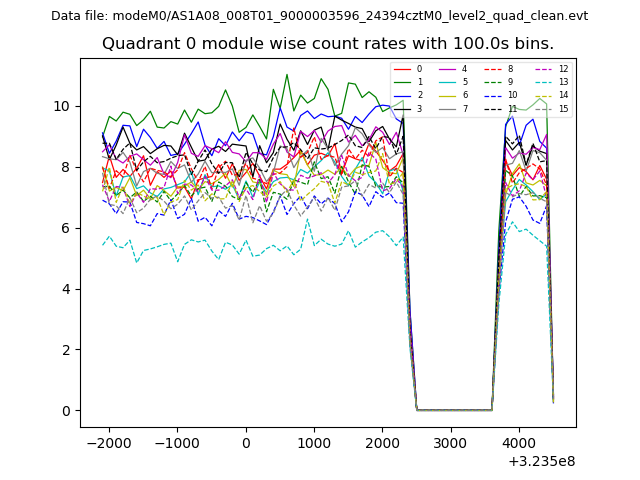
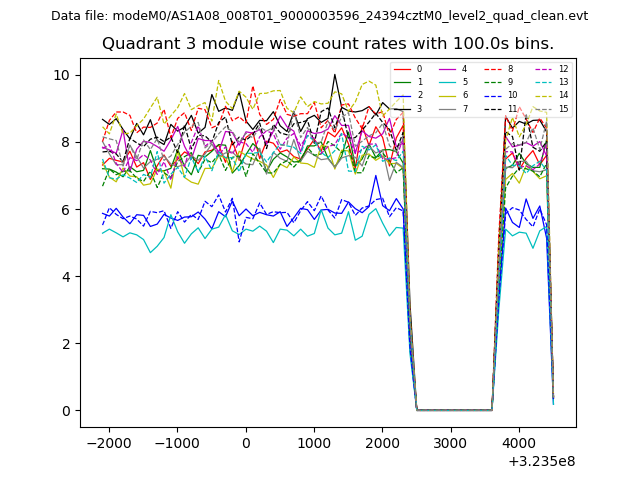
| Module-wise count rates for Quadrant D Data is divided into 100 sec bins |
 |
 |
| Parameter | Plot |
|---|---|
| CZT HV Monitor | 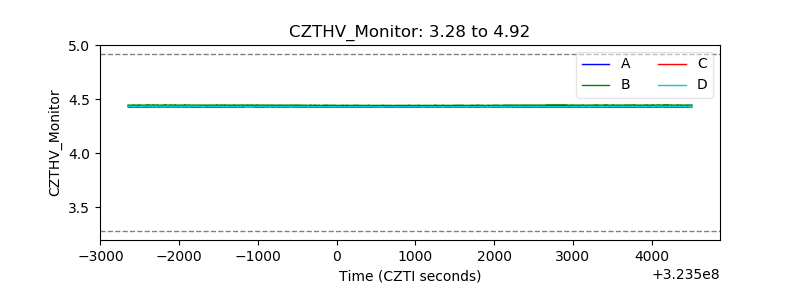 |
| D_VDD | 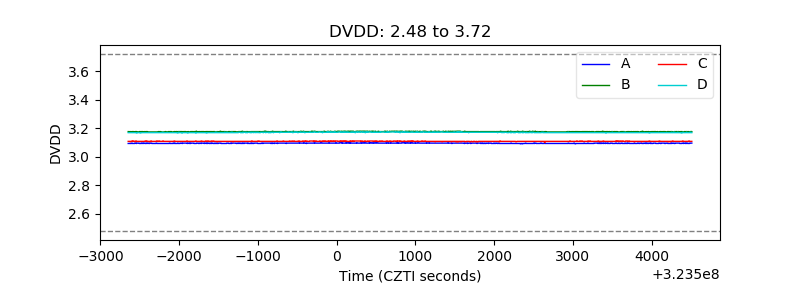 |
| Temperature 1 | 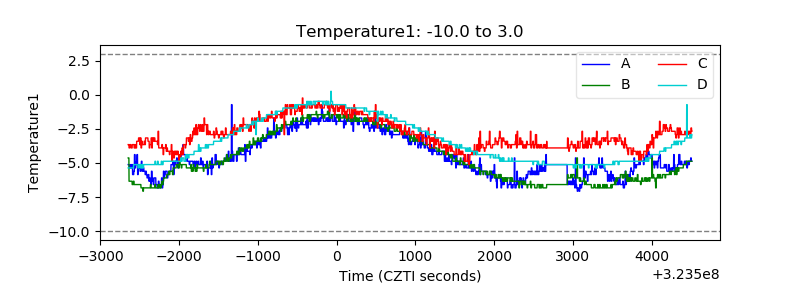 |
| Veto HV Monitor | 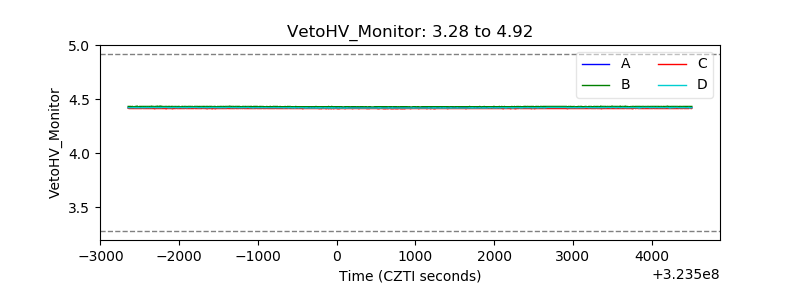 |
| Veto LLD | 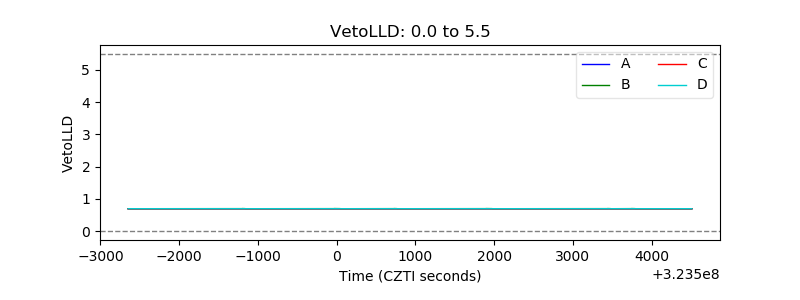 |
| Alpha Counter | 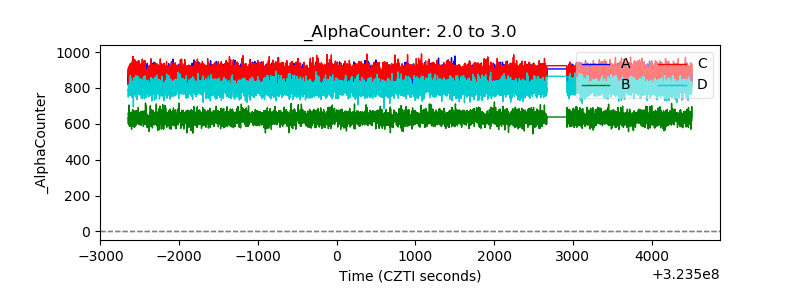 |
| _CPM_Rate | 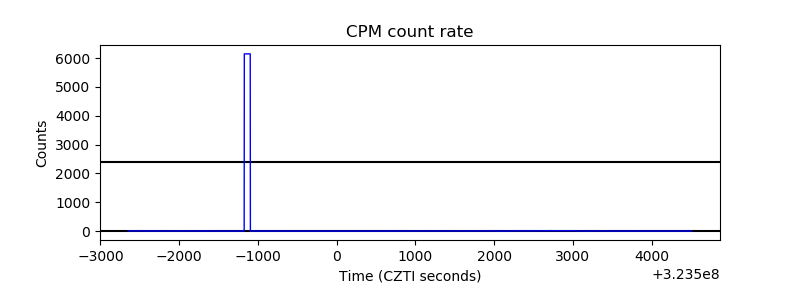 |
| CZT Counter | 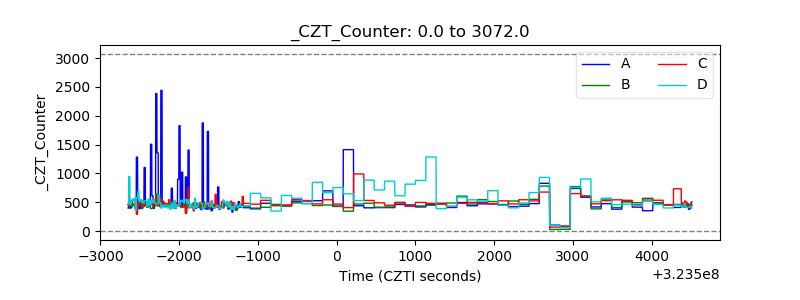 |
| +2.5 Volts monitor |  |
| +5 Volts monitor |  |
| _ROLL_ROT | 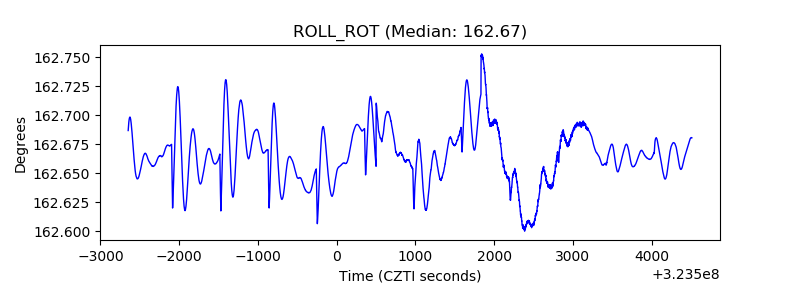 |
| _Roll_DEC | 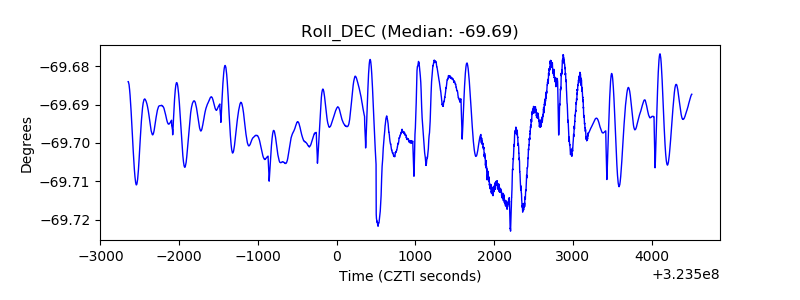 |
| _Roll_RA | 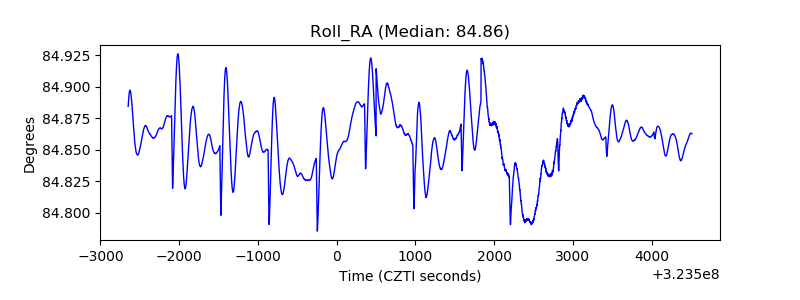 |
| Veto Counter | 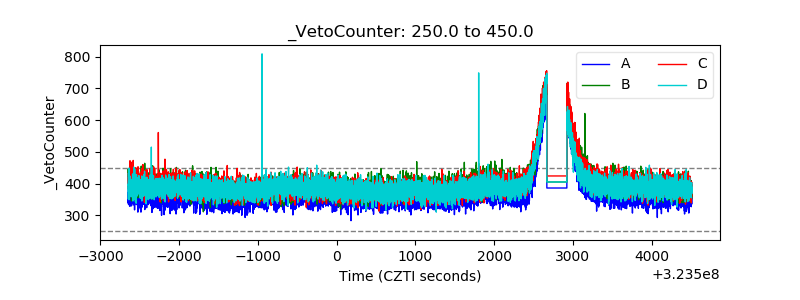 |