| Param | Original file | Final file |
|---|---|---|
| Filename | modeM0/AS1A08_008T01_9000003596_24398cztM0_level2.evt | modeM0/AS1A08_008T01_9000003596_24398cztM0_level2_quad_clean.evt |
| Size (bytes) | 1,206,789,120 | 275,198,400 |
| Size | 1.1 GB | 262.4 MB |
| Events in quadrant A | 8,283,659 | 1,798,523 |
| Events in quadrant B | 8,451,947 | 1,821,965 |
| Events in quadrant C | 9,114,389 | 1,750,230 |
| Events in quadrant D | 9,475,071 | 1,719,420 |
| Mode SS | |||
|---|---|---|---|
| Quadrant | BADHDUFLAG | Total packets | Discarded packets |
| A | 0 | 366 | 0 |
| B | 0 | 366 | 0 |
| C | 0 | 366 | 0 |
| D | 0 | 366 | 0 |
| Mode M0 | |||
|---|---|---|---|
| Quadrant | BADHDUFLAG | Total packets | Discarded packets |
| A | 0 | 36667 | 3 |
| B | 0 | 36887 | 3 |
| C | 0 | 38853 | 3 |
| D | 0 | 40248 | 3 |
| Mode M9 | |||
|---|---|---|---|
| Quadrant | BADHDUFLAG | Total packets | Discarded packets |
| A | 0 | 19 | 0 |
| B | 0 | 19 | 0 |
| C | 0 | 19 | 0 |
| D | 0 | 19 | 0 |
| Quadrant | Total seconds | Saturated seconds | Saturation percentage |
|---|---|---|---|
| A | 18078 | 170 | 0.940370% |
| B | 18079 | 187 | 1.034349% |
| C | 18079 | 273 | 1.510039% |
| D | 18079 | 226 | 1.250069% |
Noise dominated data is calculated using 1-second bins in cleaned event files. If a bin has >2000 counts, and if more than 50% of those come from <1% of pixels, then it is considered to be noise-dominated and hence unusable.
| Quadrant | # 1 sec bins | Bins with >0 counts | Bins with >2000 counts | High rate bins dominated by noise | Noise dominated (total time) | Noise dominated (detector-on time) | Marked lightcurve |
|---|---|---|---|---|---|---|---|
| A | 19883 | 18081 | 0 | 0 | 0.00% | 0.00% | 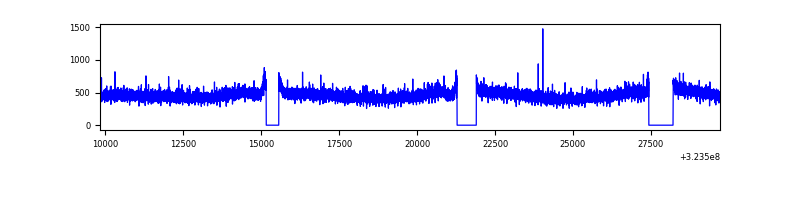 |
| B | 19884 | 18082 | 5 | 5 | 0.03% | 0.03% | 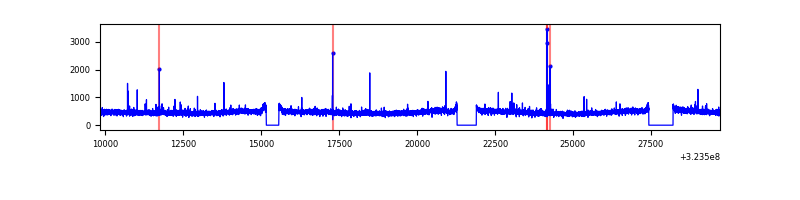 |
| C | 19884 | 18082 | 3 | 3 | 0.02% | 0.02% | 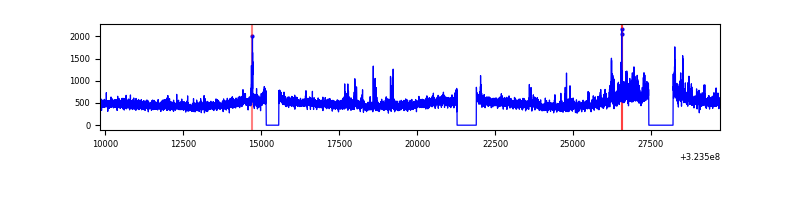 |
| D | 19884 | 18082 | 57 | 57 | 0.29% | 0.32% | 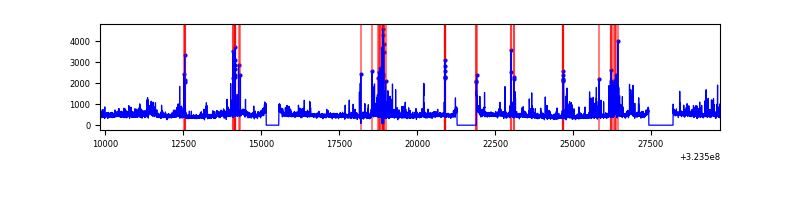 |
Top three noisy pixels from each quadrant. If the there are fewer than three noisy pixels in the level2.evt file, extra rows are filled as -1
| Pixel properties | Quadrant properties | ||||||
|---|---|---|---|---|---|---|---|
| Quadrant | DetID | PixID | Counts | Sigma | Mean | Median | Sigma |
| A | 13 | 254 | 30252 | 65.37 | 2148 | 2101 | 430.6 |
| A | 3 | 137 | 19638 | 40.72 | 2148 | 2101 | 430.6 |
| A | 0 | 226 | 18215 | 37.42 | 2148 | 2101 | 430.6 |
| B | 12 | 111 | 50179 | 118.7 | 2131 | 2074 | 405.3 |
| B | 11 | 111 | 45097 | 106.16 | 2131 | 2074 | 405.3 |
| B | 4 | 52 | 42794 | 100.47 | 2131 | 2074 | 405.3 |
| C | 7 | 247 | 675683 | 1421.19 | 2048 | 2055 | 474.0 |
| C | 14 | 238 | 327898 | 687.45 | 2048 | 2055 | 474.0 |
| C | 2 | 16 | 95840 | 197.86 | 2048 | 2055 | 474.0 |
| D | 1 | 52 | 1384294 | 2751.87 | 2078 | 2014 | 502.3 |
| D | 8 | 195 | 109485 | 213.95 | 2078 | 2014 | 502.3 |
| D | 2 | 234 | 91387 | 177.92 | 2078 | 2014 | 502.3 |
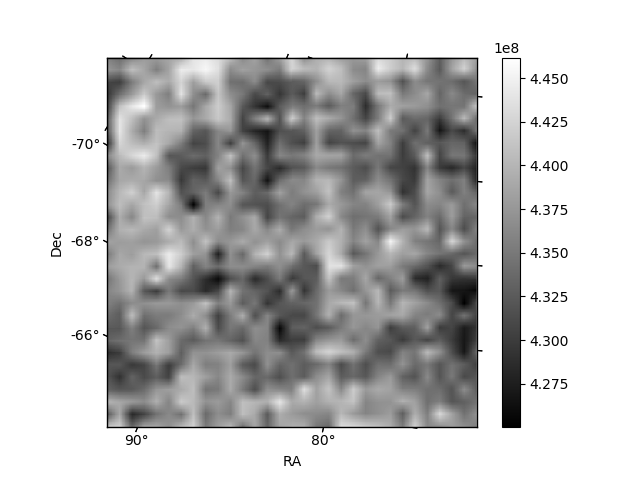
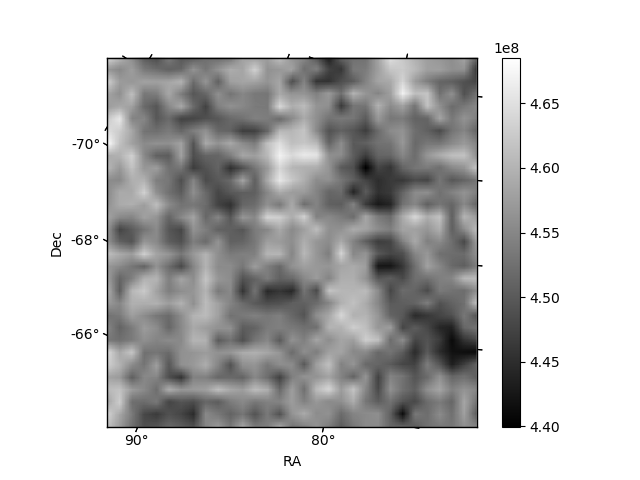
Histogram calculated using DETX and DETY for each event in the final _common_clean file
| Quadrant A |  |
 |
Quadrant B |
|---|---|---|---|
| Quadrant D |  |
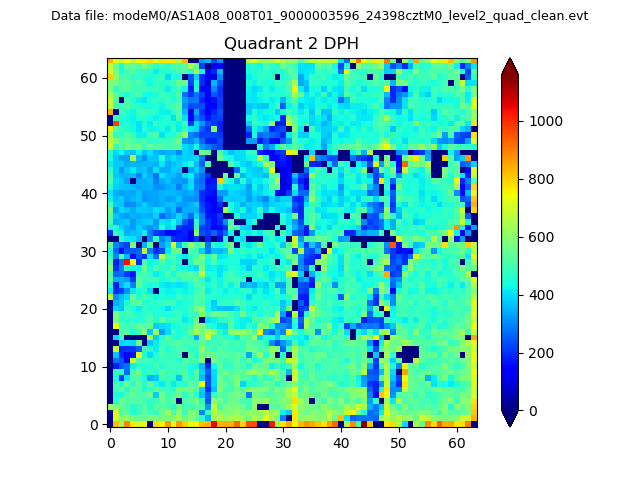 |
Quadrant C |
| Plot type | Count rate plots | Images |
|---|---|---|
| Comparison with Poisson distribution Blue bars denote a histogram of data divided into 1 sec bins. Red curve is a Poisson curve with rate = median count rate of data. |
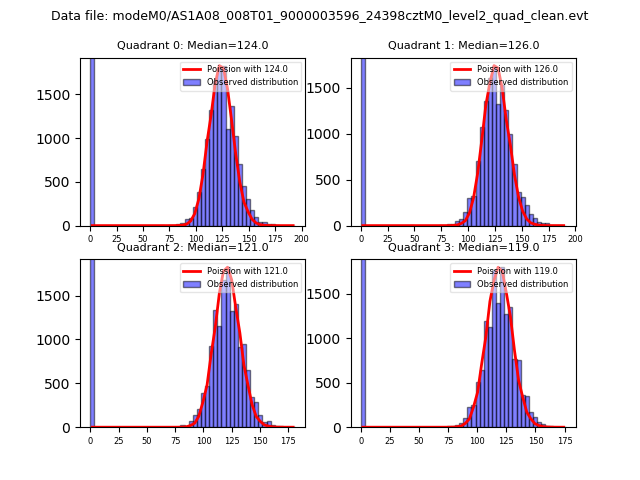 |
 |
| Quadrant-wise count rates Data is divided into 100 sec bins |
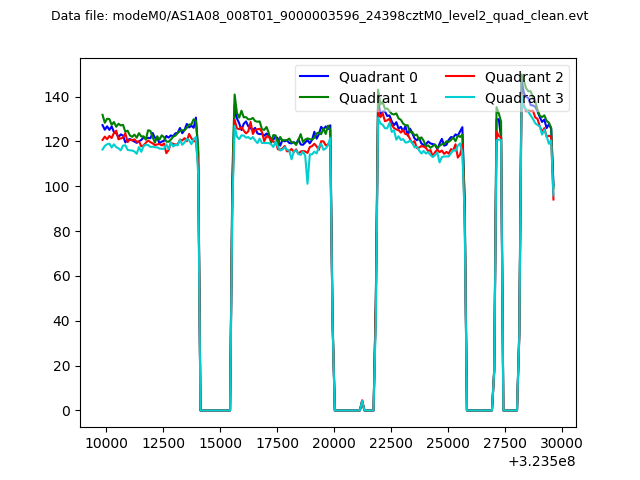 |
|
| Module-wise count rates for Quadrant A Data is divided into 100 sec bins |
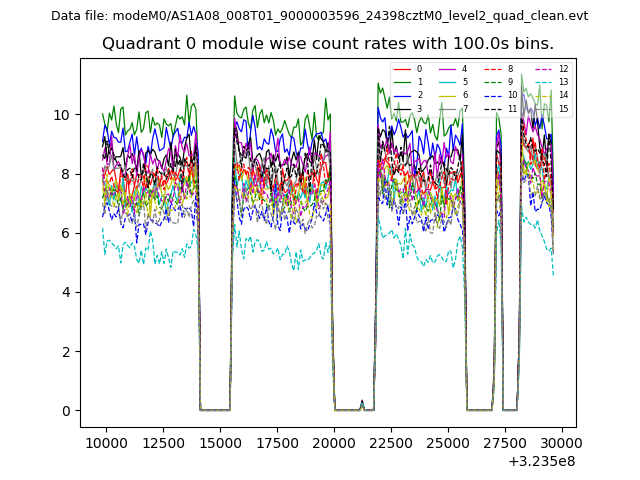 |
 |
| Module-wise count rates for Quadrant B Data is divided into 100 sec bins |
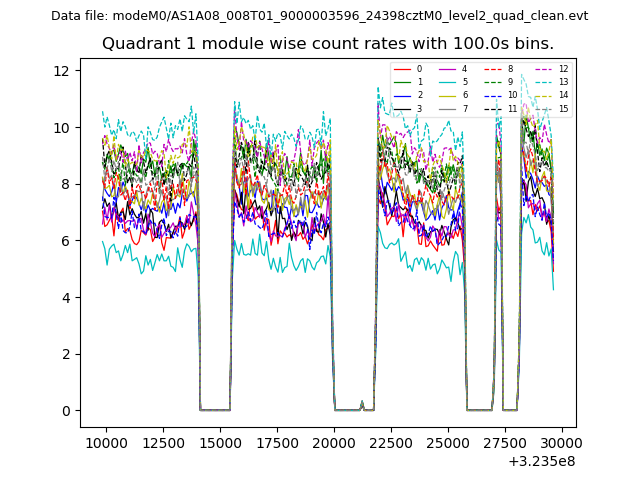 |
 |
| Module-wise count rates for Quadrant C Data is divided into 100 sec bins |
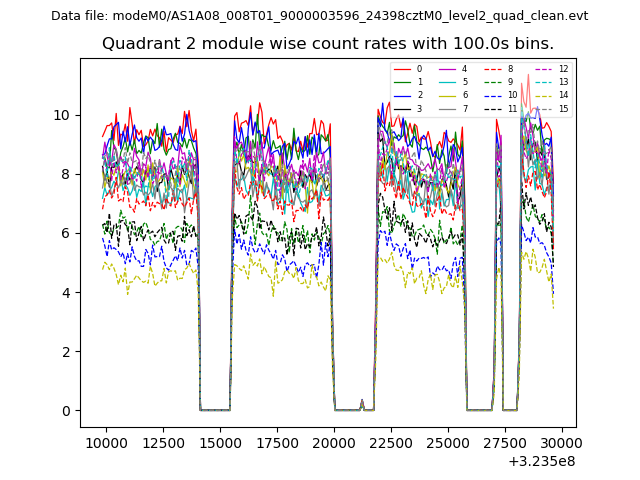 |
 |
| Module-wise count rates for Quadrant D Data is divided into 100 sec bins |
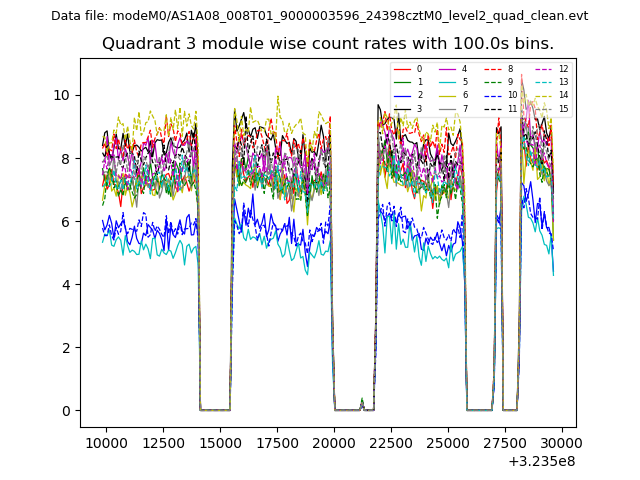 |
 |
| Parameter | Plot |
|---|---|
| CZT HV Monitor | 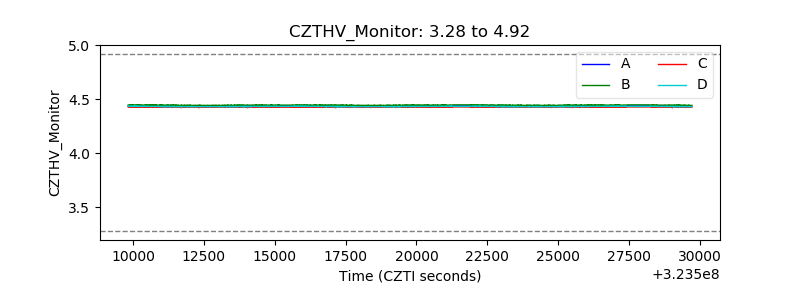 |
| D_VDD |  |
| Temperature 1 | 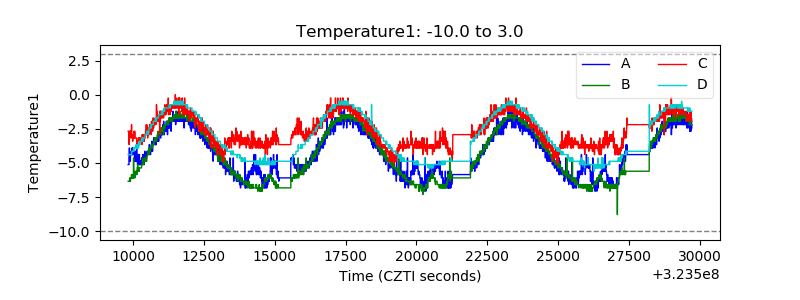 |
| Veto HV Monitor | 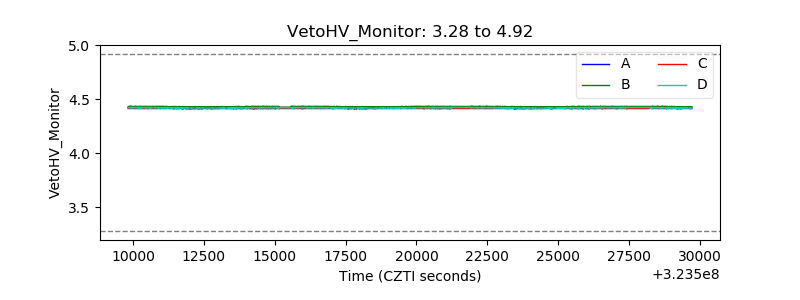 |
| Veto LLD | 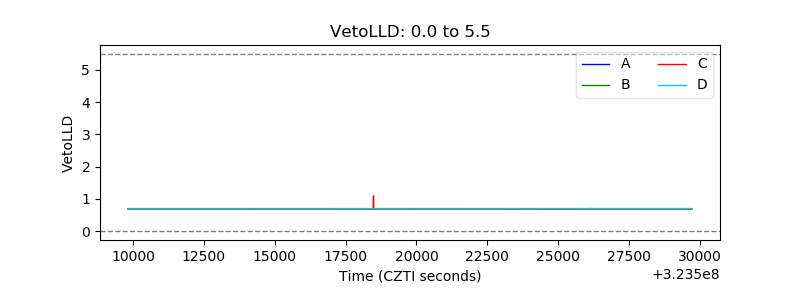 |
| Alpha Counter | 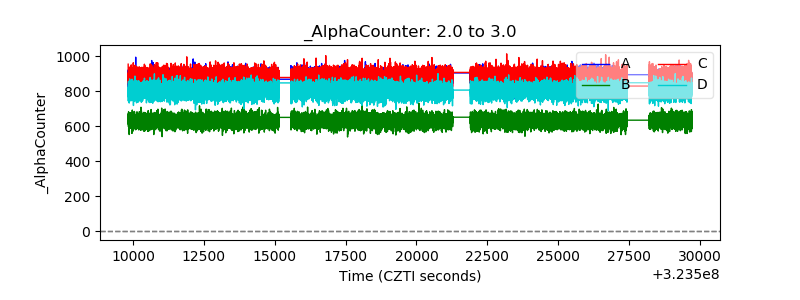 |
| _CPM_Rate | 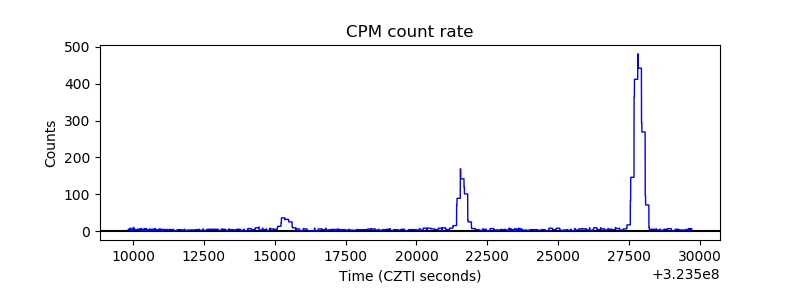 |
| CZT Counter | 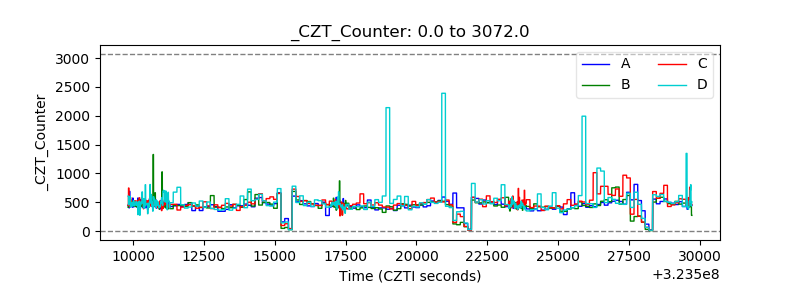 |
| +2.5 Volts monitor |  |
| +5 Volts monitor |  |
| _ROLL_ROT | 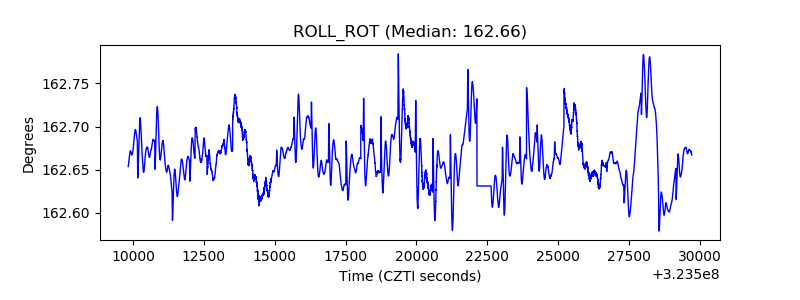 |
| _Roll_DEC | 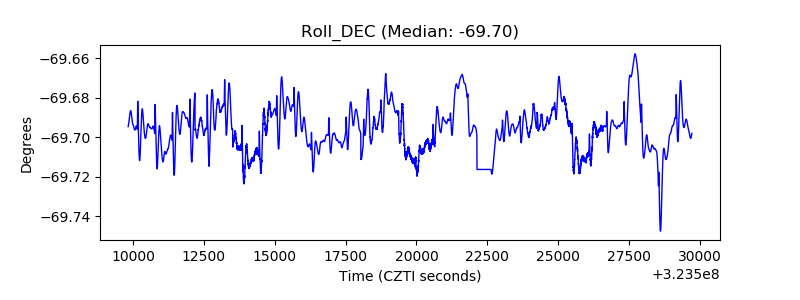 |
| _Roll_RA | 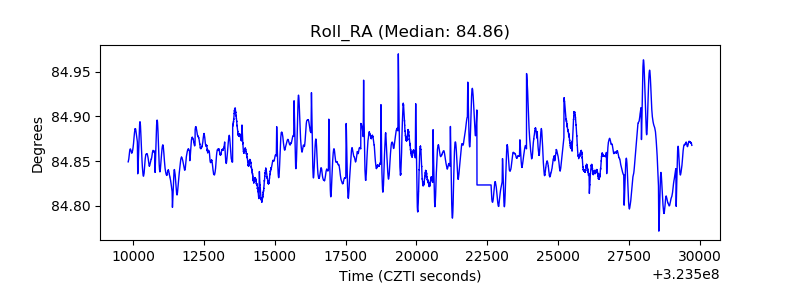 |
| Veto Counter | 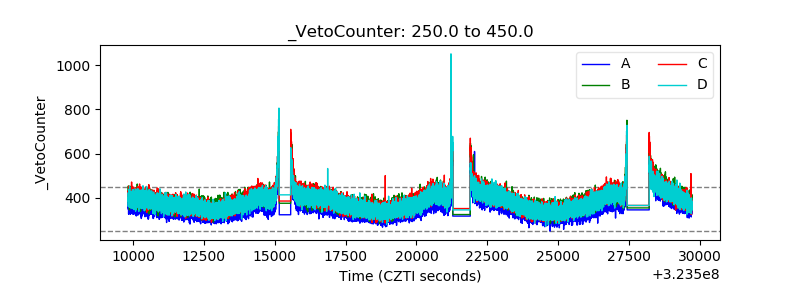 |