| Param | Original file | Final file |
|---|---|---|
| Filename | modeM0/AS1A08_008T01_9000003596_24401cztM0_level2.evt | modeM0/AS1A08_008T01_9000003596_24401cztM0_level2_quad_clean.evt |
| Size (bytes) | 107,700,480 | 29,805,120 |
| Size | 102.7 MB | 28.4 MB |
| Events in quadrant A | 735,612 | 203,397 |
| Events in quadrant B | 737,736 | 206,792 |
| Events in quadrant C | 896,814 | 191,588 |
| Events in quadrant D | 789,859 | 192,293 |
| Mode SS | |||
|---|---|---|---|
| Quadrant | BADHDUFLAG | Total packets | Discarded packets |
| A | 0 | 28 | 0 |
| B | 0 | 28 | 0 |
| C | 0 | 28 | 0 |
| D | 0 | 28 | 0 |
| Mode M0 | |||
|---|---|---|---|
| Quadrant | BADHDUFLAG | Total packets | Discarded packets |
| A | 0 | 3035 | 0 |
| B | 0 | 3040 | 0 |
| C | 0 | 3619 | 0 |
| D | 0 | 3228 | 0 |
| Quadrant | Total seconds | Saturated seconds | Saturation percentage |
|---|---|---|---|
| A | 1458 | 3 | 0.205761% |
| B | 1459 | 3 | 0.205620% |
| C | 1459 | 17 | 1.165182% |
| D | 1459 | 4 | 0.274160% |
Noise dominated data is calculated using 1-second bins in cleaned event files. If a bin has >2000 counts, and if more than 50% of those come from <1% of pixels, then it is considered to be noise-dominated and hence unusable.
| Quadrant | # 1 sec bins | Bins with >0 counts | Bins with >2000 counts | High rate bins dominated by noise | Noise dominated (total time) | Noise dominated (detector-on time) | Marked lightcurve |
|---|---|---|---|---|---|---|---|
| A | 1458 | 1458 | 0 | 0 | 0.00% | 0.00% |  |
| B | 1459 | 1459 | 0 | 0 | 0.00% | 0.00% |  |
| C | 1459 | 1459 | 5 | 5 | 0.34% | 0.34% |  |
| D | 1459 | 1459 | 3 | 3 | 0.21% | 0.21% |  |
Top three noisy pixels from each quadrant. If the there are fewer than three noisy pixels in the level2.evt file, extra rows are filled as -1
| Pixel properties | Quadrant properties | ||||||
|---|---|---|---|---|---|---|---|
| Quadrant | DetID | PixID | Counts | Sigma | Mean | Median | Sigma |
| A | 13 | 254 | 2638 | 61.41 | 190 | 187 | 39.9 |
| A | 0 | 226 | 1677 | 37.33 | 190 | 187 | 39.9 |
| A | 3 | 137 | 1665 | 37.03 | 190 | 187 | 39.9 |
| B | 0 | 190 | 6262 | 160.21 | 186 | 182 | 38.0 |
| B | 12 | 111 | 4138 | 104.24 | 186 | 182 | 38.0 |
| B | 11 | 111 | 3853 | 96.73 | 186 | 182 | 38.0 |
| C | 7 | 247 | 182262 | 4266.31 | 175 | 176 | 42.7 |
| C | 14 | 238 | 27887 | 649.27 | 175 | 176 | 42.7 |
| C | 13 | 61 | 1283 | 25.94 | 175 | 176 | 42.7 |
| D | 1 | 52 | 74794 | 1580.69 | 184 | 178 | 47.2 |
| D | 8 | 195 | 10296 | 214.34 | 184 | 178 | 47.2 |
| D | 2 | 249 | 9739 | 202.54 | 184 | 178 | 47.2 |
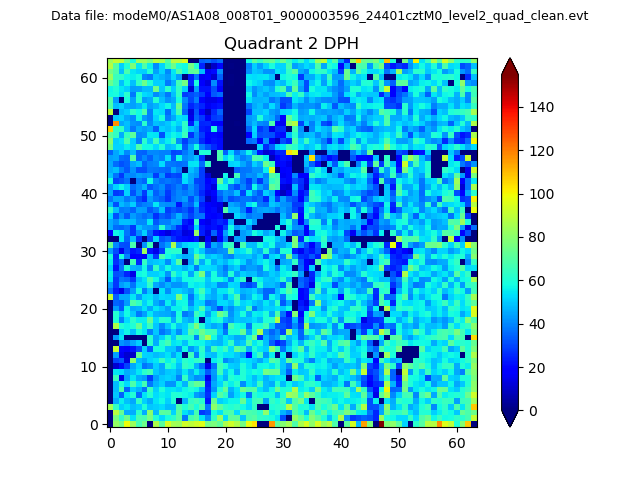
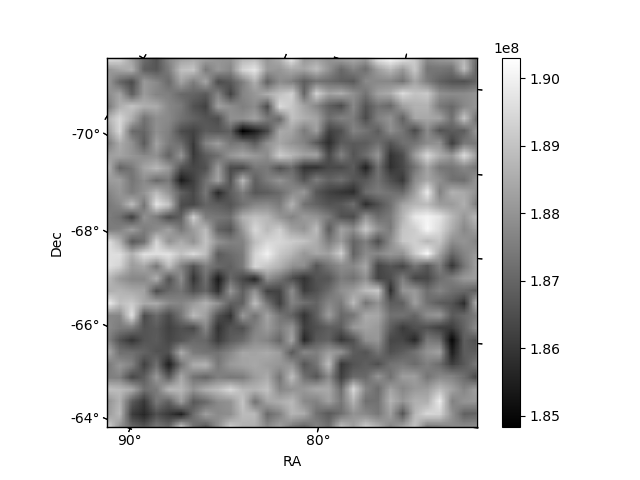
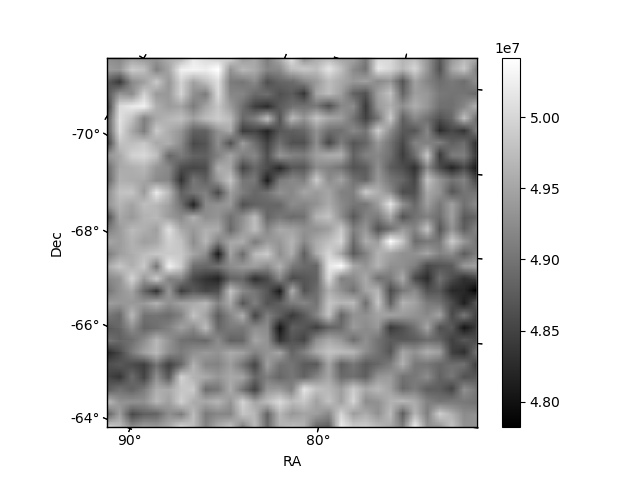
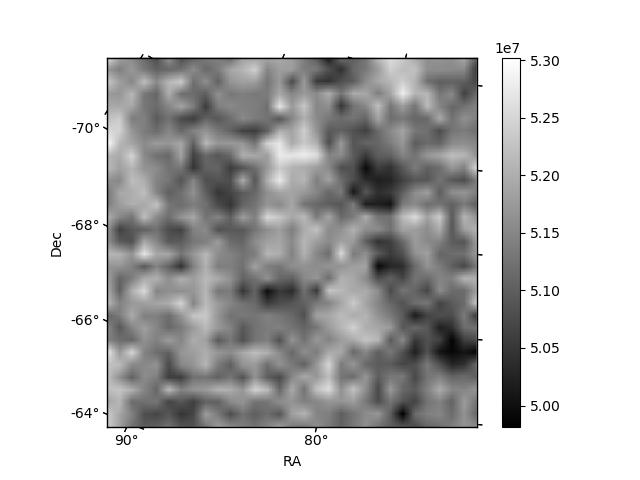
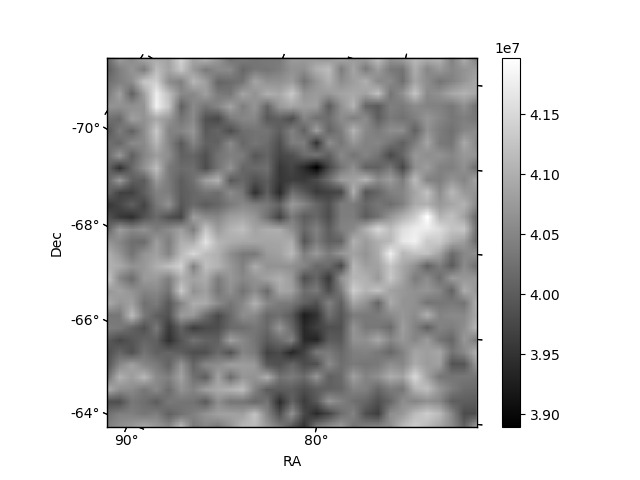
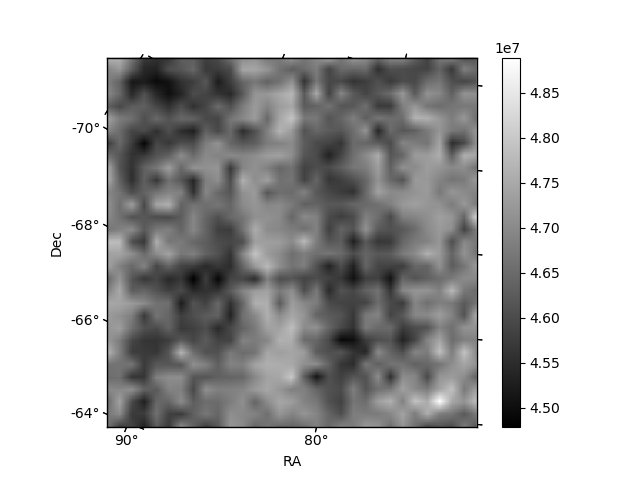
Histogram calculated using DETX and DETY for each event in the final _common_clean file
| Quadrant A | 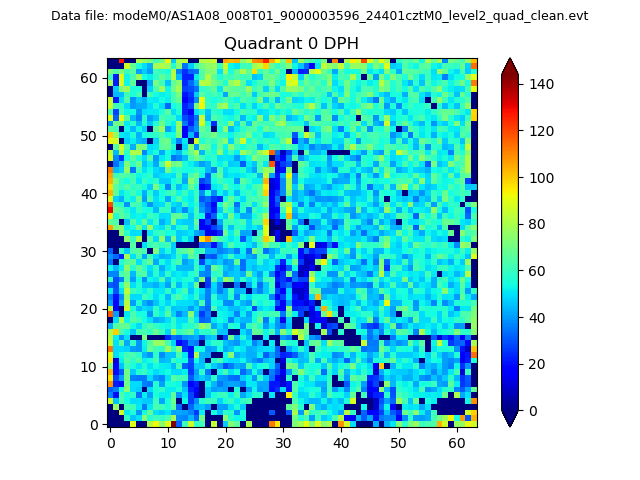 |
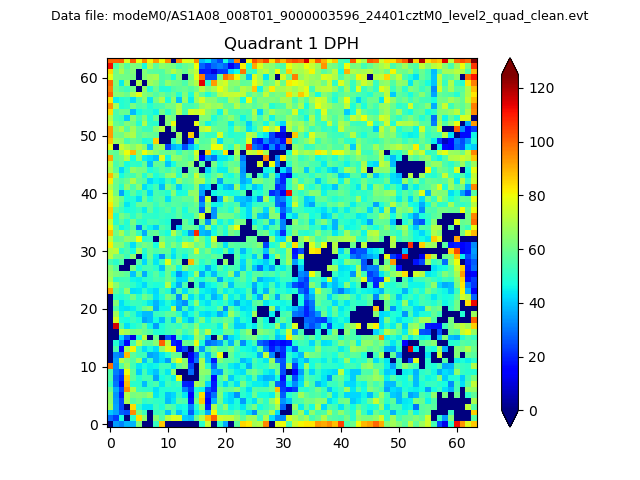 |
Quadrant B |
|---|---|---|---|
| Quadrant D | 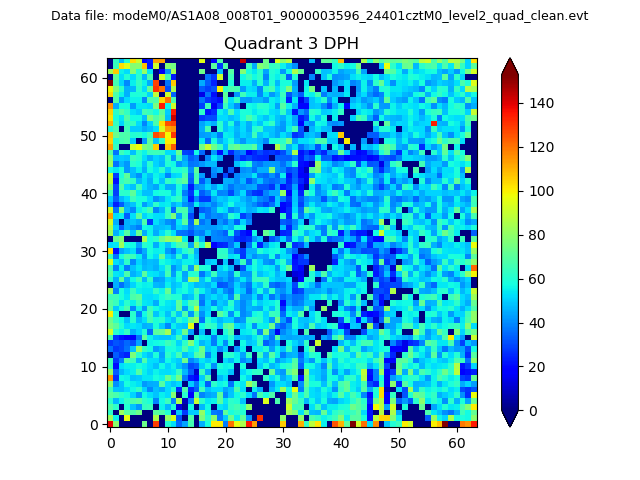 |
 |
Quadrant C |
| Plot type | Count rate plots | Images |
|---|---|---|
| Comparison with Poisson distribution Blue bars denote a histogram of data divided into 1 sec bins. Red curve is a Poisson curve with rate = median count rate of data. |
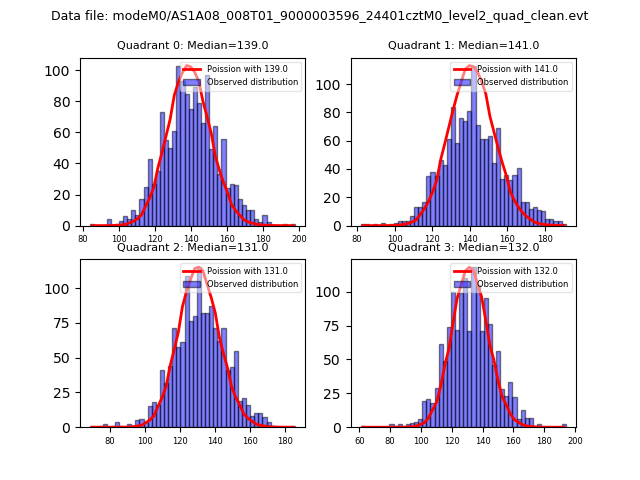 |
 |
| Quadrant-wise count rates Data is divided into 100 sec bins |
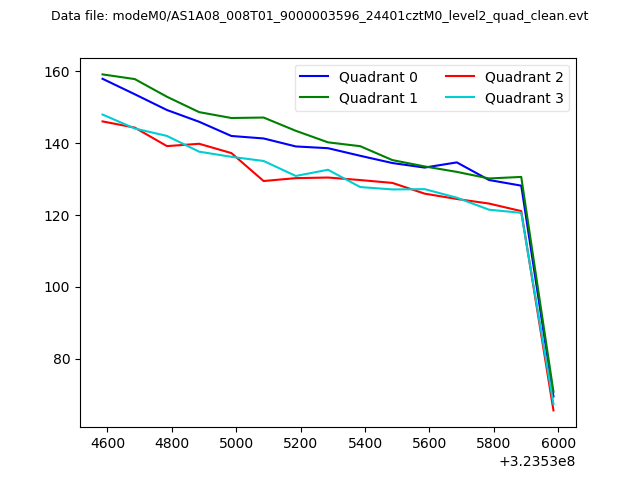 |
|
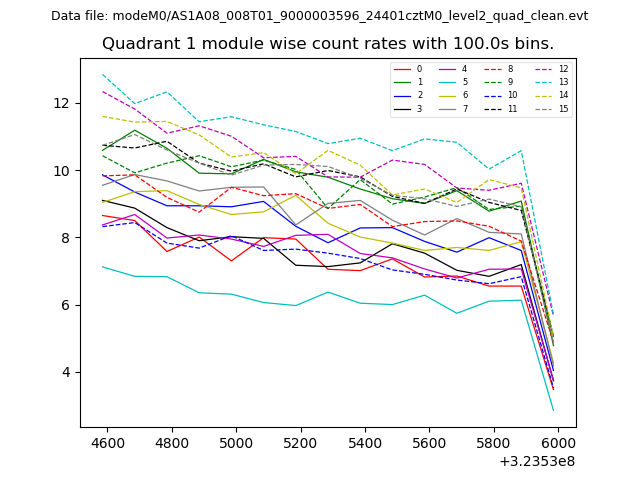
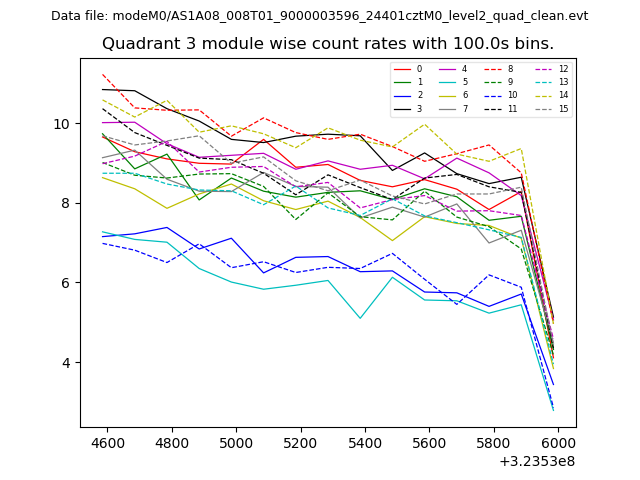
| Module-wise count rates for Quadrant A Data is divided into 100 sec bins |
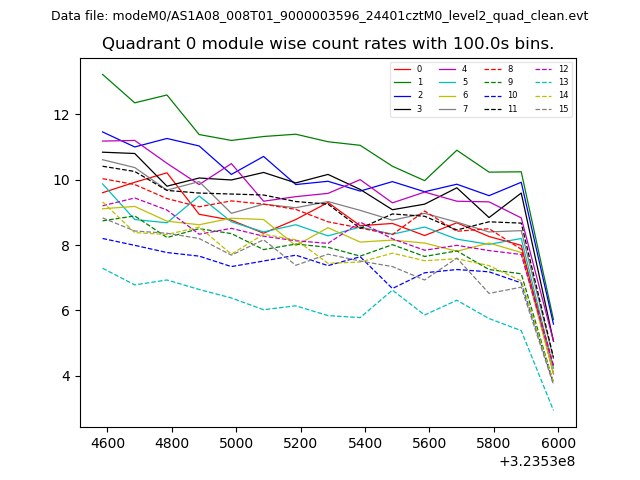 |
 |
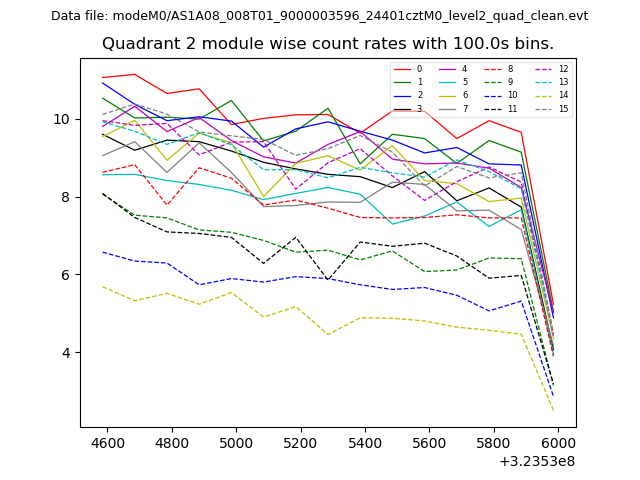
| Module-wise count rates for Quadrant B Data is divided into 100 sec bins |
 |
 |
| Module-wise count rates for Quadrant C Data is divided into 100 sec bins |
 |
 |
| Module-wise count rates for Quadrant D Data is divided into 100 sec bins |
 |
 |
| Parameter | Plot |
|---|---|
| CZT HV Monitor | 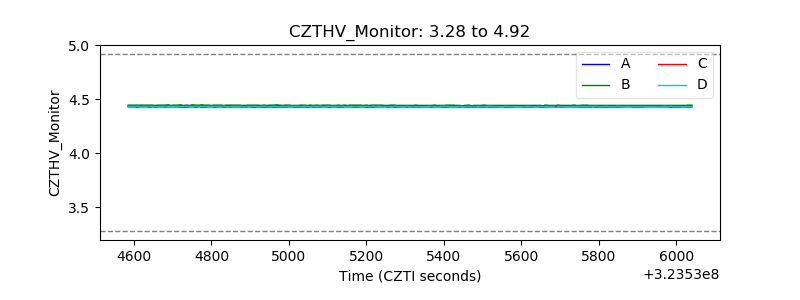 |
| D_VDD | 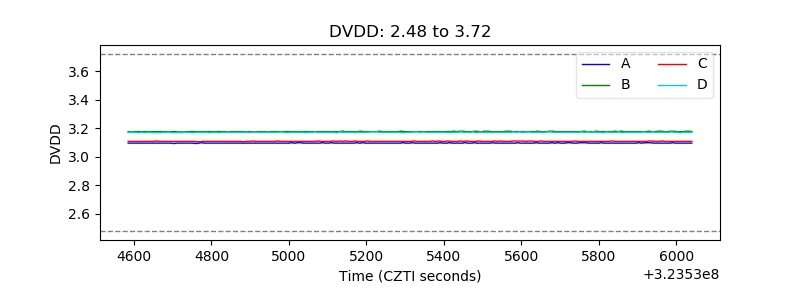 |
| Temperature 1 | 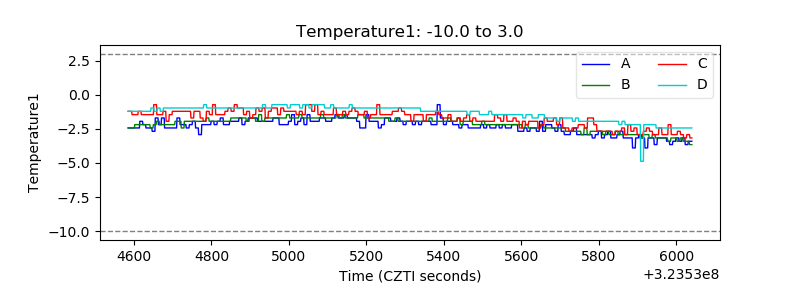 |
| Veto HV Monitor |  |
| Veto LLD | 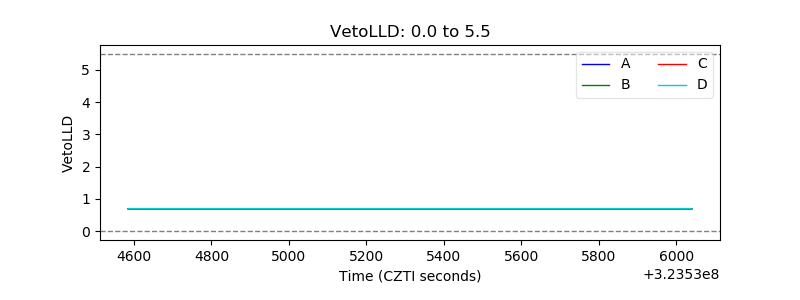 |
| Alpha Counter | 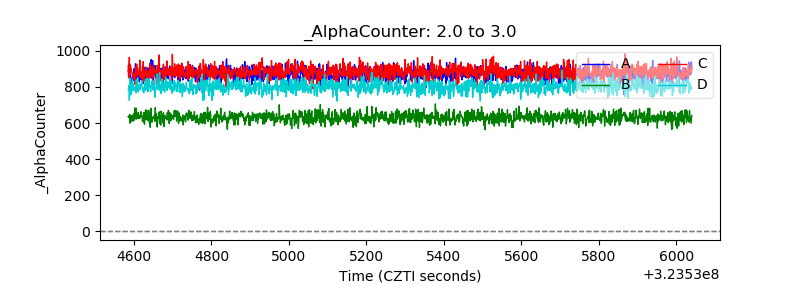 |
| _CPM_Rate | 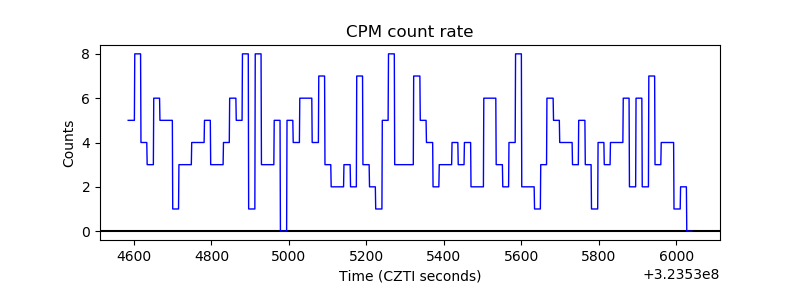 |
| CZT Counter | 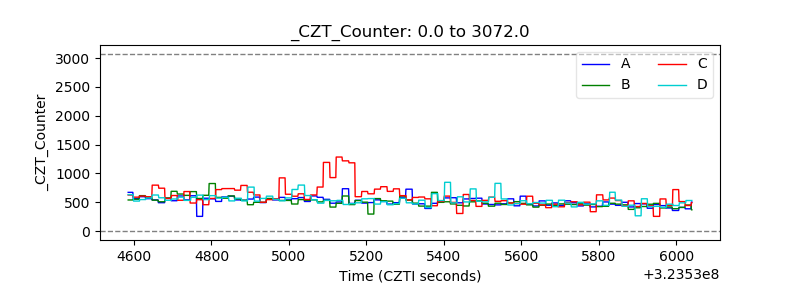 |
| +2.5 Volts monitor |  |
| +5 Volts monitor |  |
| _ROLL_ROT | 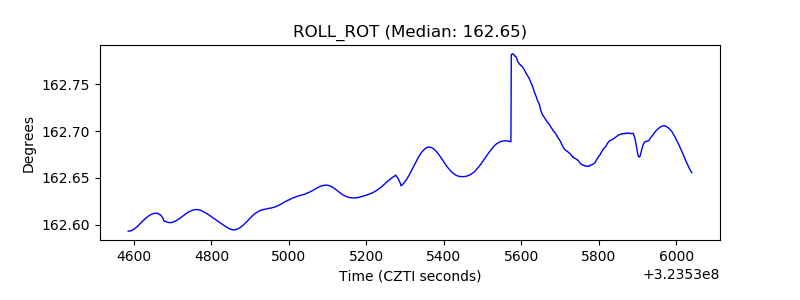 |
| _Roll_DEC | 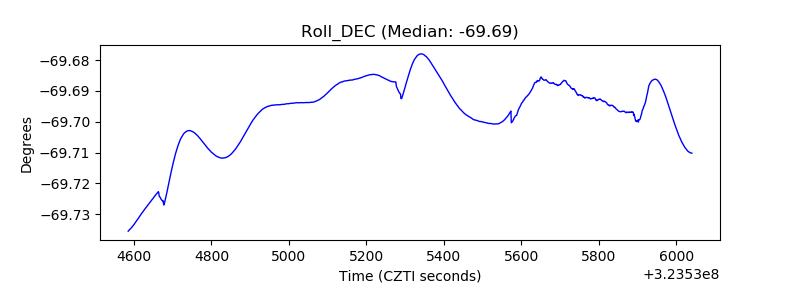 |
| _Roll_RA | 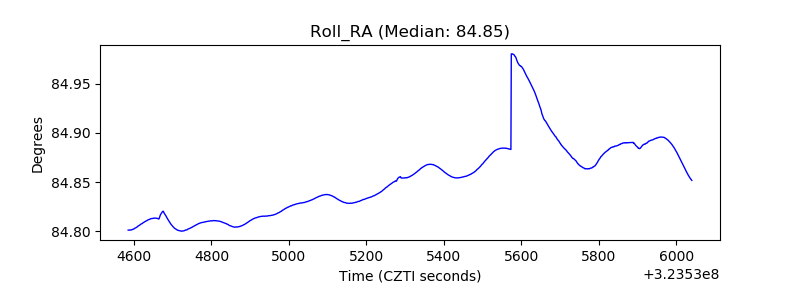 |
| Veto Counter | 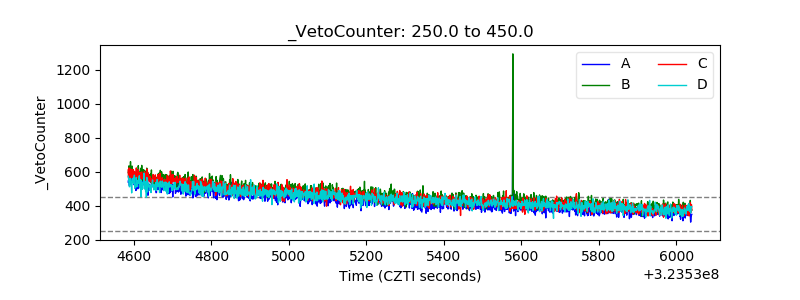 |