| Param | Original file | Final file |
|---|---|---|
| Filename | modeM0/AS1A07_001T01_9000003598cztM0_level2.fits | modeM0/AS1A07_001T01_9000003598cztM0_level2_quad_clean.evt |
| Size (bytes) | 147,476,160 | 110,332,800 |
| Size | 140.6 MB | 105.2 MB |
| Events in quadrant A | 924,452 | 614,115 |
| Events in quadrant B | 883,846 | 618,608 |
| Events in quadrant C | 877,044 | 570,150 |
| Events in quadrant D | 777,236 | 533,018 |
| Mode M0 | |||
|---|---|---|---|
| Quadrant | BADHDUFLAG | Total packets | Discarded packets |
| A | 0 | 30234 | 0 |
| B | 0 | 31075 | 0 |
| C | 0 | 31362 | 0 |
| D | 0 | 32001 | 0 |
| Mode M9 | |||
|---|---|---|---|
| Quadrant | BADHDUFLAG | Total packets | Discarded packets |
| A | 0 | 35 | 0 |
| B | 0 | 35 | 0 |
| C | 0 | 35 | 0 |
| D | 0 | 35 | 0 |
| Mode SS | |||
|---|---|---|---|
| Quadrant | BADHDUFLAG | Total packets | Discarded packets |
| A | 0 | 298 | 0 |
| B | 0 | 298 | 0 |
| C | 0 | 298 | 0 |
| D | 0 | 298 | 0 |
| Quadrant | Total seconds | Saturated seconds | Saturation percentage |
|---|---|---|---|
| A | 14544 | 59 | 0.405666% |
| B | 14544 | 134 | 0.921342% |
| C | 14544 | 127 | 0.873212% |
| D | 14544 | 49 | 0.336909% |
Noise dominated data is calculated using 1-second bins in cleaned event files. If a bin has >2000 counts, and if more than 50% of those come from <1% of pixels, then it is considered to be noise-dominated and hence unusable.
| Quadrant | # 1 sec bins | Bins with >0 counts | Bins with >2000 counts | High rate bins dominated by noise | Noise dominated (total time) | Noise dominated (detector-on time) | Marked lightcurve |
|---|---|---|---|---|---|---|---|
| A | 18099 | 14543 | 0 | 0 | 0.00% | 0.00% |  |
| B | 18099 | 14543 | 0 | 0 | 0.00% | 0.00% | 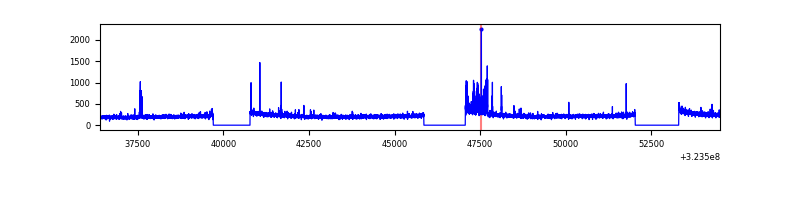 |
| C | 18099 | 14543 | 0 | 0 | 0.00% | 0.00% | 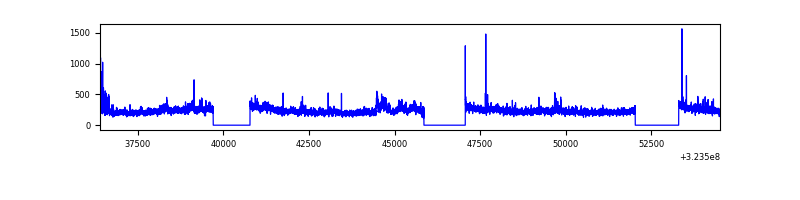 |
| D | 18099 | 14543 | 0 | 0 | 0.00% | 0.00% | 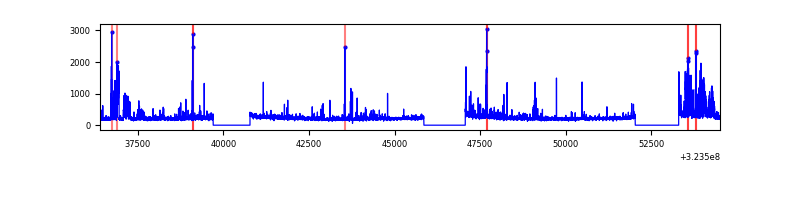 |
Top three noisy pixels from each quadrant. If the there are fewer than three noisy pixels in the level2.evt file, extra rows are filled as -1
| Pixel properties | Quadrant properties | ||||||
|---|---|---|---|---|---|---|---|
| Quadrant | DetID | PixID | Counts | Sigma | Mean | Median | Sigma |
| A | 0 | 29 | 885 | 10.76 | 240 | 228 | 61.0 |
| A | 7 | 110 | 731 | 8.24 | 240 | 228 | 61.0 |
| A | 9 | 19 | 724 | 8.13 | 240 | 228 | 61.0 |
| B | 2 | 9 | 711 | 10.23 | 234 | 225 | 47.5 |
| B | 5 | 128 | 604 | 7.98 | 234 | 225 | 47.5 |
| B | 5 | 255 | 602 | 7.93 | 234 | 225 | 47.5 |
| C | 12 | 241 | 633 | 6.99 | 231 | 218 | 59.4 |
| C | 12 | 249 | 620 | 6.77 | 231 | 218 | 59.4 |
| C | 12 | 250 | 615 | 6.68 | 231 | 218 | 59.4 |
| D | 6 | 231 | 587 | 6.42 | 221 | 202 | 59.9 |
| D | 10 | 113 | 570 | 6.14 | 221 | 202 | 59.9 |
| D | 15 | 46 | 565 | 6.06 | 221 | 202 | 59.9 |
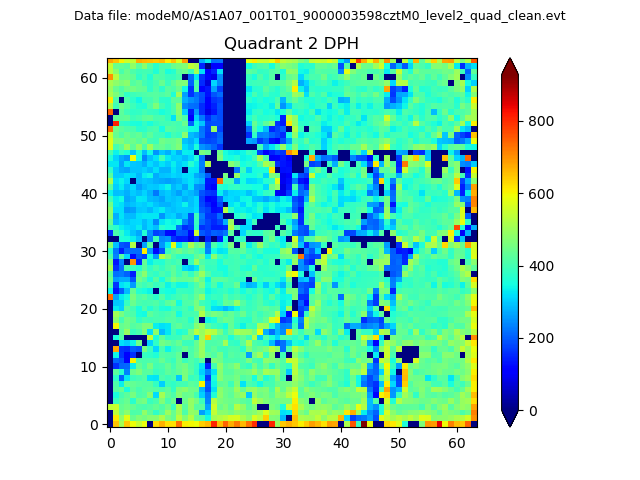
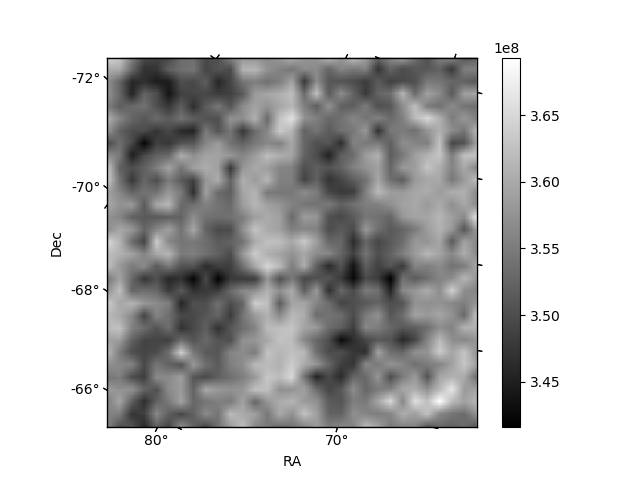
Histogram calculated using DETX and DETY for each event in the final _common_clean file
| Quadrant A | 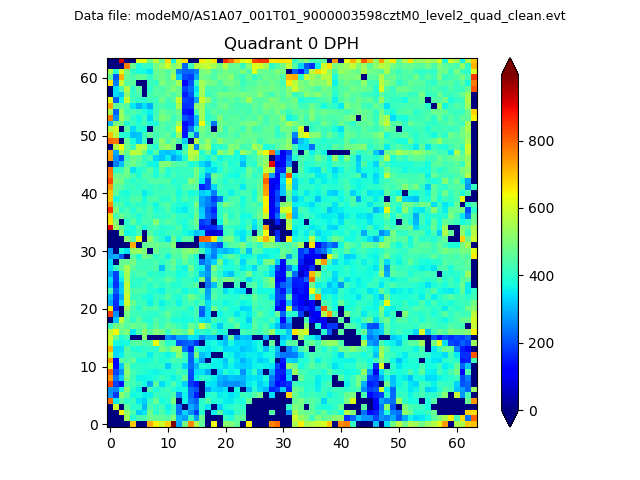 |
 |
Quadrant B |
|---|---|---|---|
| Quadrant D |  |
 |
Quadrant C |
| Plot type | Count rate plots | Images |
|---|---|---|
| Comparison with Poisson distribution Blue bars denote a histogram of data divided into 1 sec bins. Red curve is a Poisson curve with rate = median count rate of data. |
 |
 |
| Quadrant-wise count rates Data is divided into 100 sec bins |
 |
|
| Module-wise count rates for Quadrant A Data is divided into 100 sec bins |
 |
 |
| Module-wise count rates for Quadrant B Data is divided into 100 sec bins |
 |
 |
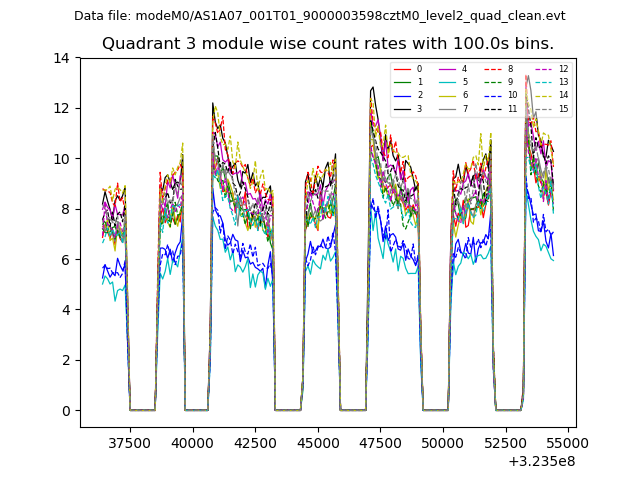
| Module-wise count rates for Quadrant C Data is divided into 100 sec bins |
 |
 |
| Module-wise count rates for Quadrant D Data is divided into 100 sec bins |
 |
 |
| Parameter | Plot |
|---|---|
| CZT HV Monitor |  |
| D_VDD |  |
| Temperature 1 |  |
| Veto HV Monitor |  |
| Veto LLD |  |
| Alpha Counter |  |
| _CPM_Rate | 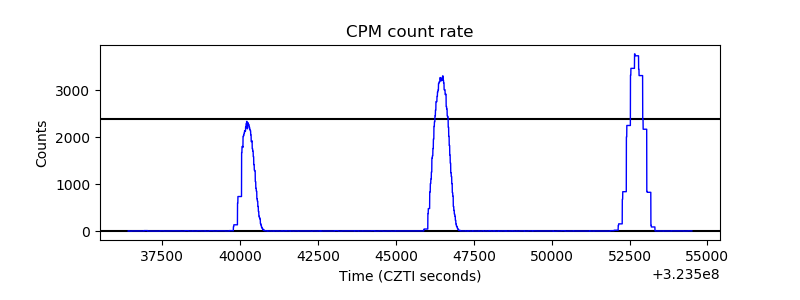 |
| CZT Counter |  |
| +2.5 Volts monitor |  |
| +5 Volts monitor |  |
| _ROLL_ROT |  |
| _Roll_DEC |  |
| _Roll_RA |  |
| Veto Counter |  |