| Param | Original file | Final file |
|---|---|---|
| Filename | modeM0/AS1A07_001T01_9000003598_24401cztM0_level2.evt | modeM0/AS1A07_001T01_9000003598_24401cztM0_level2_quad_clean.evt |
| Size (bytes) | 307,172,160 | 69,240,960 |
| Size | 292.9 MB | 66.0 MB |
| Events in quadrant A | 2,121,428 | 456,393 |
| Events in quadrant B | 2,171,464 | 463,853 |
| Events in quadrant C | 2,357,254 | 431,603 |
| Events in quadrant D | 2,344,861 | 427,887 |
| Mode M0 | |||
|---|---|---|---|
| Quadrant | BADHDUFLAG | Total packets | Discarded packets |
| A | 0 | 9350 | 1 |
| B | 0 | 9411 | 1 |
| C | 0 | 9947 | 1 |
| D | 0 | 9986 | 1 |
| Mode M9 | |||
|---|---|---|---|
| Quadrant | BADHDUFLAG | Total packets | Discarded packets |
| A | 0 | 10 | 0 |
| B | 0 | 10 | 0 |
| C | 0 | 10 | 0 |
| D | 0 | 10 | 0 |
| Mode SS | |||
|---|---|---|---|
| Quadrant | BADHDUFLAG | Total packets | Discarded packets |
| A | 0 | 94 | 0 |
| B | 0 | 94 | 0 |
| C | 0 | 94 | 0 |
| D | 0 | 92 | 0 |
| Quadrant | Total seconds | Saturated seconds | Saturation percentage |
|---|---|---|---|
| A | 4505 | 23 | 0.510544% |
| B | 4505 | 32 | 0.710322% |
| C | 4505 | 47 | 1.043285% |
| D | 4504 | 11 | 0.244227% |
Noise dominated data is calculated using 1-second bins in cleaned event files. If a bin has >2000 counts, and if more than 50% of those come from <1% of pixels, then it is considered to be noise-dominated and hence unusable.
| Quadrant | # 1 sec bins | Bins with >0 counts | Bins with >2000 counts | High rate bins dominated by noise | Noise dominated (total time) | Noise dominated (detector-on time) | Marked lightcurve |
|---|---|---|---|---|---|---|---|
| A | 5580 | 4505 | 0 | 0 | 0.00% | 0.00% | 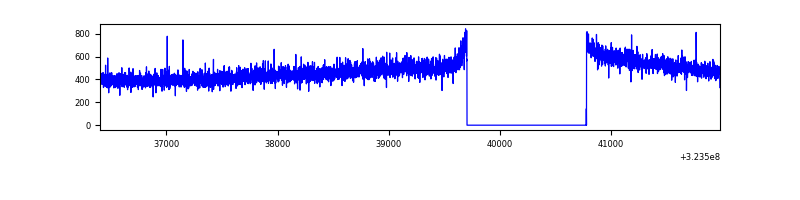 |
| B | 5580 | 4506 | 1 | 1 | 0.02% | 0.02% | 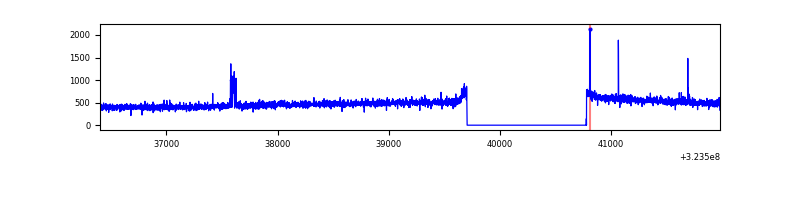 |
| C | 5580 | 4505 | 0 | 0 | 0.00% | 0.00% | 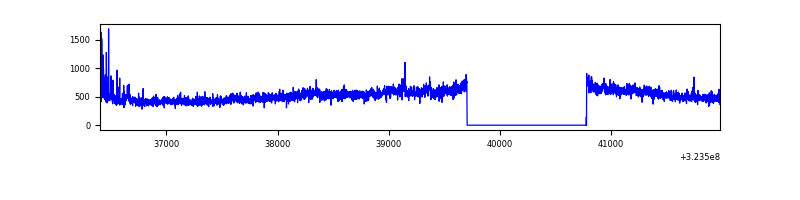 |
| D | 5579 | 4504 | 14 | 14 | 0.25% | 0.31% | 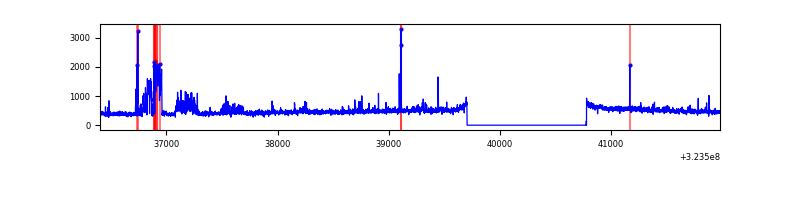 |
Top three noisy pixels from each quadrant. If the there are fewer than three noisy pixels in the level2.evt file, extra rows are filled as -1
| Pixel properties | Quadrant properties | ||||||
|---|---|---|---|---|---|---|---|
| Quadrant | DetID | PixID | Counts | Sigma | Mean | Median | Sigma |
| A | 13 | 254 | 7802 | 65.01 | 550 | 540 | 111.7 |
| A | 3 | 137 | 4824 | 38.35 | 550 | 540 | 111.7 |
| A | 0 | 226 | 4810 | 38.23 | 550 | 540 | 111.7 |
| B | 3 | 64 | 18298 | 170.92 | 547 | 533 | 103.9 |
| B | 12 | 111 | 12396 | 114.14 | 547 | 533 | 103.9 |
| B | 11 | 111 | 10922 | 99.96 | 547 | 533 | 103.9 |
| C | 7 | 247 | 208978 | 1722.73 | 520 | 523 | 121.0 |
| C | 14 | 238 | 82889 | 680.7 | 520 | 523 | 121.0 |
| C | 2 | 16 | 34859 | 283.76 | 520 | 523 | 121.0 |
| D | 1 | 52 | 314156 | 2461.04 | 527 | 510 | 127.4 |
| D | 8 | 195 | 26789 | 206.2 | 527 | 510 | 127.4 |
| D | 2 | 234 | 22294 | 170.93 | 527 | 510 | 127.4 |
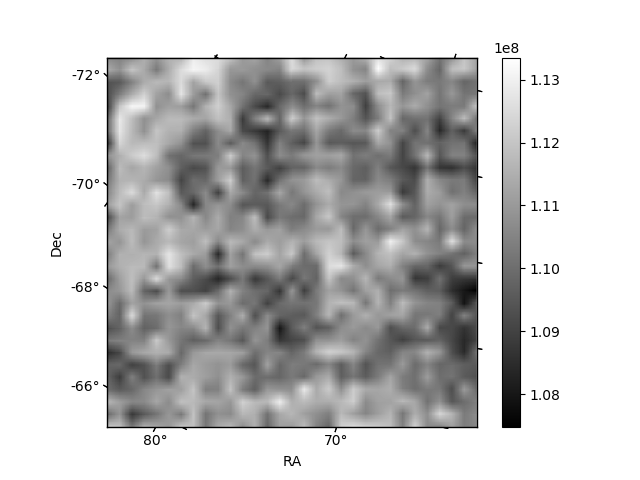
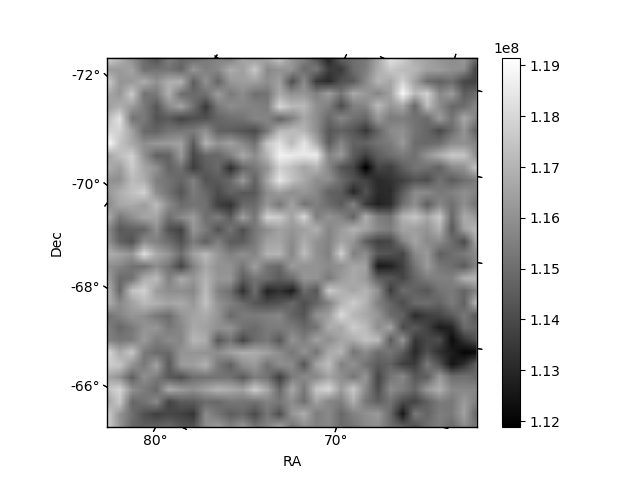
Histogram calculated using DETX and DETY for each event in the final _common_clean file
| Quadrant A |  |
 |
Quadrant B |
|---|---|---|---|
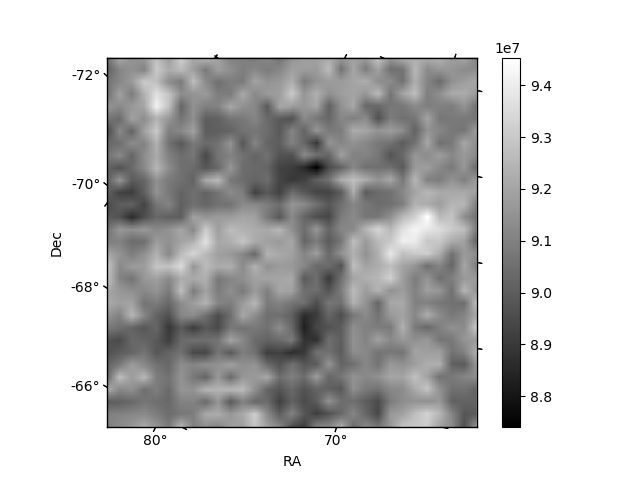
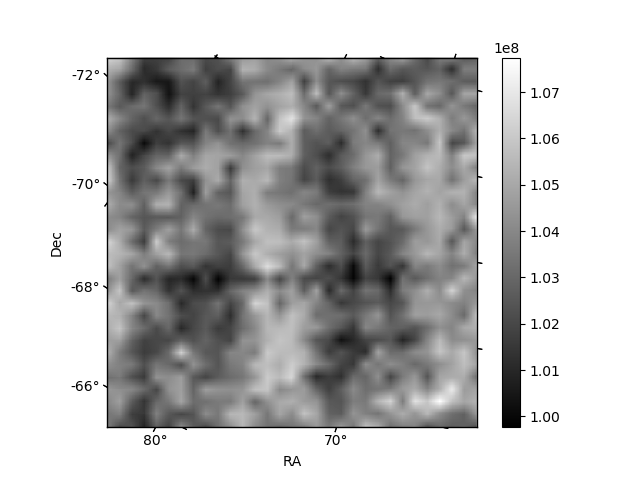
| Quadrant D | 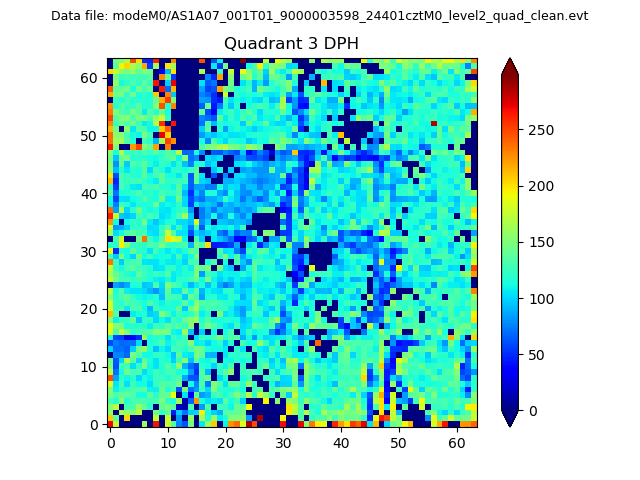 |
 |
Quadrant C |
| Plot type | Count rate plots | Images |
|---|---|---|
| Comparison with Poisson distribution Blue bars denote a histogram of data divided into 1 sec bins. Red curve is a Poisson curve with rate = median count rate of data. |
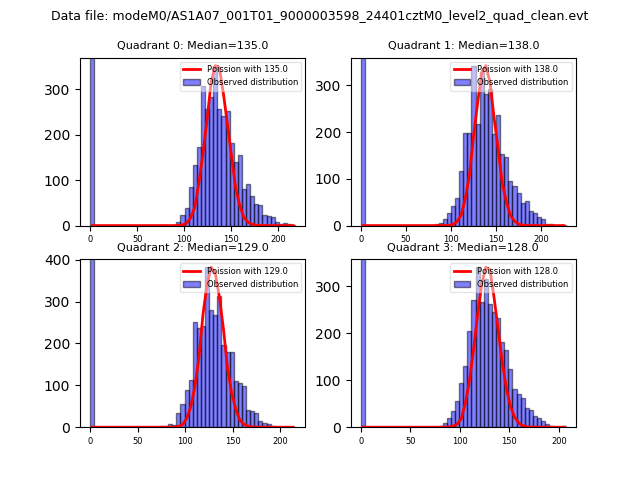 |
 |
| Quadrant-wise count rates Data is divided into 100 sec bins |
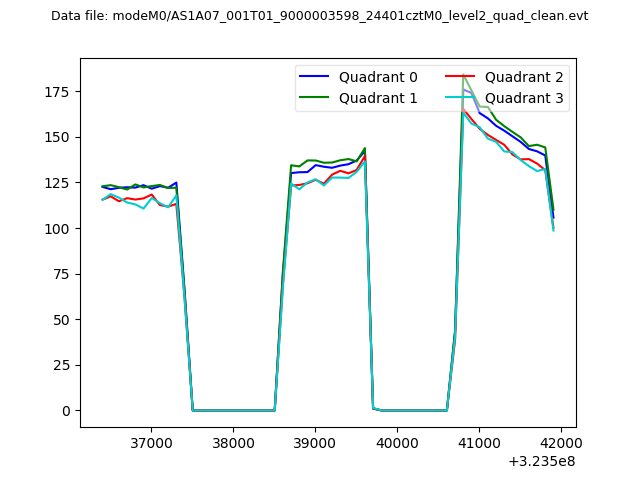 |
|
| Module-wise count rates for Quadrant A Data is divided into 100 sec bins |
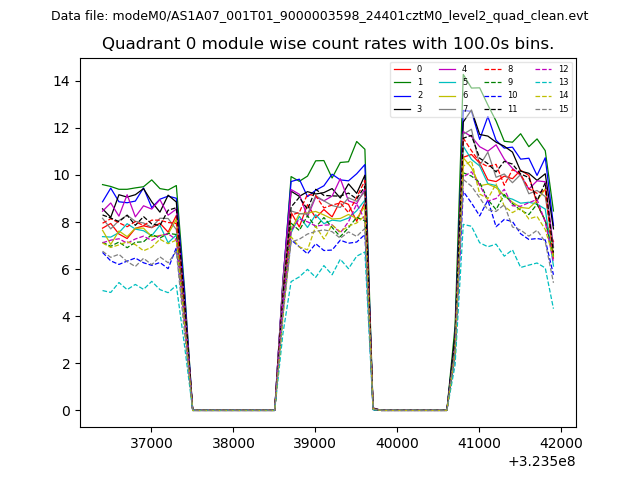 |
 |
| Module-wise count rates for Quadrant B Data is divided into 100 sec bins |
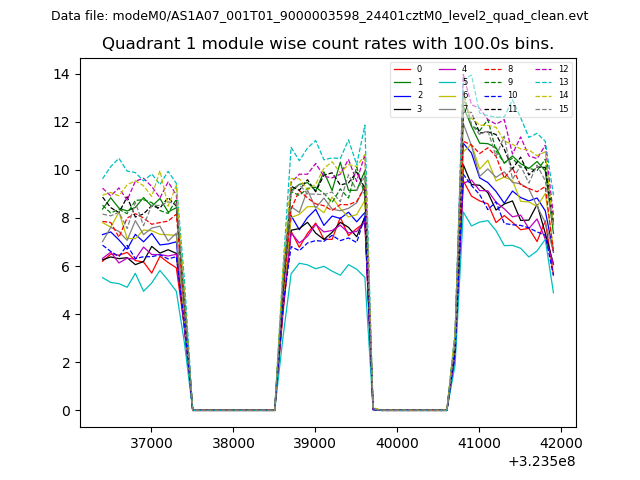 |
 |
| Module-wise count rates for Quadrant C Data is divided into 100 sec bins |
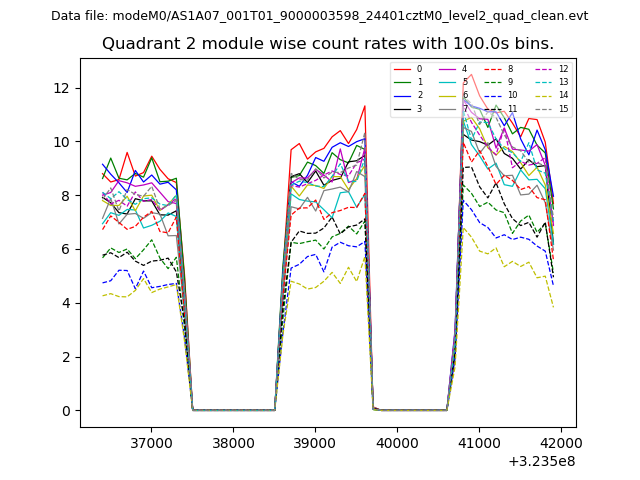 |
 |
| Module-wise count rates for Quadrant D Data is divided into 100 sec bins |
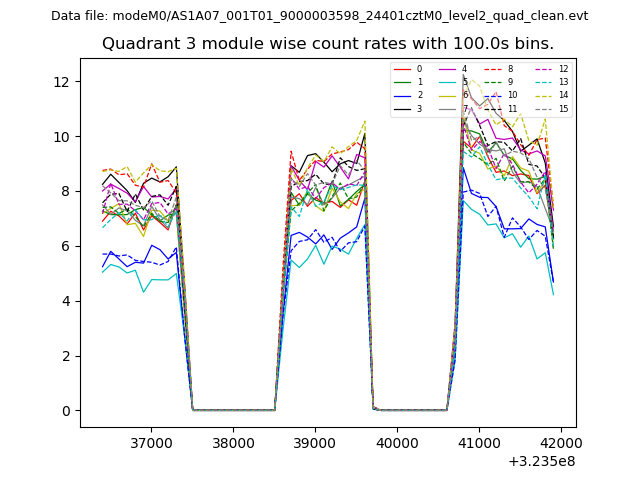 |
 |
| Parameter | Plot |
|---|---|
| CZT HV Monitor | 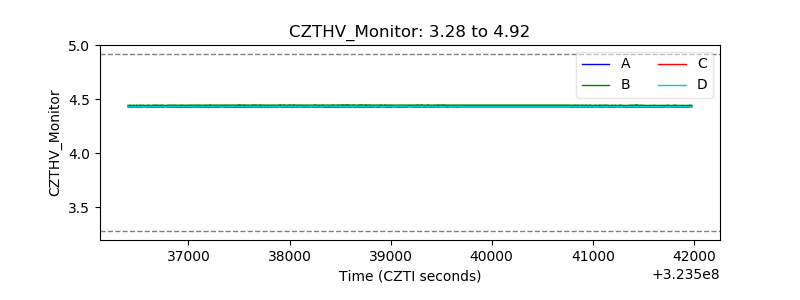 |
| D_VDD | 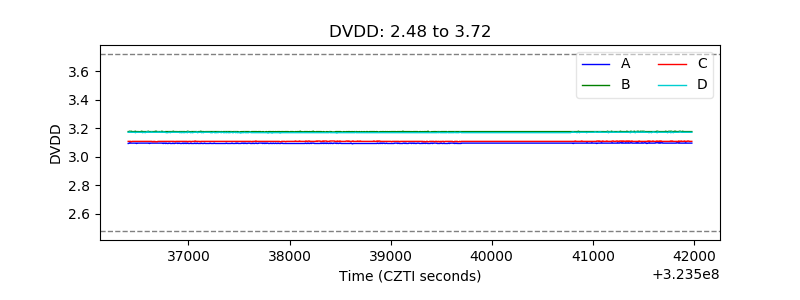 |
| Temperature 1 |  |
| Veto HV Monitor | 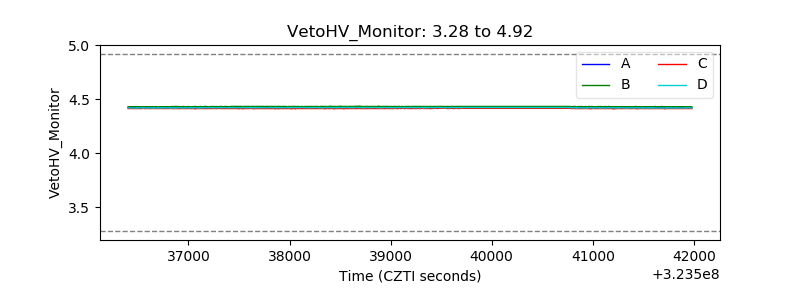 |
| Veto LLD | 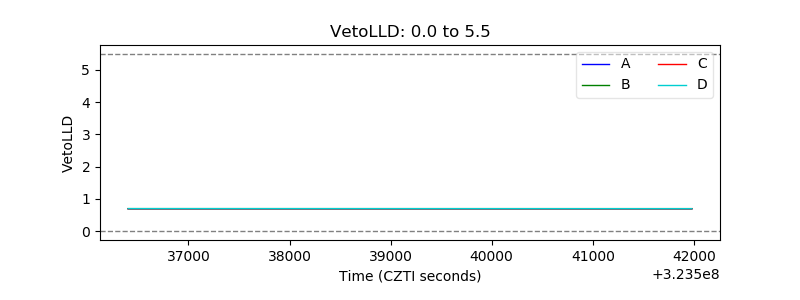 |
| Alpha Counter | 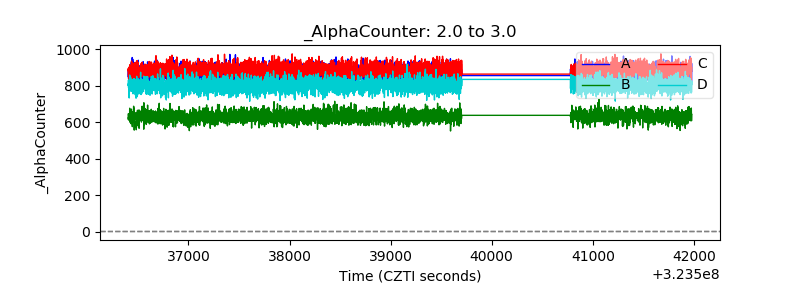 |
| _CPM_Rate | 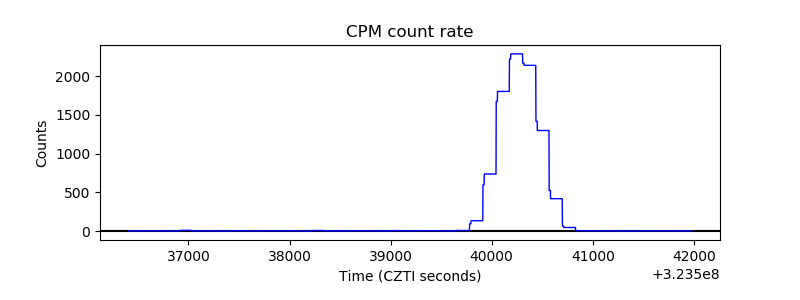 |
| CZT Counter |  |
| +2.5 Volts monitor |  |
| +5 Volts monitor | 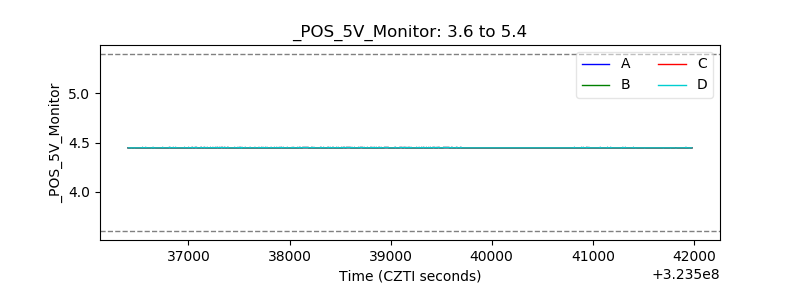 |
| _ROLL_ROT | 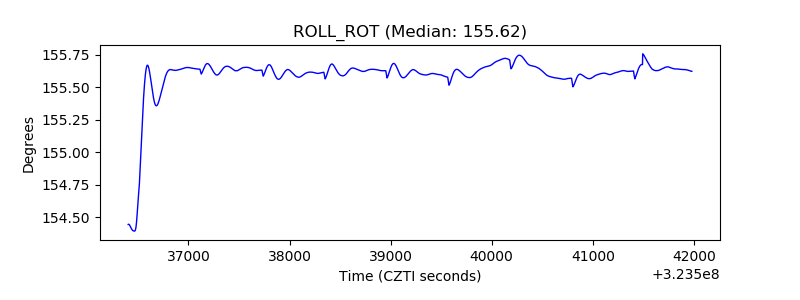 |
| _Roll_DEC | 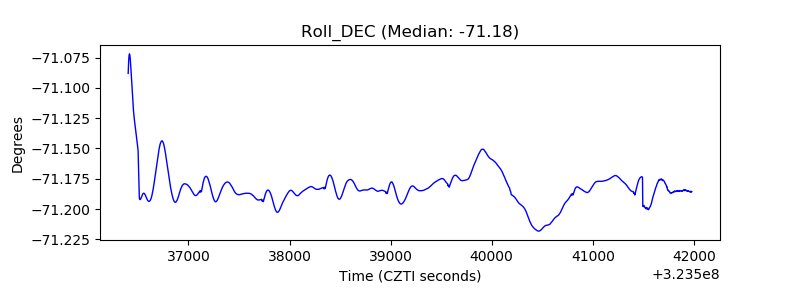 |
| _Roll_RA | 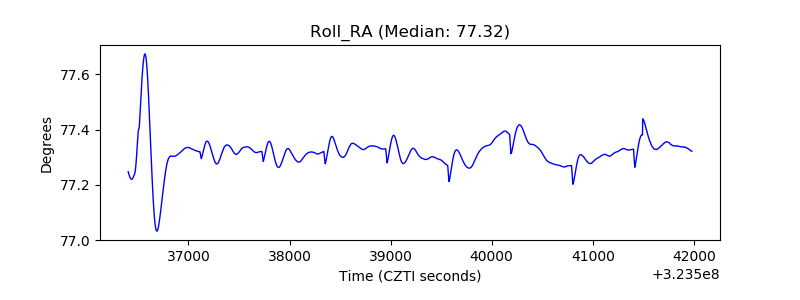 |
| Veto Counter | 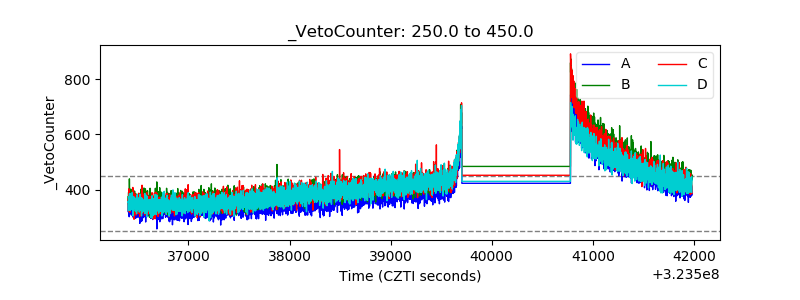 |