| Param | Original file | Final file |
|---|---|---|
| Filename | modeM0/AS1A07_001T01_9000003598_24403cztM0_level2.evt | modeM0/AS1A07_001T01_9000003598_24403cztM0_level2_quad_clean.evt |
| Size (bytes) | 440,023,680 | 111,473,280 |
| Size | 419.6 MB | 106.3 MB |
| Events in quadrant A | 3,070,705 | 757,017 |
| Events in quadrant B | 3,331,465 | 772,438 |
| Events in quadrant C | 3,165,691 | 718,770 |
| Events in quadrant D | 3,339,118 | 697,411 |
| Mode M0 | |||
|---|---|---|---|
| Quadrant | BADHDUFLAG | Total packets | Discarded packets |
| A | 0 | 13051 | 2 |
| B | 0 | 13838 | 2 |
| C | 0 | 13101 | 2 |
| D | 0 | 14114 | 2 |
| Mode M9 | |||
|---|---|---|---|
| Quadrant | BADHDUFLAG | Total packets | Discarded packets |
| A | 0 | 16 | 0 |
| B | 0 | 17 | 0 |
| C | 0 | 17 | 0 |
| D | 0 | 17 | 0 |
| Mode SS | |||
|---|---|---|---|
| Quadrant | BADHDUFLAG | Total packets | Discarded packets |
| A | 0 | 126 | 0 |
| B | 0 | 126 | 0 |
| C | 0 | 126 | 0 |
| D | 0 | 126 | 0 |
| Quadrant | Total seconds | Saturated seconds | Saturation percentage |
|---|---|---|---|
| A | 6166 | 22 | 0.356795% |
| B | 6166 | 86 | 1.394745% |
| C | 6166 | 41 | 0.664937% |
| D | 6166 | 34 | 0.551411% |
Noise dominated data is calculated using 1-second bins in cleaned event files. If a bin has >2000 counts, and if more than 50% of those come from <1% of pixels, then it is considered to be noise-dominated and hence unusable.
| Quadrant | # 1 sec bins | Bins with >0 counts | Bins with >2000 counts | High rate bins dominated by noise | Noise dominated (total time) | Noise dominated (detector-on time) | Marked lightcurve |
|---|---|---|---|---|---|---|---|
| A | 7436 | 6167 | 0 | 0 | 0.00% | 0.00% | 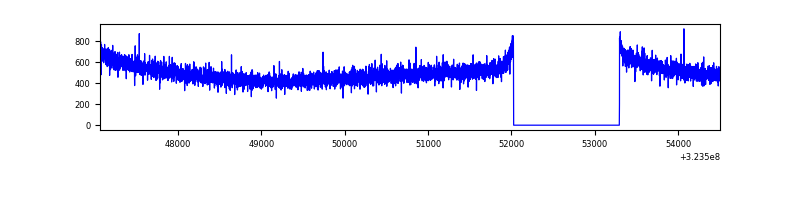 |
| B | 7436 | 6167 | 21 | 21 | 0.28% | 0.34% | 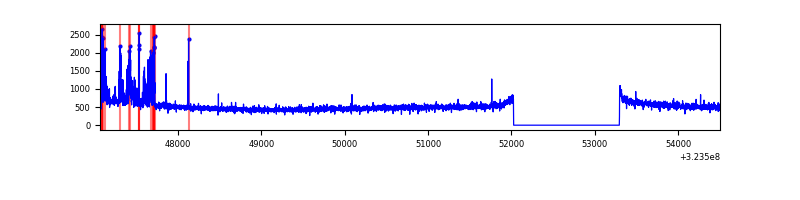 |
| C | 7436 | 6167 | 1 | 1 | 0.01% | 0.02% | 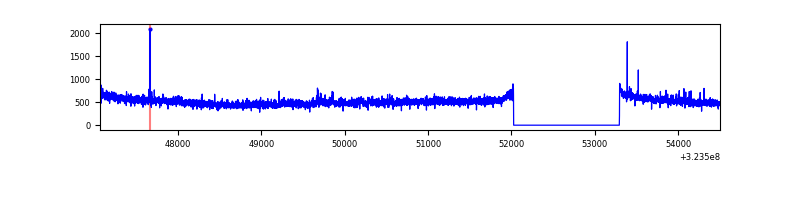 |
| D | 7436 | 6167 | 28 | 28 | 0.38% | 0.45% | 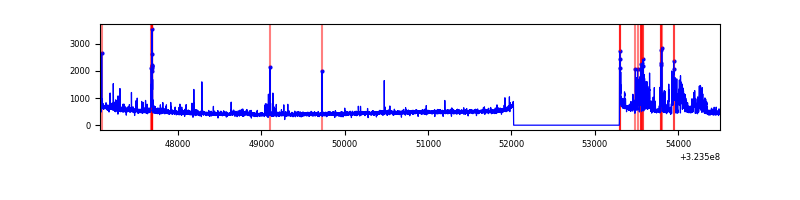 |
Top three noisy pixels from each quadrant. If the there are fewer than three noisy pixels in the level2.evt file, extra rows are filled as -1
| Pixel properties | Quadrant properties | ||||||
|---|---|---|---|---|---|---|---|
| Quadrant | DetID | PixID | Counts | Sigma | Mean | Median | Sigma |
| A | 13 | 254 | 10314 | 60.53 | 796 | 782 | 157.5 |
| A | 3 | 137 | 6864 | 38.62 | 796 | 782 | 157.5 |
| A | 0 | 226 | 6845 | 38.5 | 796 | 782 | 157.5 |
| B | 15 | 33 | 204762 | 1389.55 | 793 | 776 | 146.8 |
| B | 12 | 111 | 16950 | 110.18 | 793 | 776 | 146.8 |
| B | 11 | 111 | 14927 | 96.4 | 793 | 776 | 146.8 |
| C | 14 | 238 | 121842 | 702.82 | 747 | 752 | 172.3 |
| C | 7 | 247 | 108942 | 627.95 | 747 | 752 | 172.3 |
| C | 2 | 16 | 22758 | 127.73 | 747 | 752 | 172.3 |
| D | 1 | 52 | 369148 | 2030.56 | 753 | 731 | 181.4 |
| D | 2 | 120 | 43648 | 236.54 | 753 | 731 | 181.4 |
| D | 8 | 195 | 28517 | 153.14 | 753 | 731 | 181.4 |
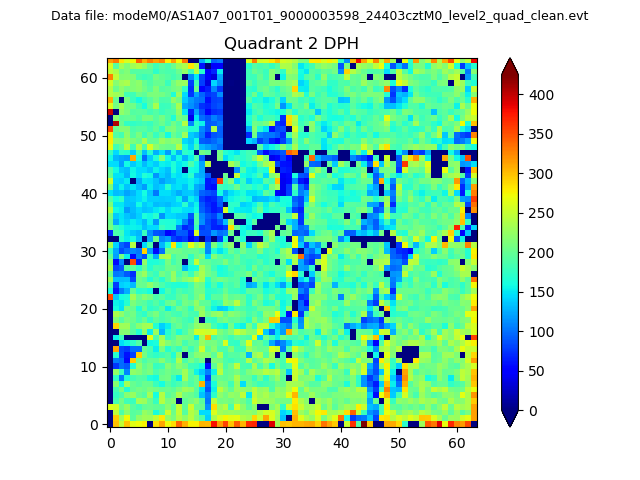
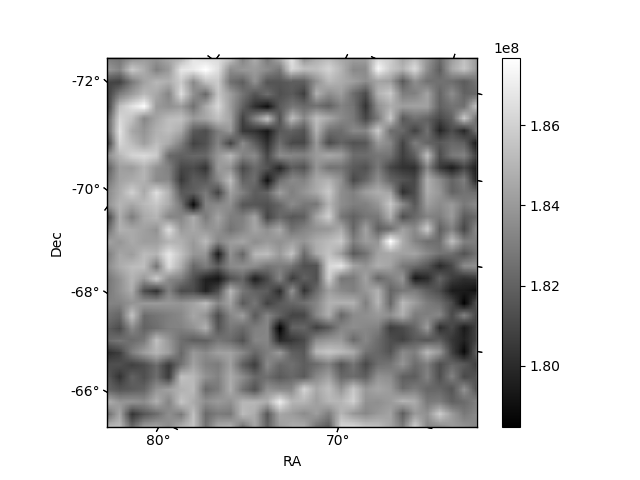
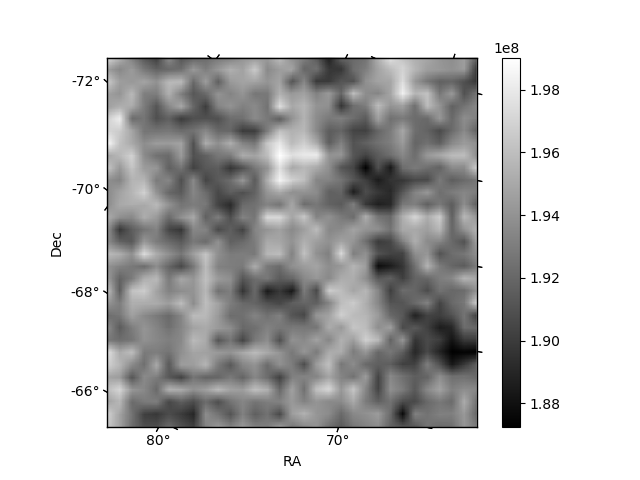
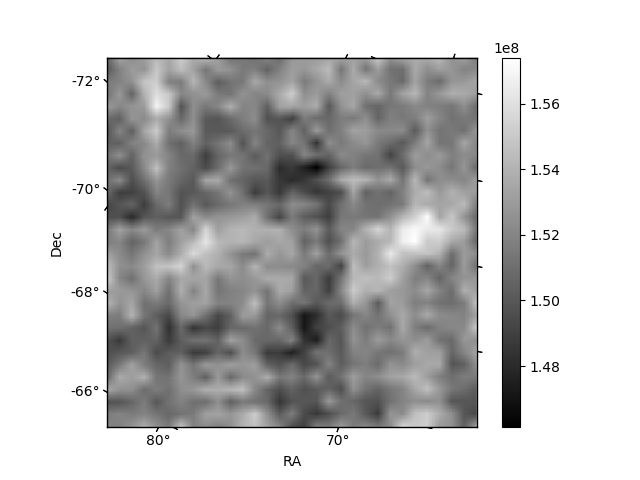
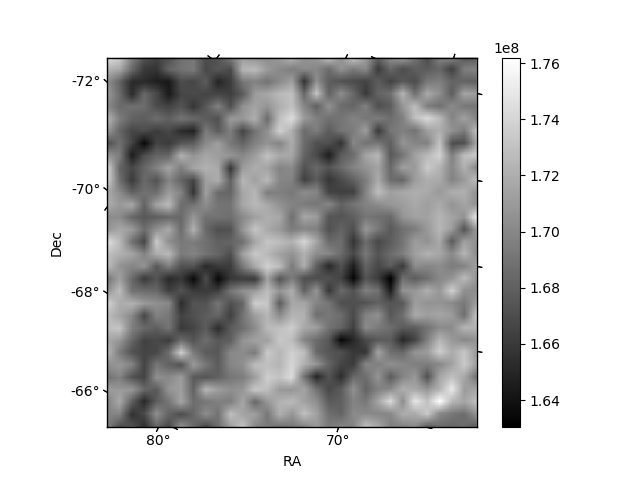
Histogram calculated using DETX and DETY for each event in the final _common_clean file
| Quadrant A | 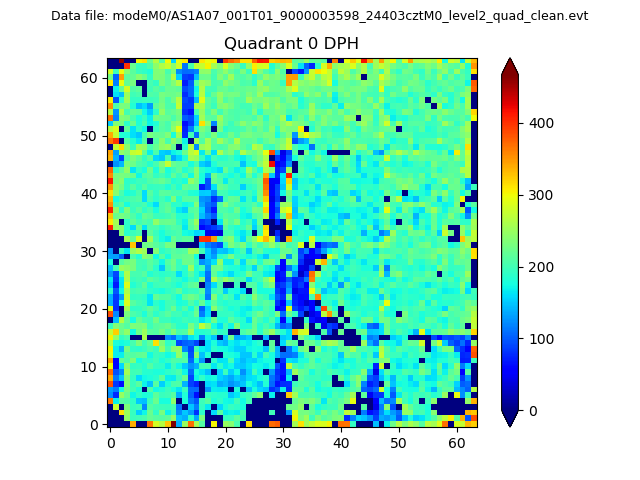 |
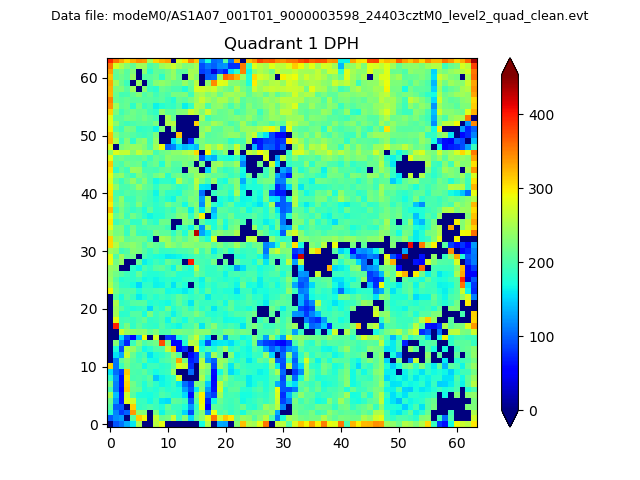 |
Quadrant B |
|---|---|---|---|
| Quadrant D | 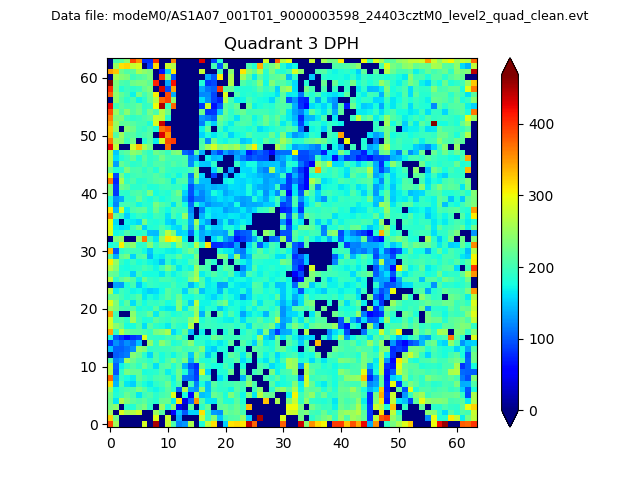 |
 |
Quadrant C |
| Plot type | Count rate plots | Images |
|---|---|---|
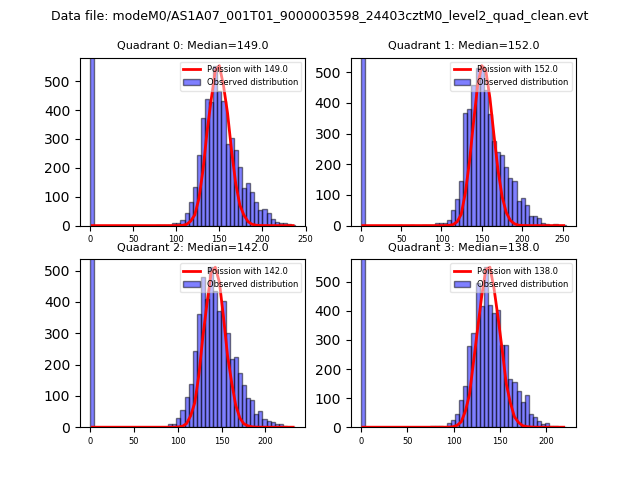
| Comparison with Poisson distribution Blue bars denote a histogram of data divided into 1 sec bins. Red curve is a Poisson curve with rate = median count rate of data. |
 |
 |
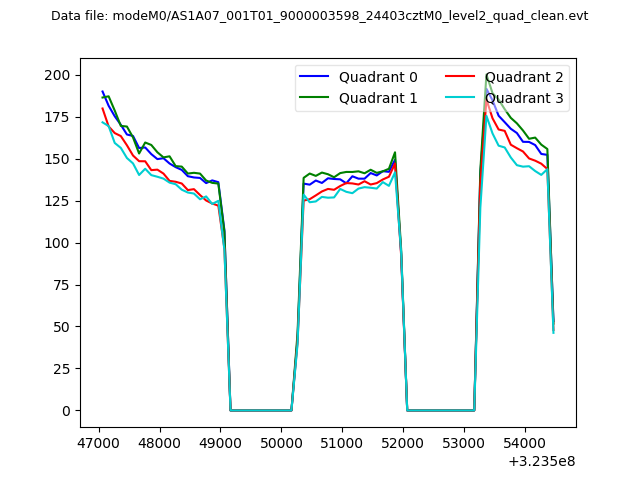
| Quadrant-wise count rates Data is divided into 100 sec bins |
 |
|
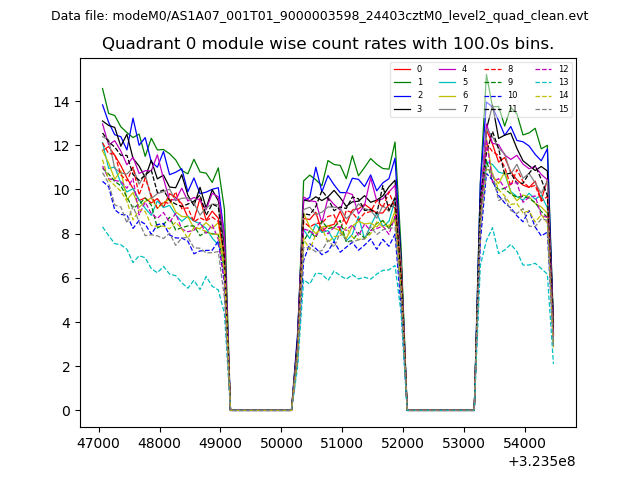
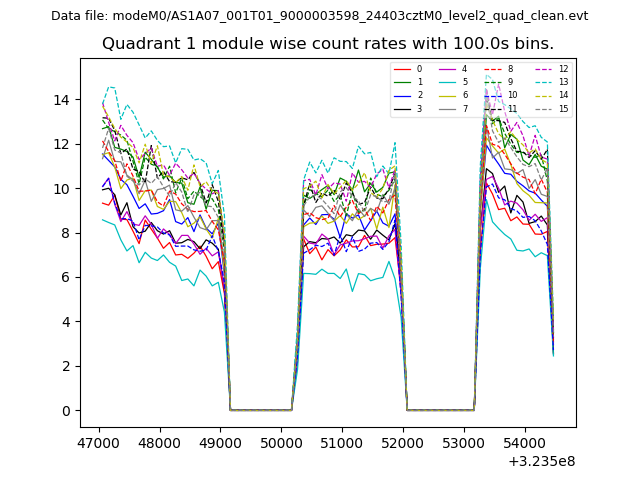
| Module-wise count rates for Quadrant A Data is divided into 100 sec bins |
 |
 |
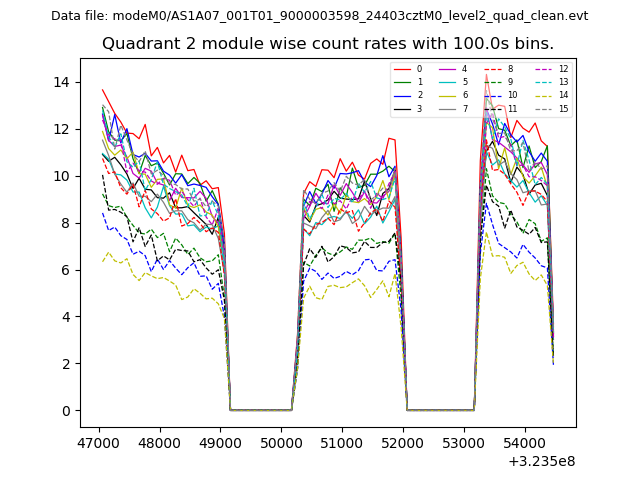
| Module-wise count rates for Quadrant B Data is divided into 100 sec bins |
 |
 |
| Module-wise count rates for Quadrant C Data is divided into 100 sec bins |
 |
 |
| Module-wise count rates for Quadrant D Data is divided into 100 sec bins |
 |
 |
| Parameter | Plot |
|---|---|
| CZT HV Monitor | 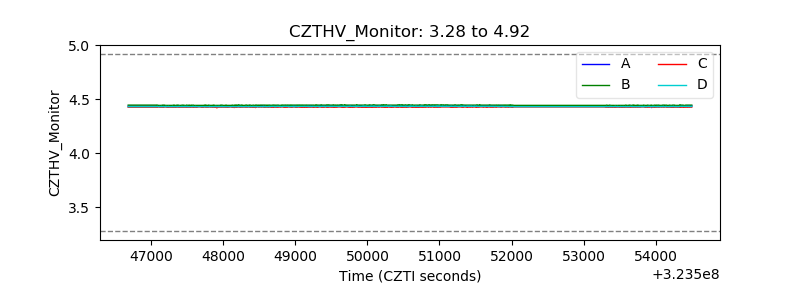 |
| D_VDD | 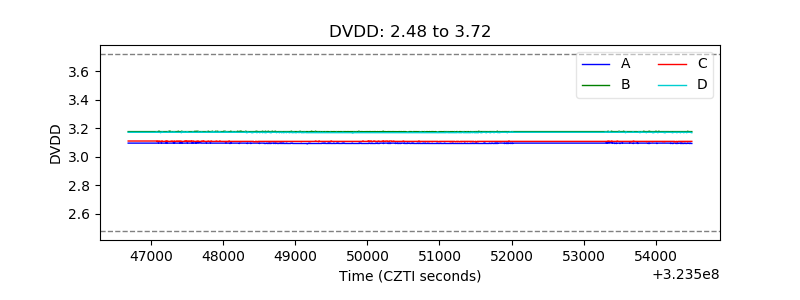 |
| Temperature 1 | 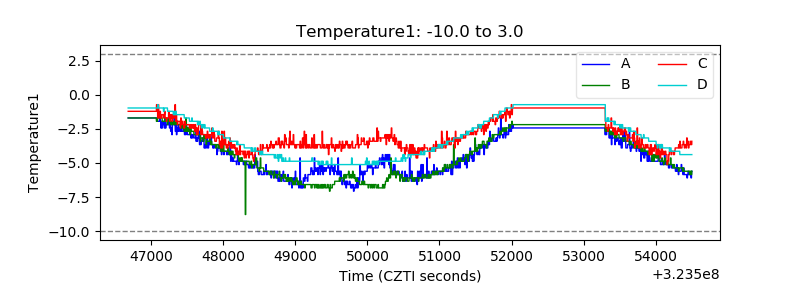 |
| Veto HV Monitor | 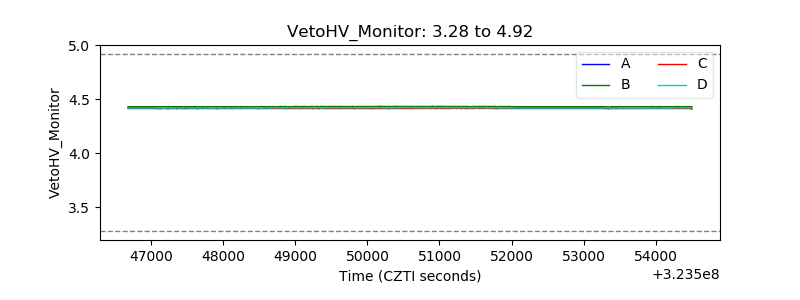 |
| Veto LLD | 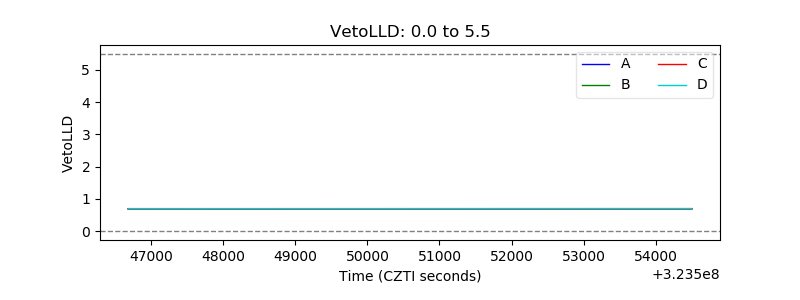 |
| Alpha Counter | 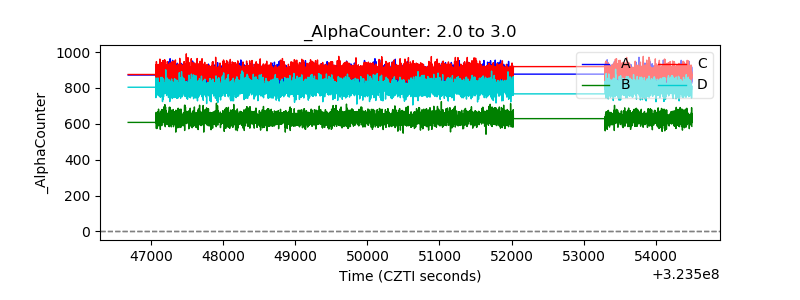 |
| _CPM_Rate | 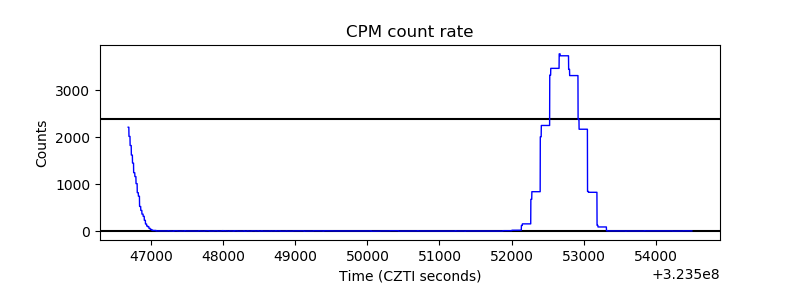 |
| CZT Counter | 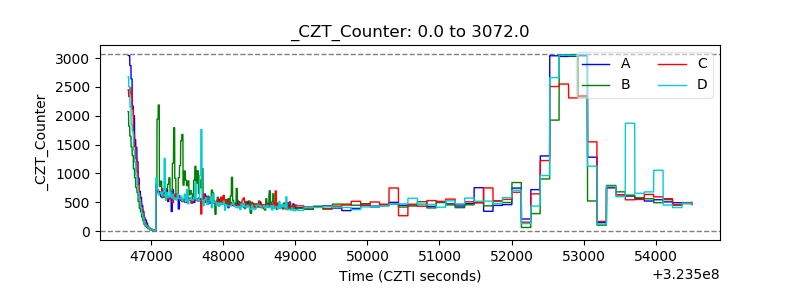 |
| +2.5 Volts monitor |  |
| +5 Volts monitor |  |
| _ROLL_ROT | 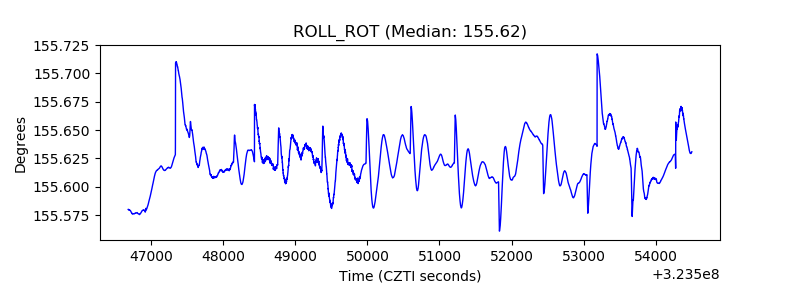 |
| _Roll_DEC | 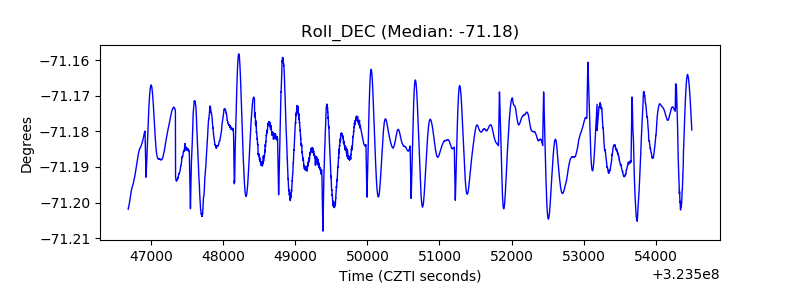 |
| _Roll_RA | 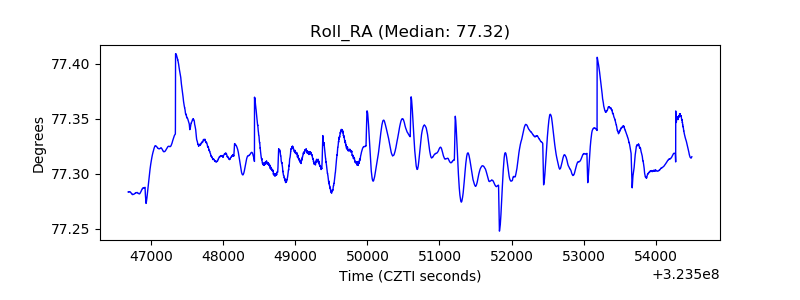 |
| Veto Counter | 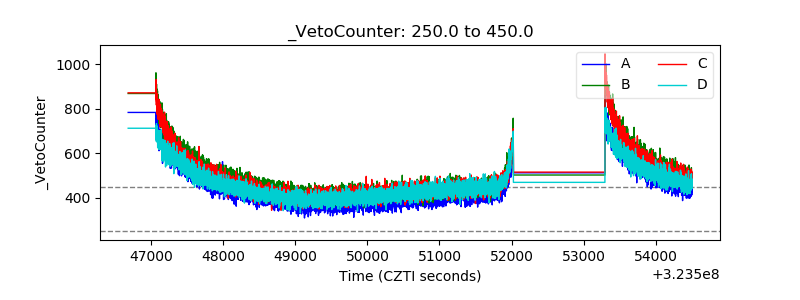 |