| Param | Original file | Final file |
|---|---|---|
| Filename | modeM0/AS1A07_001T01_9000003598_24404cztM0_level2.evt | modeM0/AS1A07_001T01_9000003598_24404cztM0_level2_quad_clean.evt |
| Size (bytes) | 99,642,240 | 29,151,360 |
| Size | 95.0 MB | 27.8 MB |
| Events in quadrant A | 658,585 | 203,275 |
| Events in quadrant B | 676,707 | 210,194 |
| Events in quadrant C | 661,993 | 193,493 |
| Events in quadrant D | 935,487 | 184,260 |
| Mode M0 | |||
|---|---|---|---|
| Quadrant | BADHDUFLAG | Total packets | Discarded packets |
| A | 0 | 2694 | 1 |
| B | 0 | 2754 | 1 |
| C | 0 | 2701 | 1 |
| D | 0 | 3618 | 1 |
| Mode M9 | |||
|---|---|---|---|
| Quadrant | BADHDUFLAG | Total packets | Discarded packets |
| A | 0 | 6 | 0 |
| B | 0 | 7 | 0 |
| C | 0 | 7 | 0 |
| D | 0 | 7 | 0 |
| Mode SS | |||
|---|---|---|---|
| Quadrant | BADHDUFLAG | Total packets | Discarded packets |
| A | 0 | 24 | 0 |
| B | 0 | 24 | 0 |
| C | 0 | 24 | 0 |
| D | 0 | 24 | 0 |
| Quadrant | Total seconds | Saturated seconds | Saturation percentage |
|---|---|---|---|
| A | 1206 | 2 | 0.165837% |
| B | 1206 | 5 | 0.414594% |
| C | 1206 | 9 | 0.746269% |
| D | 1206 | 17 | 1.409619% |
Noise dominated data is calculated using 1-second bins in cleaned event files. If a bin has >2000 counts, and if more than 50% of those come from <1% of pixels, then it is considered to be noise-dominated and hence unusable.
| Quadrant | # 1 sec bins | Bins with >0 counts | Bins with >2000 counts | High rate bins dominated by noise | Noise dominated (total time) | Noise dominated (detector-on time) | Marked lightcurve |
|---|---|---|---|---|---|---|---|
| A | 1206 | 1206 | 0 | 0 | 0.00% | 0.00% | 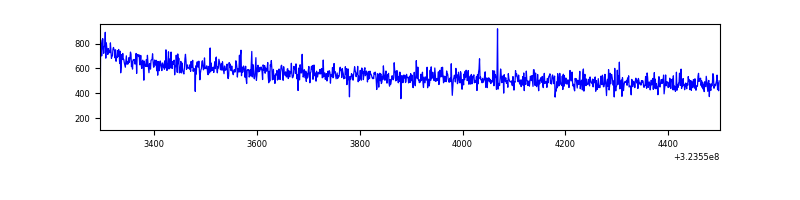 |
| B | 1206 | 1206 | 0 | 0 | 0.00% | 0.00% | 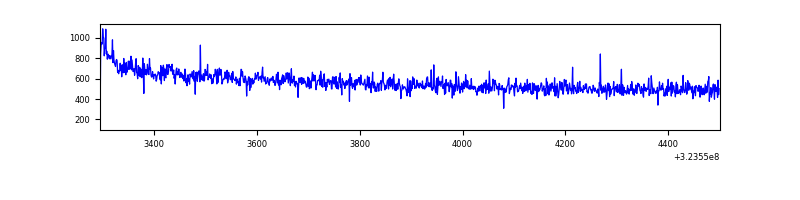 |
| C | 1206 | 1206 | 0 | 0 | 0.00% | 0.00% | 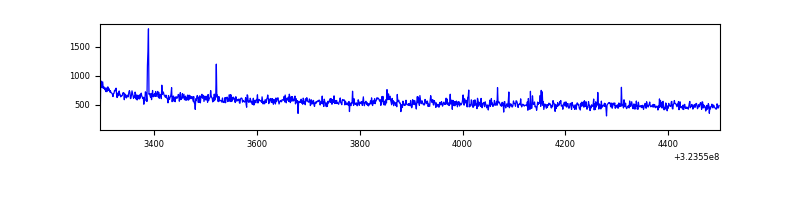 |
| D | 1206 | 1206 | 17 | 17 | 1.41% | 1.41% | 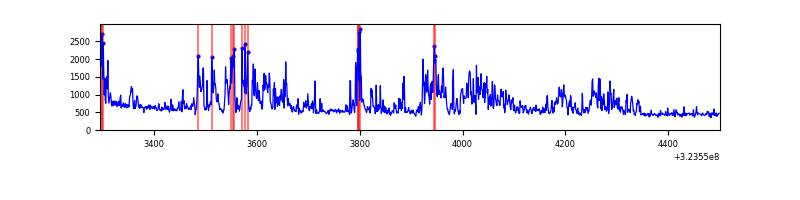 |
Top three noisy pixels from each quadrant. If the there are fewer than three noisy pixels in the level2.evt file, extra rows are filled as -1
| Pixel properties | Quadrant properties | ||||||
|---|---|---|---|---|---|---|---|
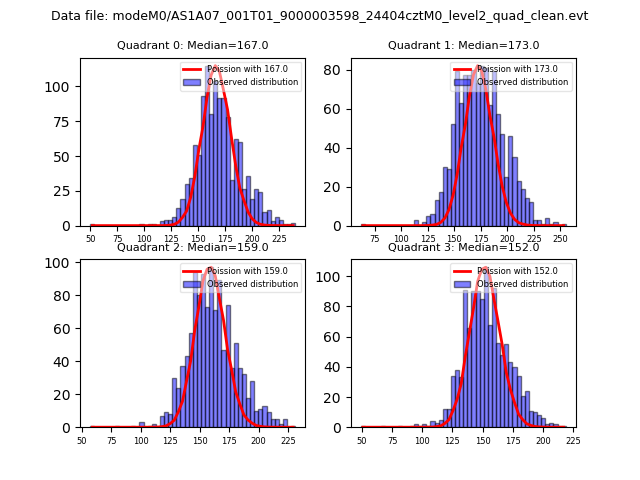
| Quadrant | DetID | PixID | Counts | Sigma | Mean | Median | Sigma |
| A | 13 | 254 | 2125 | 55.1 | 170 | 168 | 35.5 |
| A | 0 | 226 | 1515 | 37.92 | 170 | 168 | 35.5 |
| A | 3 | 137 | 1397 | 34.6 | 170 | 168 | 35.5 |
| B | 0 | 229 | 3467 | 96.47 | 172 | 168 | 34.2 |
| B | 12 | 111 | 3371 | 93.67 | 172 | 168 | 34.2 |
| B | 11 | 111 | 3134 | 86.74 | 172 | 168 | 34.2 |
| C | 14 | 238 | 26572 | 704.79 | 157 | 159 | 37.5 |
| C | 2 | 16 | 10661 | 280.23 | 157 | 159 | 37.5 |
| C | 7 | 247 | 8249 | 215.87 | 157 | 159 | 37.5 |
| D | 1 | 52 | 310545 | 7889.68 | 157 | 152 | 39.3 |
| D | 12 | 238 | 11986 | 300.8 | 157 | 152 | 39.3 |
| D | 12 | 218 | 9868 | 246.96 | 157 | 152 | 39.3 |
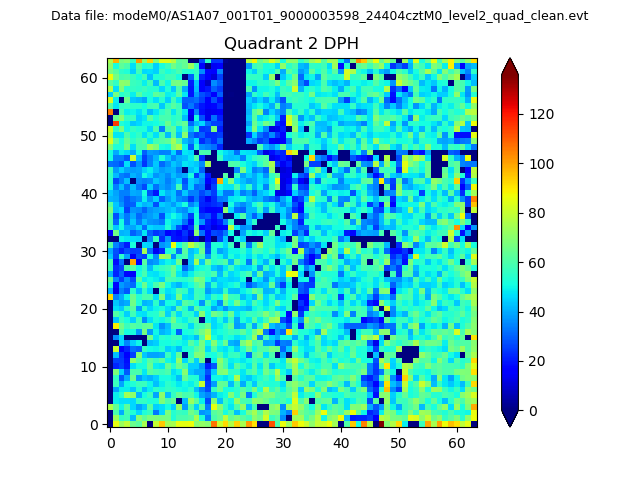
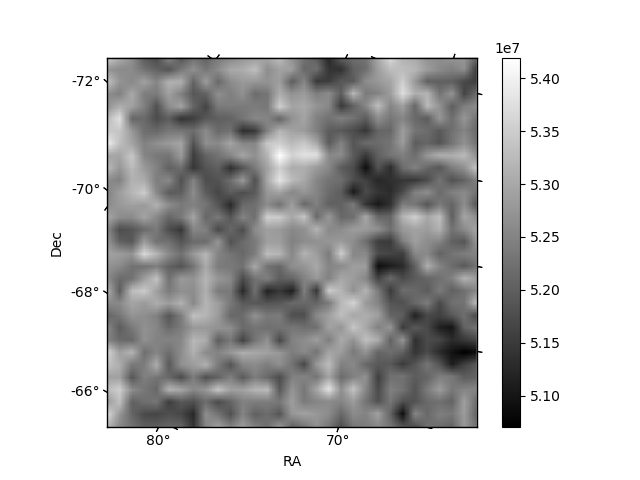
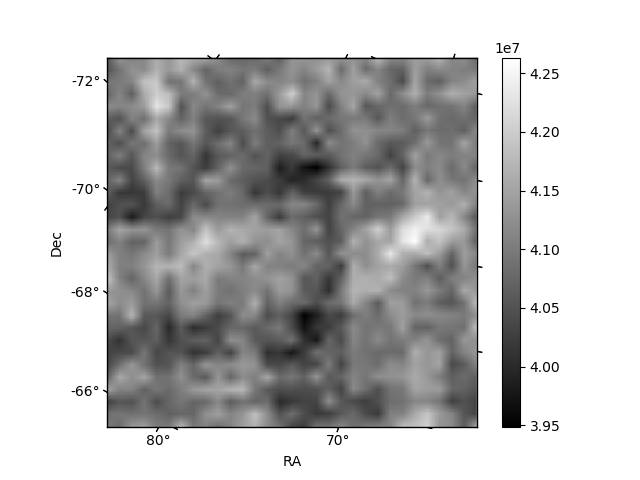
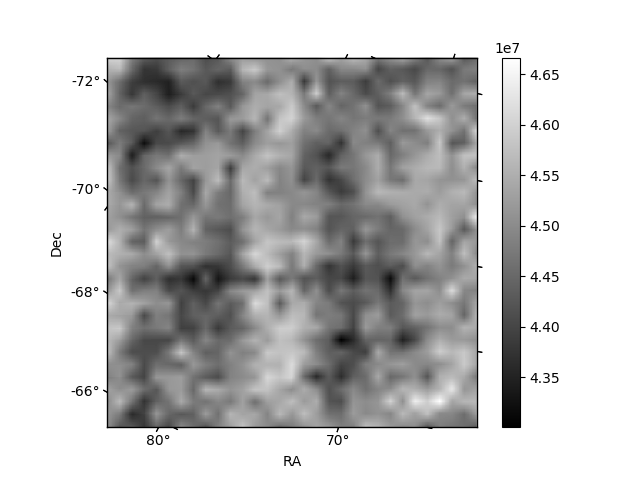
Histogram calculated using DETX and DETY for each event in the final _common_clean file
| Quadrant A | 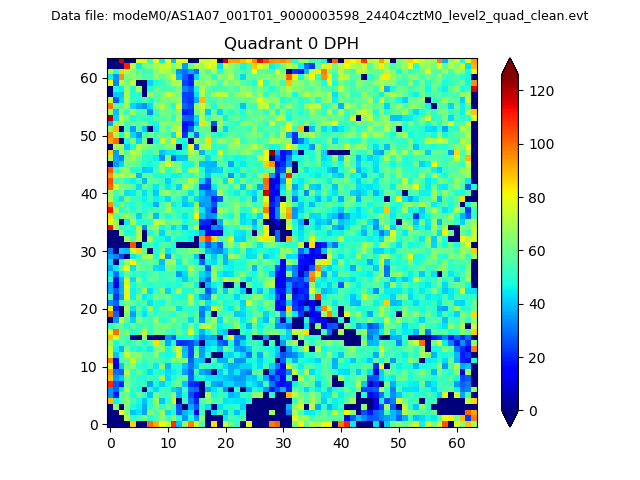 |
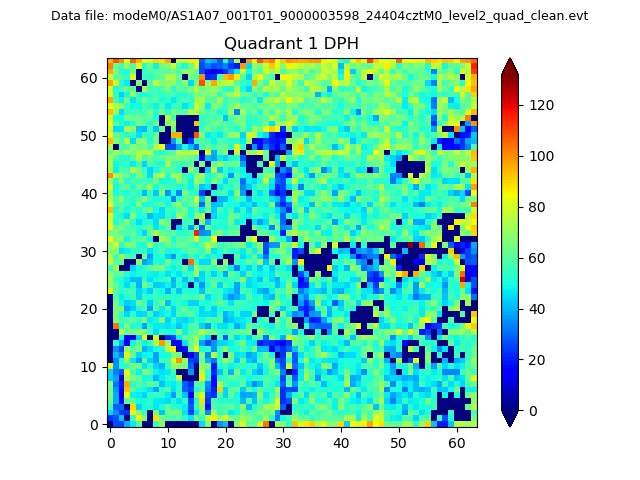 |
Quadrant B |
|---|---|---|---|
| Quadrant D | 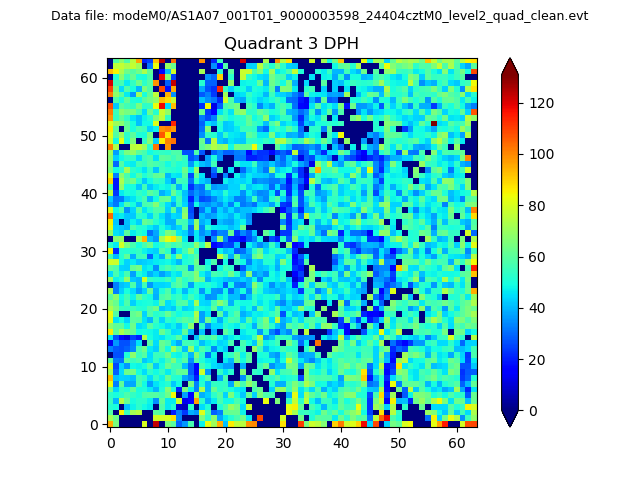 |
 |
Quadrant C |
| Plot type | Count rate plots | Images |
|---|---|---|
| Comparison with Poisson distribution Blue bars denote a histogram of data divided into 1 sec bins. Red curve is a Poisson curve with rate = median count rate of data. |
 |
 |
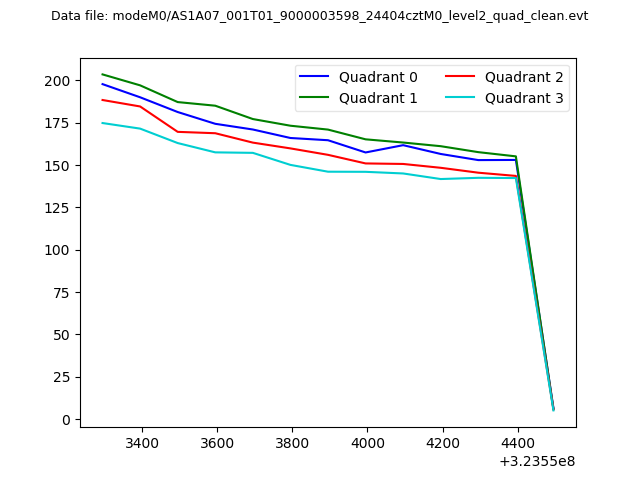
| Quadrant-wise count rates Data is divided into 100 sec bins |
 |
|
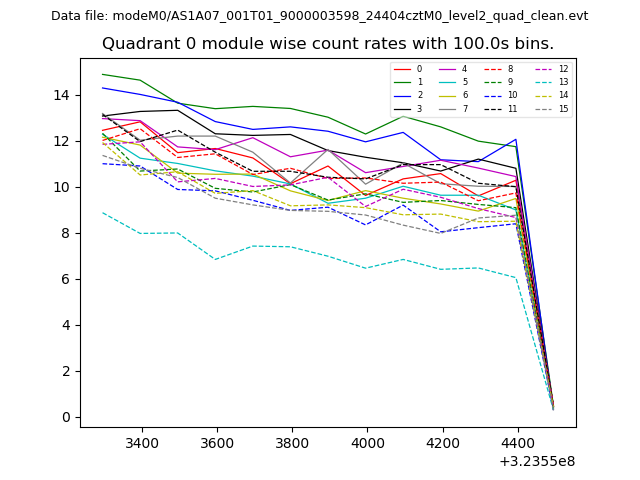
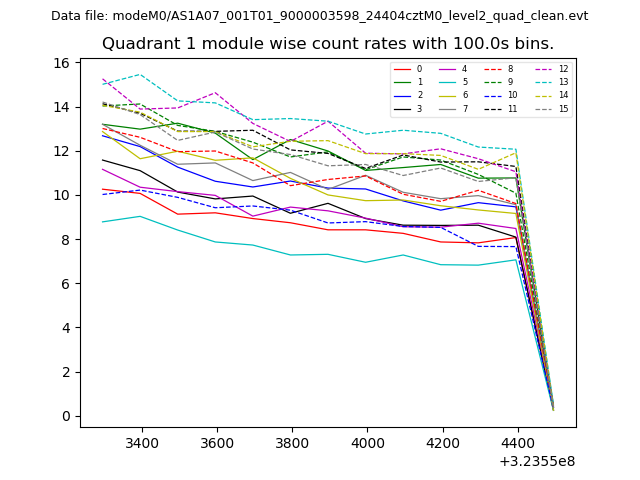
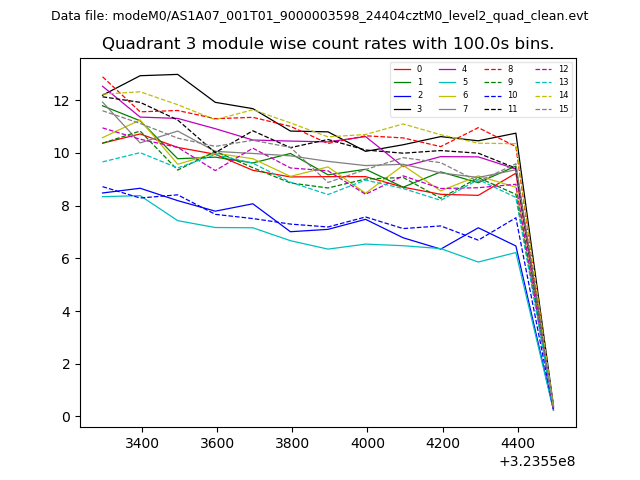
| Module-wise count rates for Quadrant A Data is divided into 100 sec bins |
 |
 |
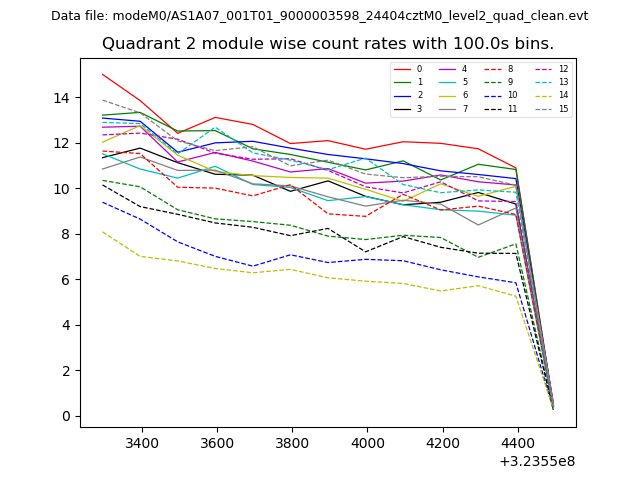
| Module-wise count rates for Quadrant B Data is divided into 100 sec bins |
 |
 |
| Module-wise count rates for Quadrant C Data is divided into 100 sec bins |
 |
 |
| Module-wise count rates for Quadrant D Data is divided into 100 sec bins |
 |
 |
| Parameter | Plot |
|---|---|
| CZT HV Monitor | 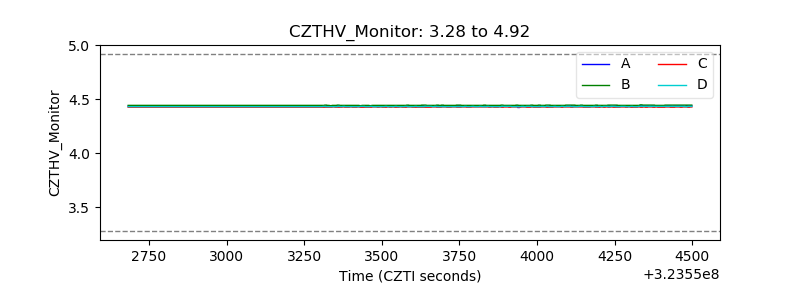 |
| D_VDD | 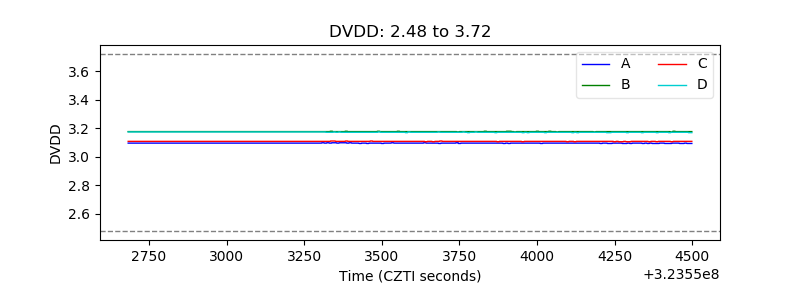 |
| Temperature 1 | 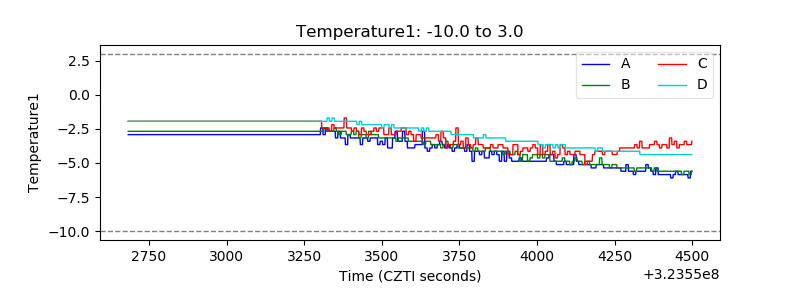 |
| Veto HV Monitor | 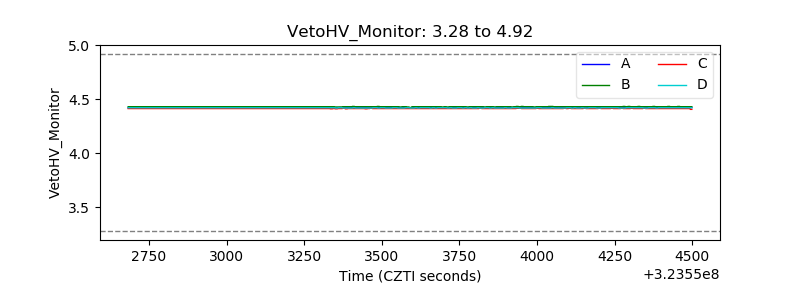 |
| Veto LLD | 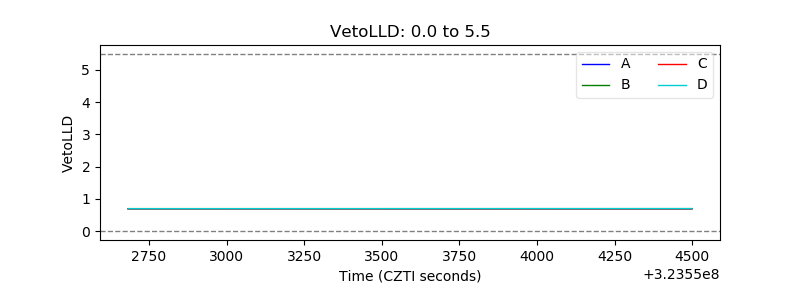 |
| Alpha Counter | 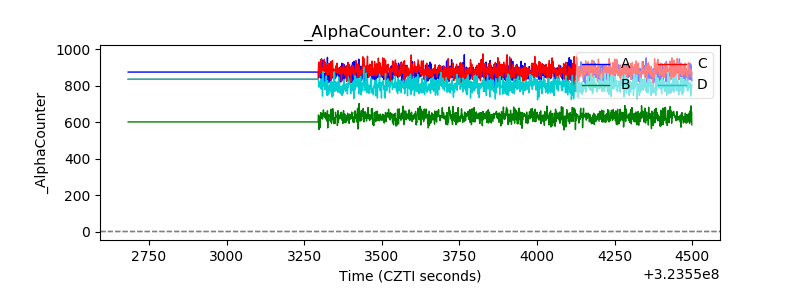 |
| _CPM_Rate | 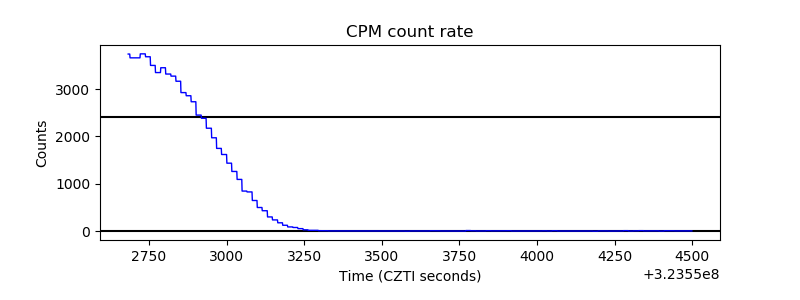 |
| CZT Counter |  |
| +2.5 Volts monitor |  |
| +5 Volts monitor |  |
| _ROLL_ROT | 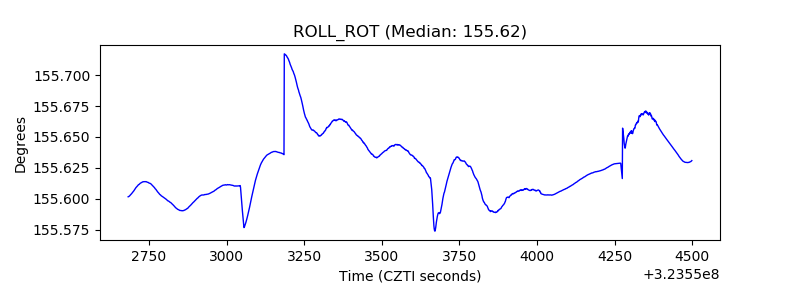 |
| _Roll_DEC | 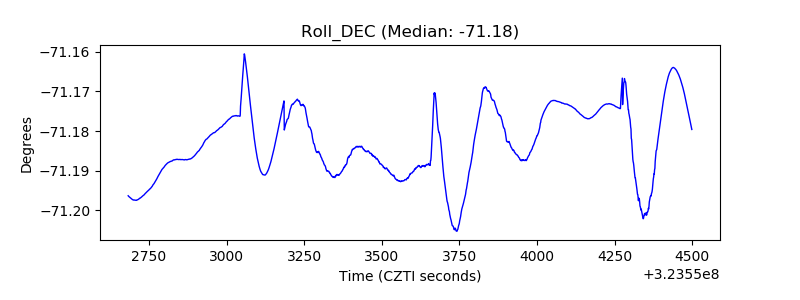 |
| _Roll_RA |  |
| Veto Counter | 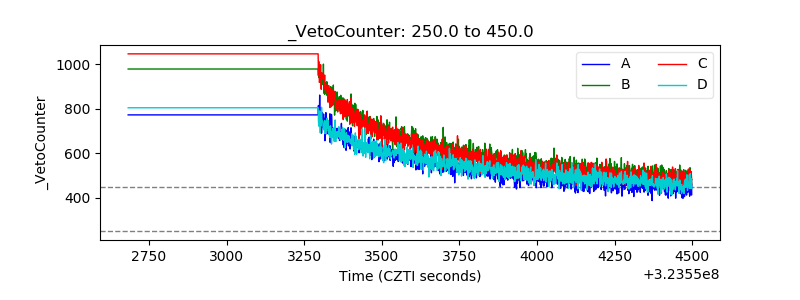 |