| Param | Original file | Final file |
|---|---|---|
| Filename | modeM0/AS1A07_001T02_9000003600cztM0_level2.fits | modeM0/AS1A07_001T02_9000003600cztM0_level2_quad_clean.evt |
| Size (bytes) | 347,152,320 | 383,958,720 |
| Size | 331.1 MB | 366.2 MB |
| Events in quadrant A | 2,146,530 | 2,403,254 |
| Events in quadrant B | 2,057,550 | 2,426,431 |
| Events in quadrant C | 2,075,122 | 2,294,907 |
| Events in quadrant D | 1,816,854 | 2,086,589 |
| Mode M9 | |||
|---|---|---|---|
| Quadrant | BADHDUFLAG | Total packets | Discarded packets |
| A | 0 | 52 | 0 |
| B | 0 | 52 | 0 |
| C | 0 | 52 | 0 |
| D | 0 | 52 | 0 |
| Mode M0 | |||
|---|---|---|---|
| Quadrant | BADHDUFLAG | Total packets | Discarded packets |
| A | 0 | 72094 | 0 |
| B | 0 | 73072 | 0 |
| C | 0 | 72668 | 0 |
| D | 0 | 83549 | 0 |
| Mode SS | |||
|---|---|---|---|
| Quadrant | BADHDUFLAG | Total packets | Discarded packets |
| A | 0 | 718 | 0 |
| B | 0 | 718 | 0 |
| C | 0 | 718 | 0 |
| D | 0 | 718 | 0 |
| Quadrant | Total seconds | Saturated seconds | Saturation percentage |
|---|---|---|---|
| A | 35192 | 373 | 1.059900% |
| B | 35192 | 538 | 1.528757% |
| C | 35192 | 632 | 1.795863% |
| D | 35192 | 786 | 2.233462% |
Noise dominated data is calculated using 1-second bins in cleaned event files. If a bin has >2000 counts, and if more than 50% of those come from <1% of pixels, then it is considered to be noise-dominated and hence unusable.
| Quadrant | # 1 sec bins | Bins with >0 counts | Bins with >2000 counts | High rate bins dominated by noise | Noise dominated (total time) | Noise dominated (detector-on time) | Marked lightcurve |
|---|---|---|---|---|---|---|---|
| A | 40402 | 35193 | 0 | 0 | 0.00% | 0.00% |  |
| B | 40402 | 35192 | 0 | 0 | 0.00% | 0.00% |  |
| C | 40402 | 35192 | 0 | 0 | 0.00% | 0.00% | 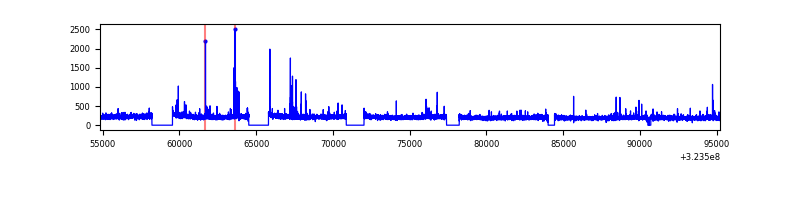 |
| D | 40402 | 35193 | 0 | 0 | 0.00% | 0.00% |  |
Top three noisy pixels from each quadrant. If the there are fewer than three noisy pixels in the level2.evt file, extra rows are filled as -1
| Pixel properties | Quadrant properties | ||||||
|---|---|---|---|---|---|---|---|
| Quadrant | DetID | PixID | Counts | Sigma | Mean | Median | Sigma |
| A | 0 | 29 | 2025 | 10.76 | 558 | 526 | 139.3 |
| A | 7 | 110 | 1774 | 8.96 | 558 | 526 | 139.3 |
| A | 0 | 30 | 1642 | 8.01 | 558 | 526 | 139.3 |
| B | 2 | 9 | 1673 | 10.9 | 543 | 521 | 105.7 |
| B | 5 | 255 | 1389 | 8.21 | 543 | 521 | 105.7 |
| B | 3 | 17 | 1382 | 8.15 | 543 | 521 | 105.7 |
| C | 12 | 241 | 1476 | 6.93 | 548 | 515 | 138.6 |
| C | 9 | 209 | 1401 | 6.39 | 548 | 515 | 138.6 |
| C | 7 | 111 | 1387 | 6.29 | 548 | 515 | 138.6 |
| D | 3 | 14 | 1384 | 6.59 | 517 | 473 | 138.1 |
| D | 4 | 246 | 1362 | 6.44 | 517 | 473 | 138.1 |
| D | 6 | 231 | 1316 | 6.1 | 517 | 473 | 138.1 |
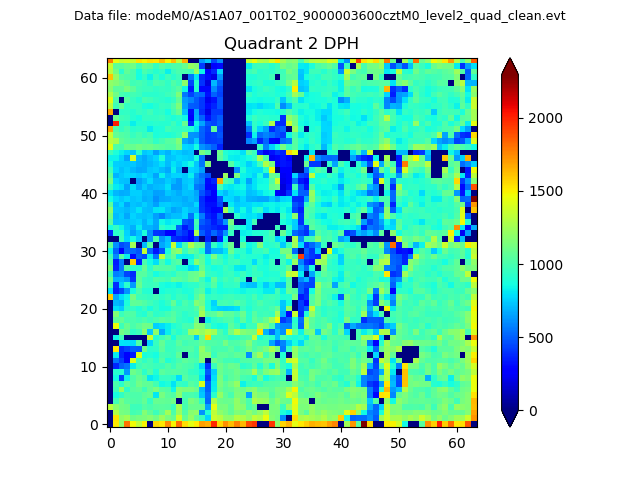
Histogram calculated using DETX and DETY for each event in the final _common_clean file
| Quadrant A | 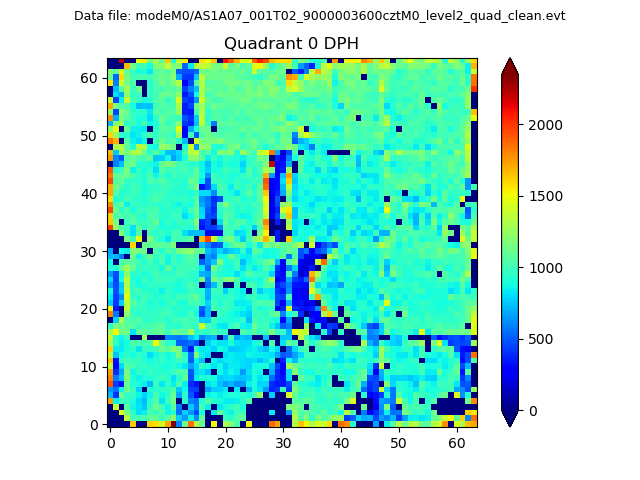 |
 |
Quadrant B |
|---|---|---|---|
| Quadrant D |  |
 |
Quadrant C |
| Plot type | Count rate plots | Images |
|---|---|---|
| Comparison with Poisson distribution Blue bars denote a histogram of data divided into 1 sec bins. Red curve is a Poisson curve with rate = median count rate of data. |
 |
 |
| Quadrant-wise count rates Data is divided into 100 sec bins |
 |
|
| Module-wise count rates for Quadrant A Data is divided into 100 sec bins |
 |
 |
| Module-wise count rates for Quadrant B Data is divided into 100 sec bins |
 |
 |
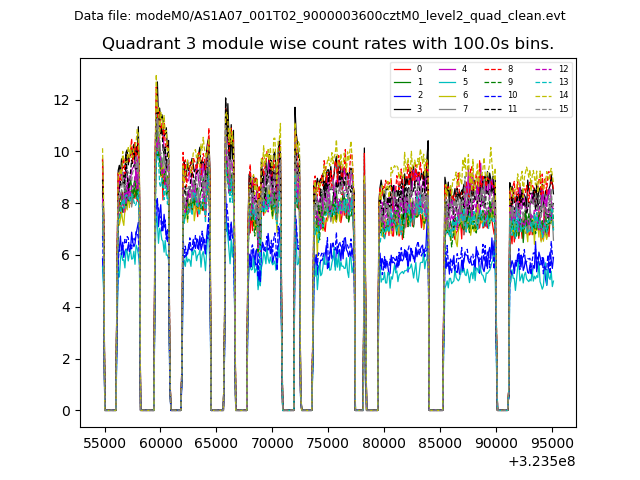
| Module-wise count rates for Quadrant C Data is divided into 100 sec bins |
 |
 |
| Module-wise count rates for Quadrant D Data is divided into 100 sec bins |
 |
 |
| Parameter | Plot |
|---|---|
| CZT HV Monitor |  |
| D_VDD |  |
| Temperature 1 |  |
| Veto HV Monitor |  |
| Veto LLD |  |
| Alpha Counter | 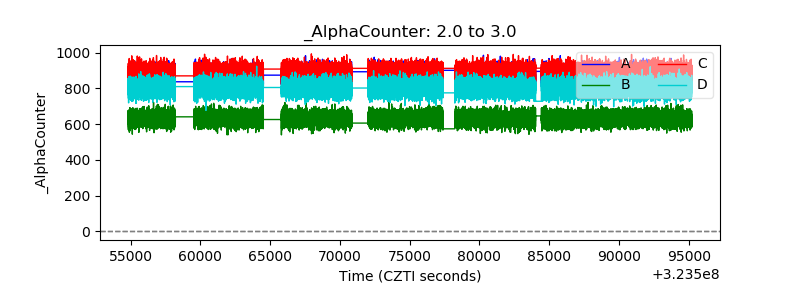 |
| _CPM_Rate | 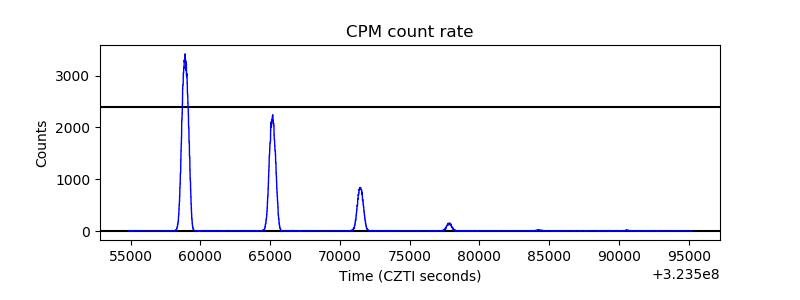 |
| CZT Counter |  |
| +2.5 Volts monitor | 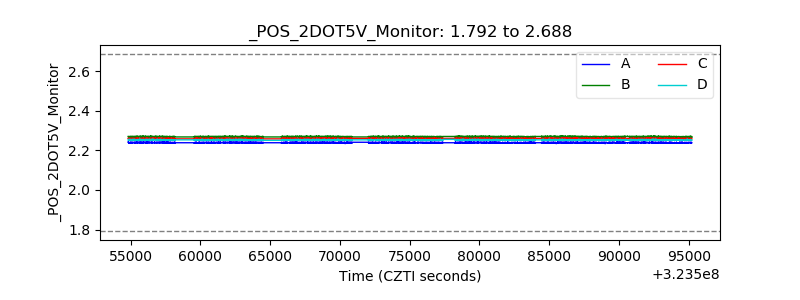 |
| +5 Volts monitor |  |
| _ROLL_ROT | 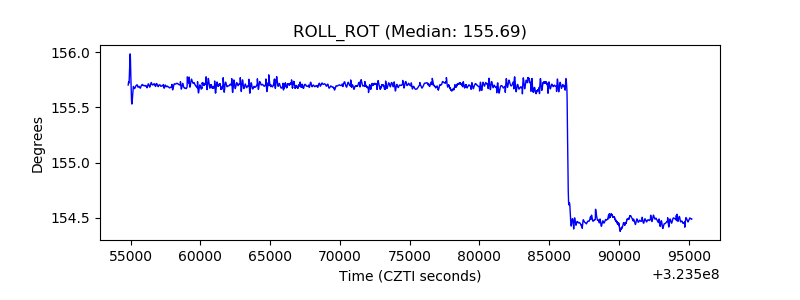 |
| _Roll_DEC |  |
| _Roll_RA | 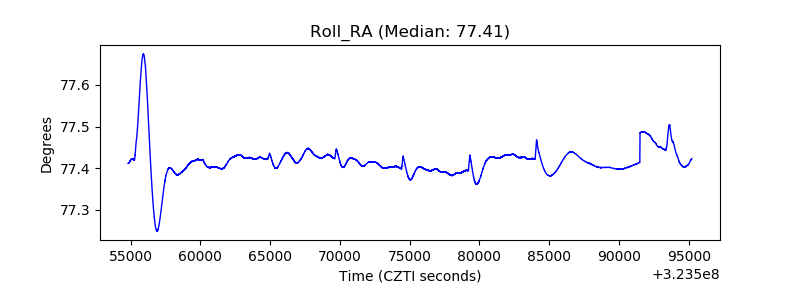 |
| Veto Counter |  |