| Param | Original file | Final file |
|---|---|---|
| Filename | modeM0/AS1A07_001T02_9000003600_24404cztM0_level2.evt | modeM0/AS1A07_001T02_9000003600_24404cztM0_level2_quad_clean.evt |
| Size (bytes) | 326,592,000 | 79,341,120 |
| Size | 311.5 MB | 75.7 MB |
| Events in quadrant A | 2,318,359 | 527,404 |
| Events in quadrant B | 2,370,093 | 541,529 |
| Events in quadrant C | 2,417,386 | 508,026 |
| Events in quadrant D | 2,463,055 | 493,966 |
| Mode M9 | |||
|---|---|---|---|
| Quadrant | BADHDUFLAG | Total packets | Discarded packets |
| A | 0 | 13 | 0 |
| B | 0 | 13 | 0 |
| C | 0 | 13 | 0 |
| D | 0 | 13 | 0 |
| Mode M0 | |||
|---|---|---|---|
| Quadrant | BADHDUFLAG | Total packets | Discarded packets |
| A | 0 | 9816 | 1 |
| B | 0 | 9867 | 1 |
| C | 0 | 9920 | 1 |
| D | 0 | 10336 | 2 |
| Mode SS | |||
|---|---|---|---|
| Quadrant | BADHDUFLAG | Total packets | Discarded packets |
| A | 0 | 98 | 0 |
| B | 0 | 98 | 0 |
| C | 0 | 98 | 0 |
| D | 0 | 96 | 0 |
| Quadrant | Total seconds | Saturated seconds | Saturation percentage |
|---|---|---|---|
| A | 4720 | 15 | 0.317797% |
| B | 4720 | 17 | 0.360169% |
| C | 4720 | 41 | 0.868644% |
| D | 4719 | 25 | 0.529773% |
Noise dominated data is calculated using 1-second bins in cleaned event files. If a bin has >2000 counts, and if more than 50% of those come from <1% of pixels, then it is considered to be noise-dominated and hence unusable.
| Quadrant | # 1 sec bins | Bins with >0 counts | Bins with >2000 counts | High rate bins dominated by noise | Noise dominated (total time) | Noise dominated (detector-on time) | Marked lightcurve |
|---|---|---|---|---|---|---|---|
| A | 6060 | 4721 | 0 | 0 | 0.00% | 0.00% | 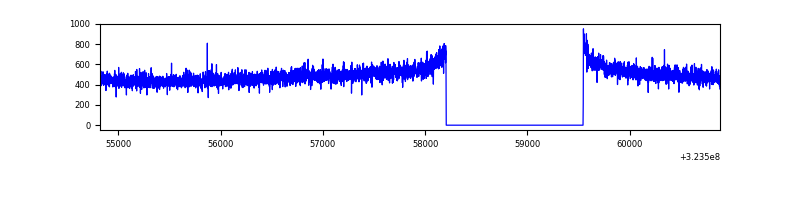 |
| B | 6060 | 4721 | 1 | 1 | 0.02% | 0.02% | 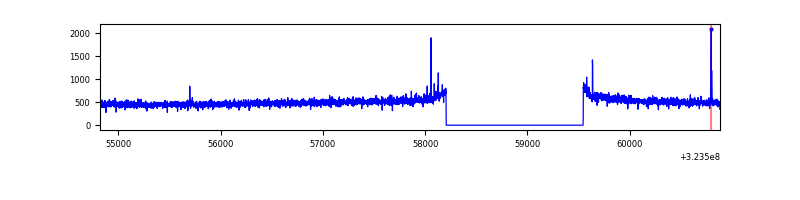 |
| C | 6060 | 4721 | 0 | 0 | 0.00% | 0.00% | 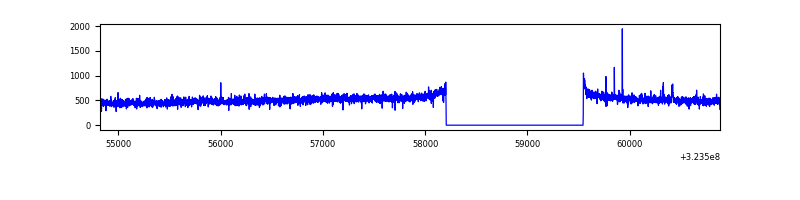 |
| D | 6059 | 4720 | 10 | 10 | 0.17% | 0.21% | 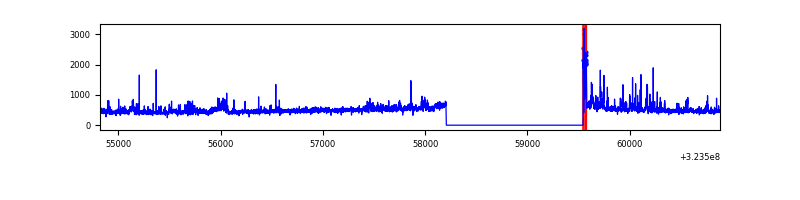 |
Top three noisy pixels from each quadrant. If the there are fewer than three noisy pixels in the level2.evt file, extra rows are filled as -1
| Pixel properties | Quadrant properties | ||||||
|---|---|---|---|---|---|---|---|
| Quadrant | DetID | PixID | Counts | Sigma | Mean | Median | Sigma |
| A | 13 | 254 | 6997 | 53.21 | 601 | 589 | 120.4 |
| A | 0 | 226 | 5105 | 37.5 | 601 | 589 | 120.4 |
| A | 3 | 137 | 5072 | 37.22 | 601 | 589 | 120.4 |
| B | 12 | 111 | 12913 | 109.58 | 603 | 589 | 112.5 |
| B | 11 | 111 | 11960 | 101.11 | 603 | 589 | 112.5 |
| B | 14 | 111 | 10426 | 87.47 | 603 | 589 | 112.5 |
| C | 14 | 238 | 95390 | 719.38 | 575 | 580 | 131.8 |
| C | 7 | 247 | 63447 | 477.01 | 575 | 580 | 131.8 |
| C | 2 | 16 | 12994 | 94.19 | 575 | 580 | 131.8 |
| D | 1 | 52 | 178752 | 1279.54 | 576 | 560 | 139.3 |
| D | 12 | 218 | 56491 | 401.62 | 576 | 560 | 139.3 |
| D | 2 | 234 | 20561 | 143.62 | 576 | 560 | 139.3 |
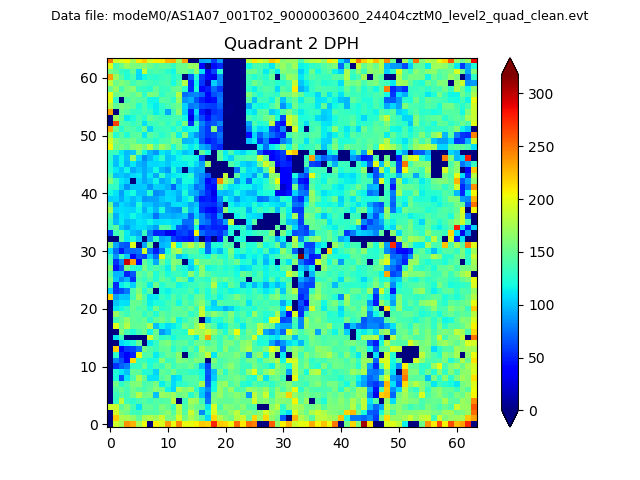
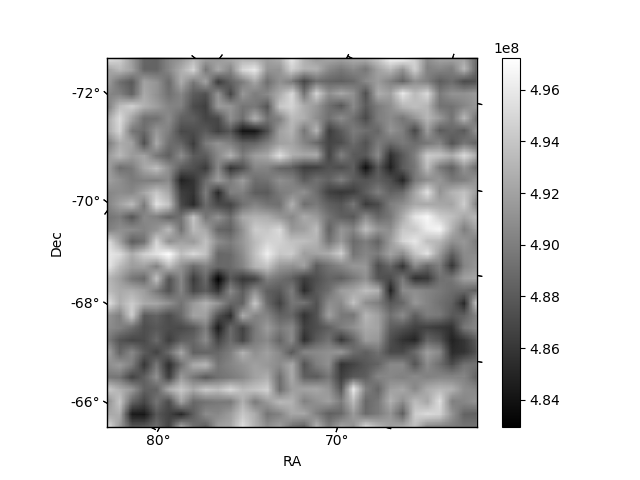
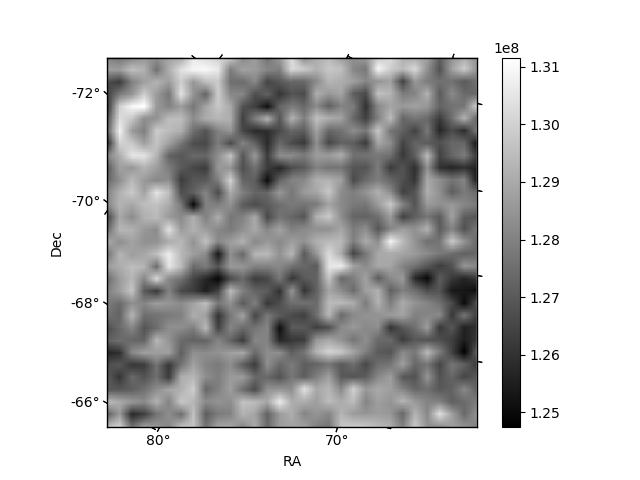
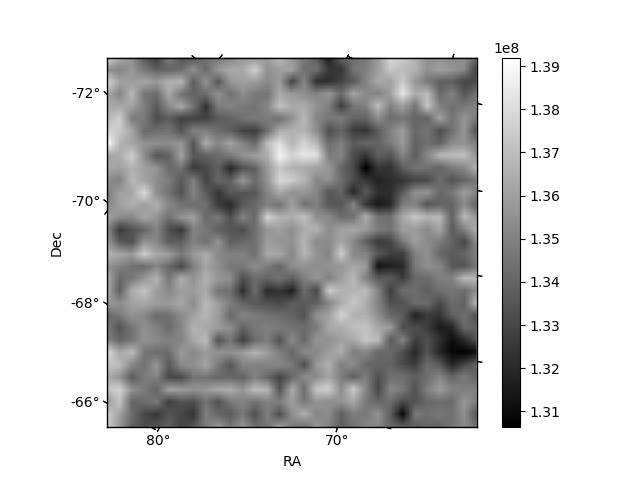
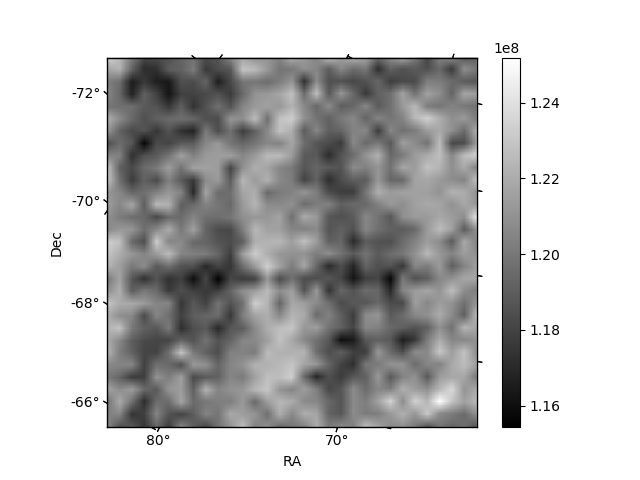
Histogram calculated using DETX and DETY for each event in the final _common_clean file
| Quadrant A | 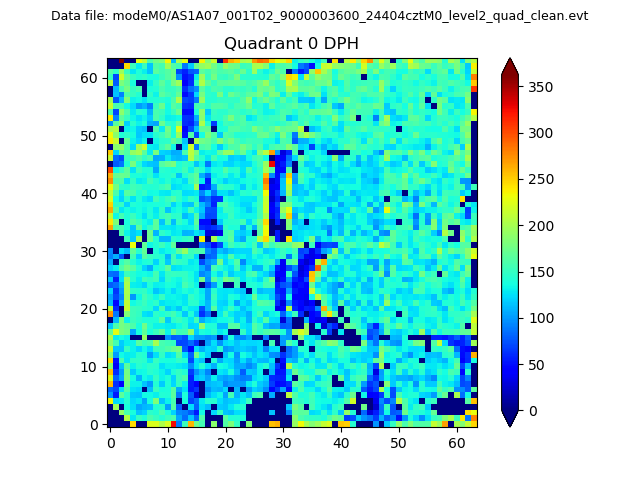 |
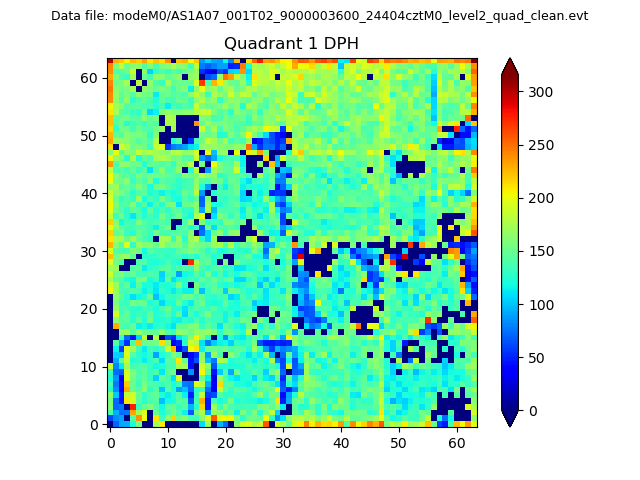 |
Quadrant B |
|---|---|---|---|
| Quadrant D | 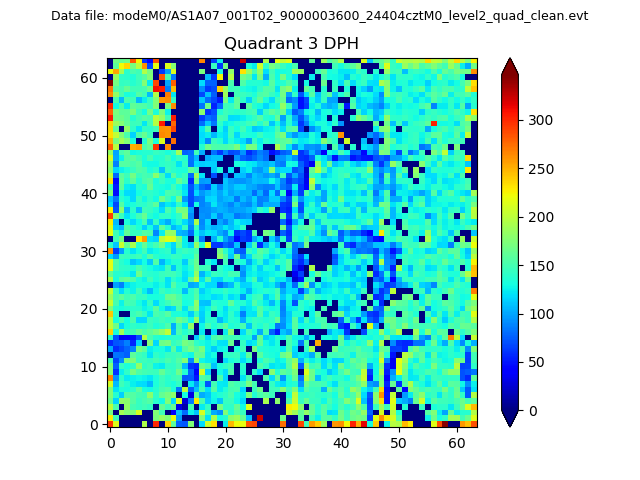 |
 |
Quadrant C |
| Plot type | Count rate plots | Images |
|---|---|---|
| Comparison with Poisson distribution Blue bars denote a histogram of data divided into 1 sec bins. Red curve is a Poisson curve with rate = median count rate of data. |
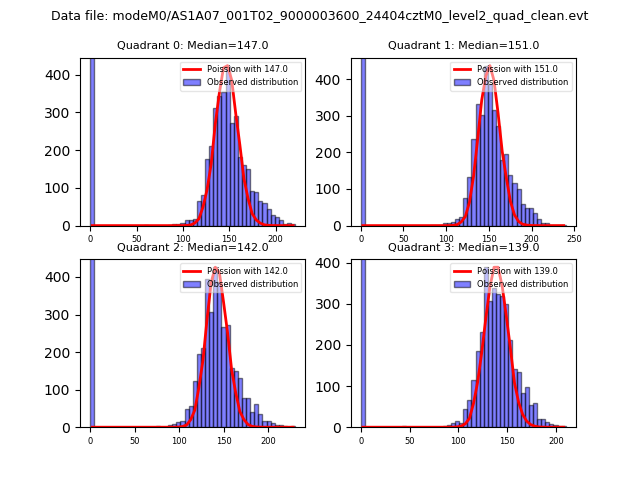 |
 |
| Quadrant-wise count rates Data is divided into 100 sec bins |
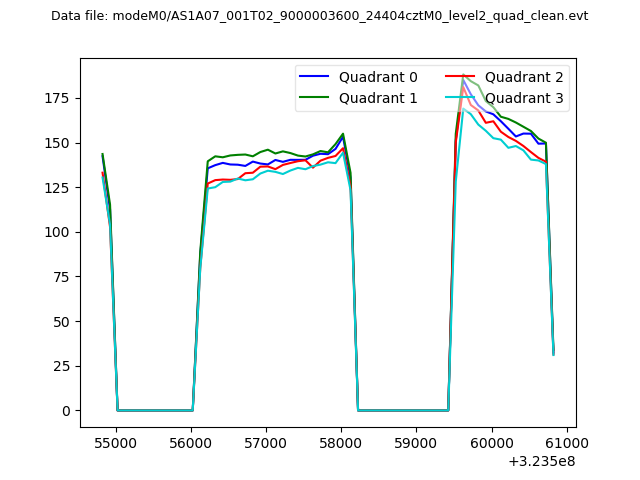 |
|
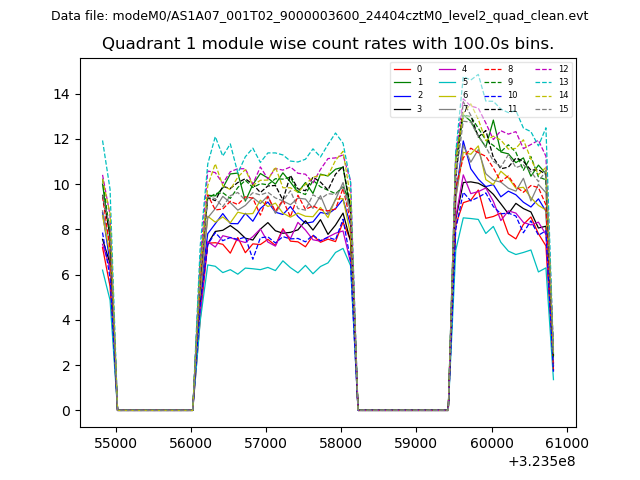
| Module-wise count rates for Quadrant A Data is divided into 100 sec bins |
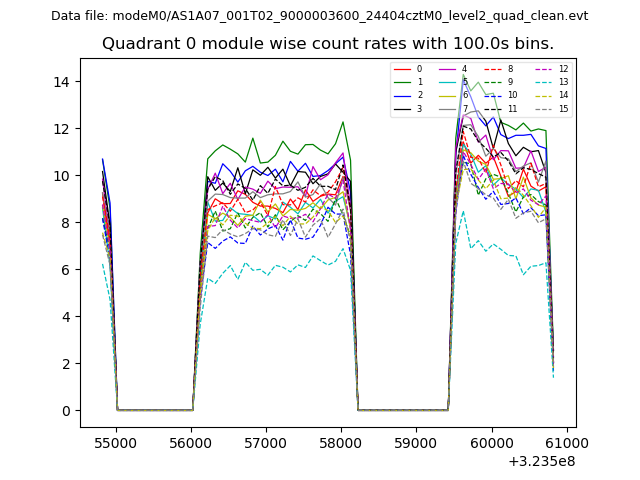 |
 |
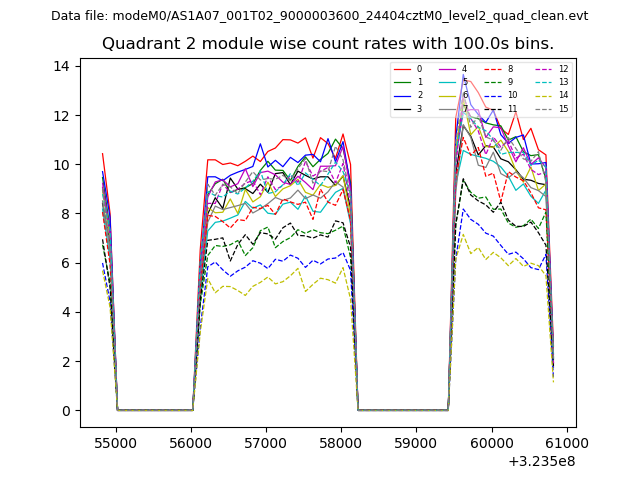
| Module-wise count rates for Quadrant B Data is divided into 100 sec bins |
 |
 |
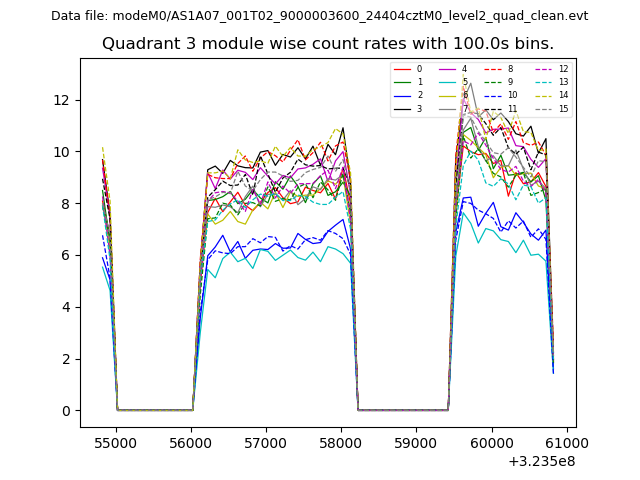
| Module-wise count rates for Quadrant C Data is divided into 100 sec bins |
 |
 |
| Module-wise count rates for Quadrant D Data is divided into 100 sec bins |
 |
 |
| Parameter | Plot |
|---|---|
| CZT HV Monitor | 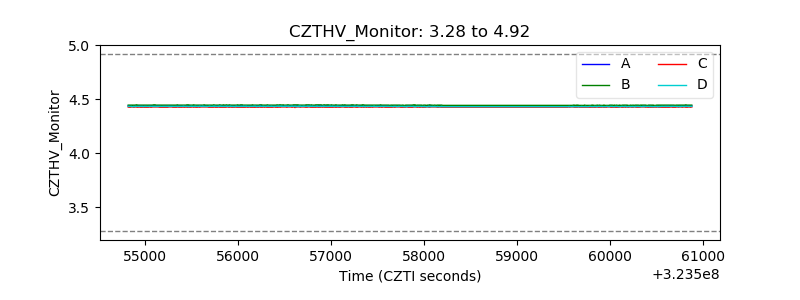 |
| D_VDD | 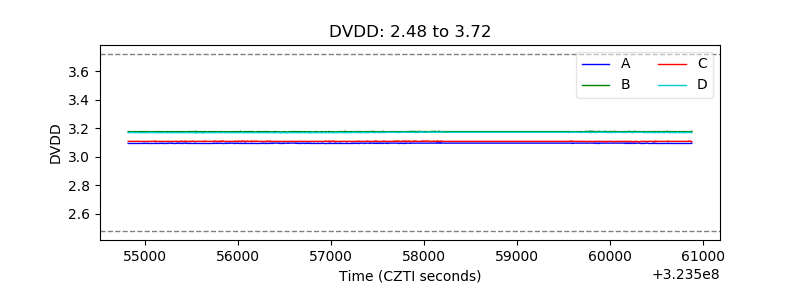 |
| Temperature 1 |  |
| Veto HV Monitor | 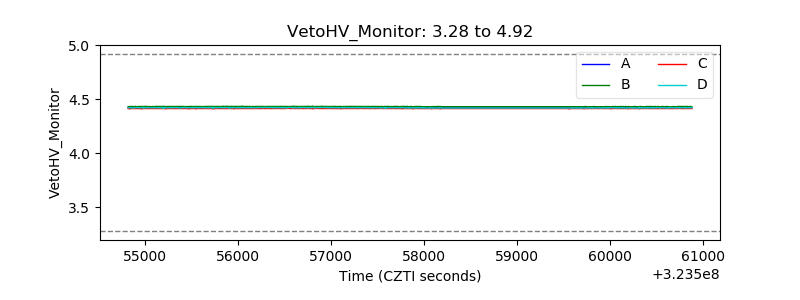 |
| Veto LLD | 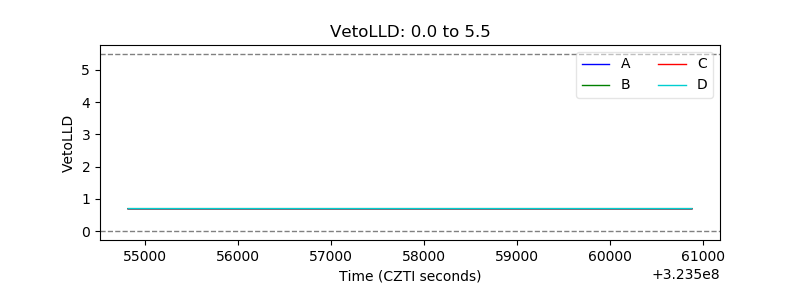 |
| Alpha Counter | 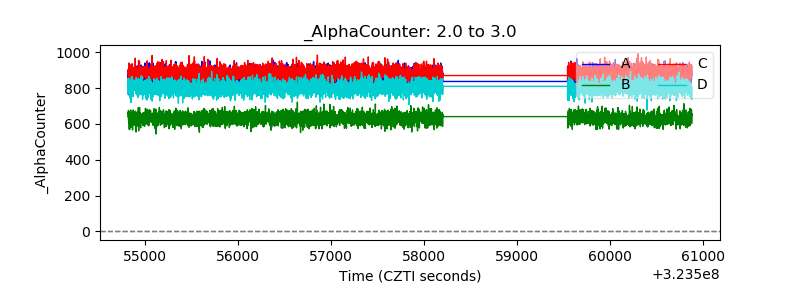 |
| _CPM_Rate | 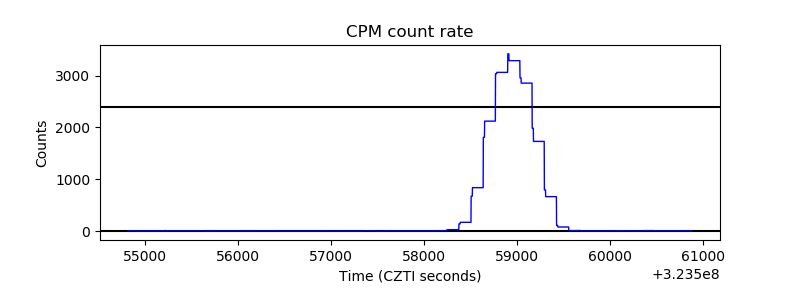 |
| CZT Counter | 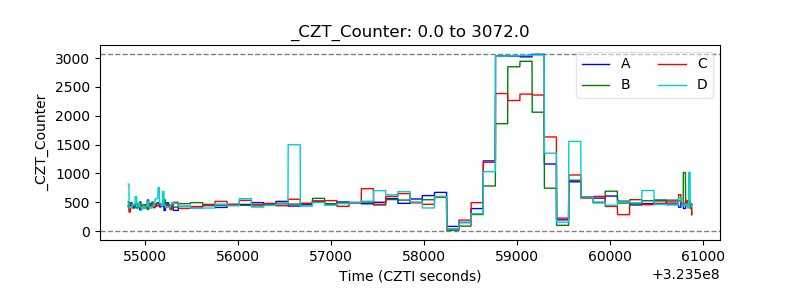 |
| +2.5 Volts monitor |  |
| +5 Volts monitor |  |
| _ROLL_ROT | 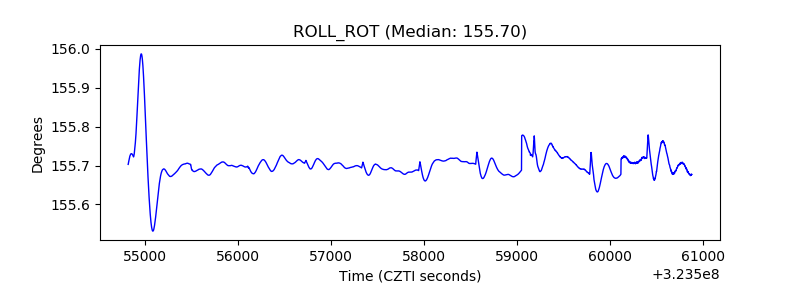 |
| _Roll_DEC |  |
| _Roll_RA | 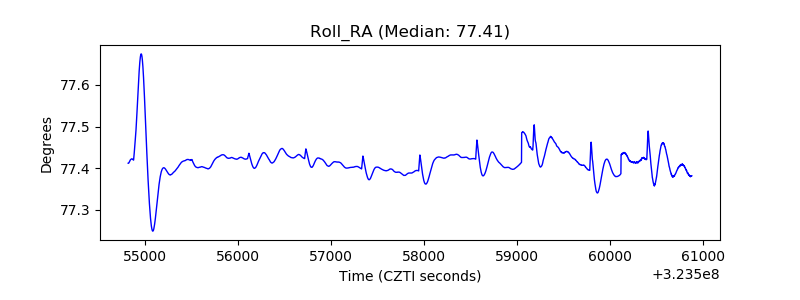 |
| Veto Counter | 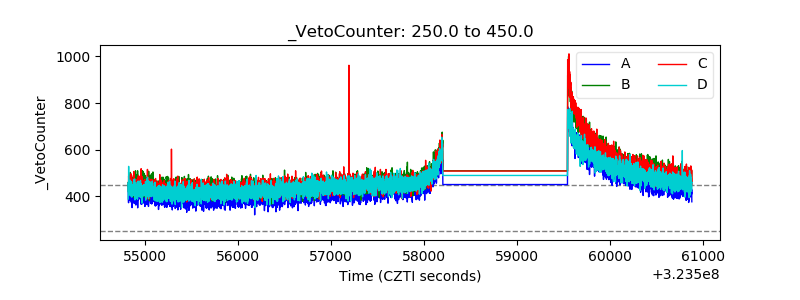 |