| Param | Original file | Final file |
|---|---|---|
| Filename | modeM0/AS1A07_001T02_9000003600_24405cztM0_level2.evt | modeM0/AS1A07_001T02_9000003600_24405cztM0_level2_quad_clean.evt |
| Size (bytes) | 460,765,440 | 106,142,400 |
| Size | 439.4 MB | 101.2 MB |
| Events in quadrant A | 3,107,334 | 706,677 |
| Events in quadrant B | 3,232,012 | 726,027 |
| Events in quadrant C | 3,247,728 | 685,370 |
| Events in quadrant D | 3,939,999 | 657,488 |
| Mode M9 | |||
|---|---|---|---|
| Quadrant | BADHDUFLAG | Total packets | Discarded packets |
| A | 0 | 22 | 0 |
| B | 0 | 23 | 0 |
| C | 0 | 23 | 0 |
| D | 0 | 23 | 0 |
| Mode M0 | |||
|---|---|---|---|
| Quadrant | BADHDUFLAG | Total packets | Discarded packets |
| A | 0 | 13080 | 2 |
| B | 0 | 13342 | 2 |
| C | 0 | 13317 | 2 |
| D | 0 | 15929 | 3 |
| Mode SS | |||
|---|---|---|---|
| Quadrant | BADHDUFLAG | Total packets | Discarded packets |
| A | 0 | 128 | 0 |
| B | 0 | 128 | 0 |
| C | 0 | 128 | 0 |
| D | 0 | 128 | 0 |
| Quadrant | Total seconds | Saturated seconds | Saturation percentage |
|---|---|---|---|
| A | 6290 | 34 | 0.540541% |
| B | 6290 | 74 | 1.176471% |
| C | 6290 | 75 | 1.192369% |
| D | 6289 | 129 | 2.051201% |
Noise dominated data is calculated using 1-second bins in cleaned event files. If a bin has >2000 counts, and if more than 50% of those come from <1% of pixels, then it is considered to be noise-dominated and hence unusable.
| Quadrant | # 1 sec bins | Bins with >0 counts | Bins with >2000 counts | High rate bins dominated by noise | Noise dominated (total time) | Noise dominated (detector-on time) | Marked lightcurve |
|---|---|---|---|---|---|---|---|
| A | 7575 | 6291 | 0 | 0 | 0.00% | 0.00% | 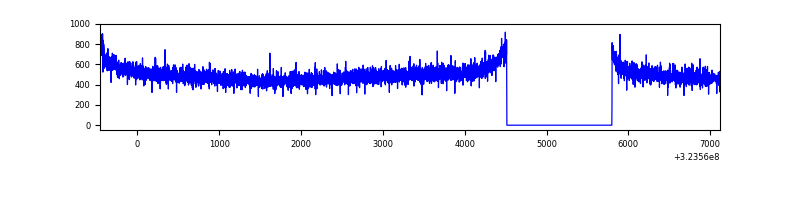 |
| B | 7575 | 6291 | 7 | 7 | 0.09% | 0.11% | 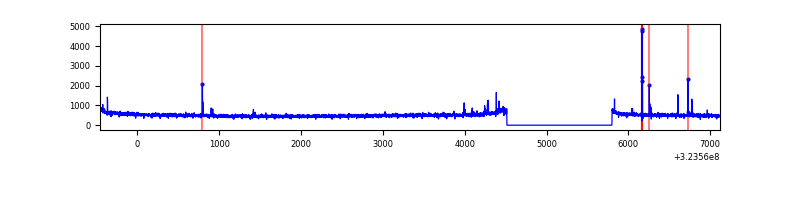 |
| C | 7575 | 6291 | 4 | 4 | 0.05% | 0.06% | 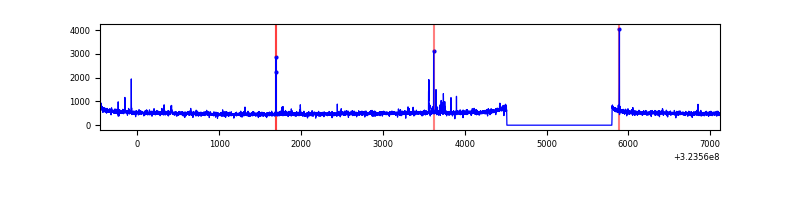 |
| D | 7574 | 6290 | 52 | 52 | 0.69% | 0.83% | 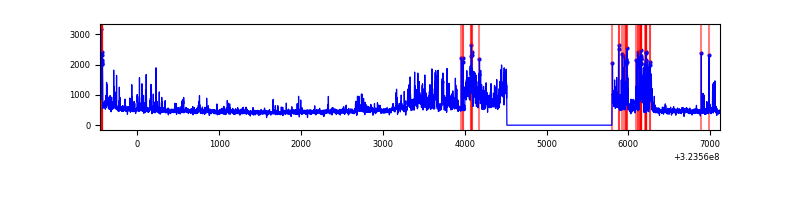 |
Top three noisy pixels from each quadrant. If the there are fewer than three noisy pixels in the level2.evt file, extra rows are filled as -1
| Pixel properties | Quadrant properties | ||||||
|---|---|---|---|---|---|---|---|
| Quadrant | DetID | PixID | Counts | Sigma | Mean | Median | Sigma |
| A | 13 | 254 | 10559 | 61.3 | 805 | 791 | 159.4 |
| A | 0 | 226 | 6968 | 38.76 | 805 | 791 | 159.4 |
| A | 3 | 137 | 6877 | 38.19 | 805 | 791 | 159.4 |
| B | 10 | 247 | 33490 | 218.71 | 809 | 791 | 149.5 |
| B | 0 | 190 | 18850 | 120.79 | 809 | 791 | 149.5 |
| B | 12 | 111 | 17035 | 108.65 | 809 | 791 | 149.5 |
| C | 14 | 238 | 128101 | 723.39 | 772 | 778 | 176.0 |
| C | 2 | 16 | 64588 | 362.54 | 772 | 778 | 176.0 |
| C | 7 | 247 | 35794 | 198.95 | 772 | 778 | 176.0 |
| D | 1 | 52 | 817695 | 4369.3 | 771 | 748 | 187.0 |
| D | 12 | 218 | 72571 | 384.13 | 771 | 748 | 187.0 |
| D | 8 | 195 | 47660 | 250.9 | 771 | 748 | 187.0 |
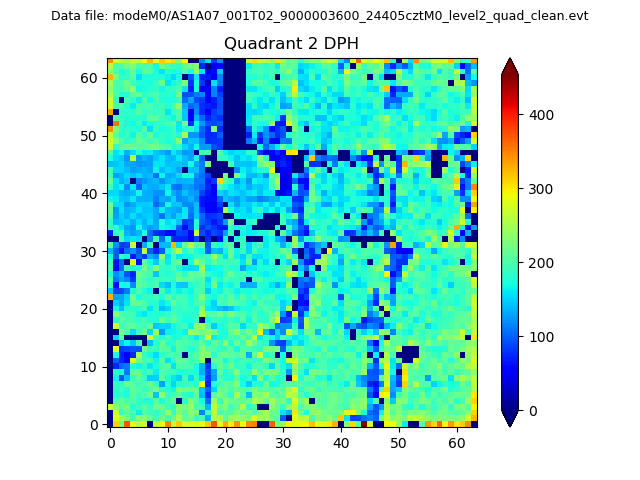
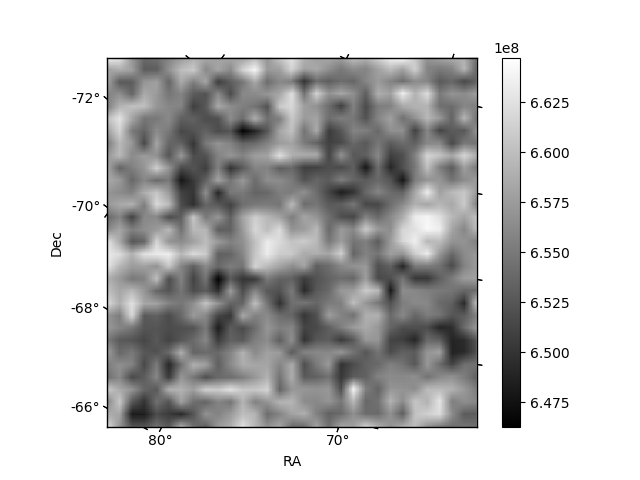
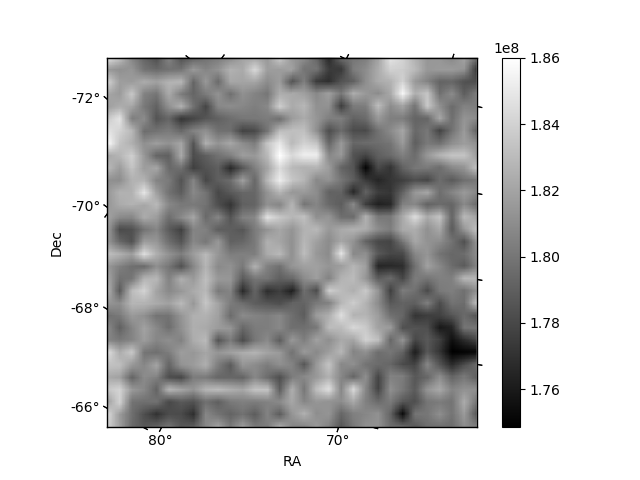
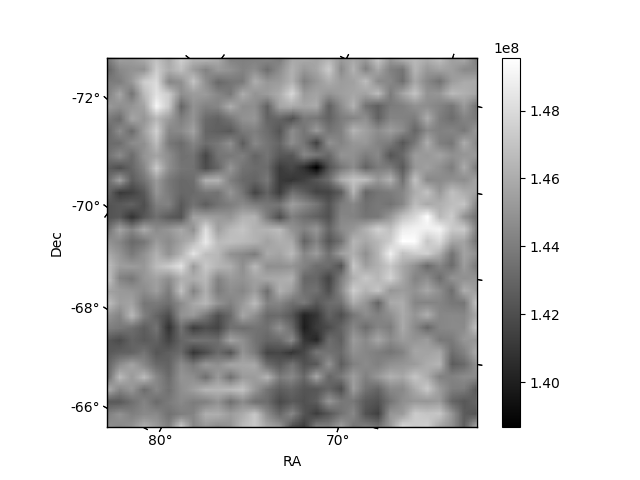
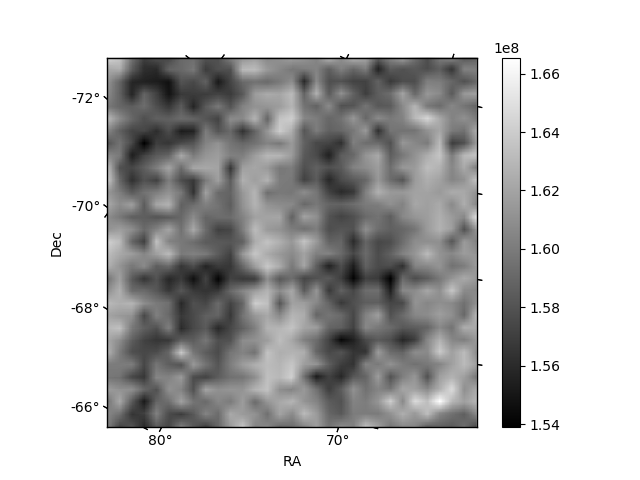
Histogram calculated using DETX and DETY for each event in the final _common_clean file
| Quadrant A | 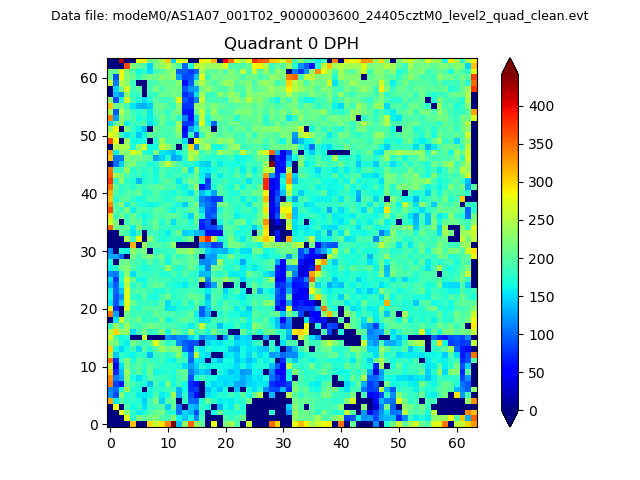 |
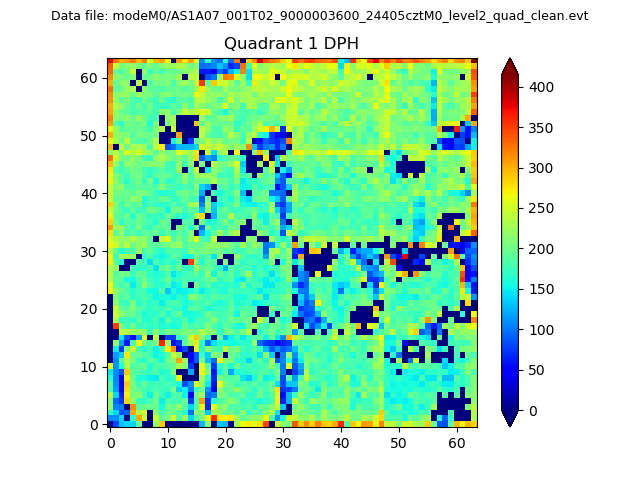 |
Quadrant B |
|---|---|---|---|
| Quadrant D | 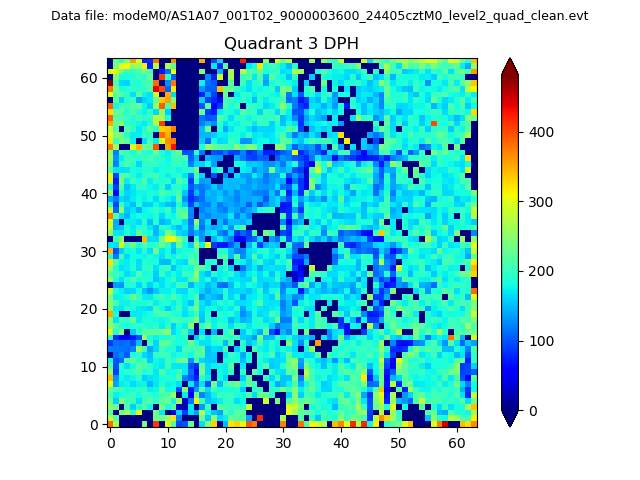 |
 |
Quadrant C |
| Plot type | Count rate plots | Images |
|---|---|---|
| Comparison with Poisson distribution Blue bars denote a histogram of data divided into 1 sec bins. Red curve is a Poisson curve with rate = median count rate of data. |
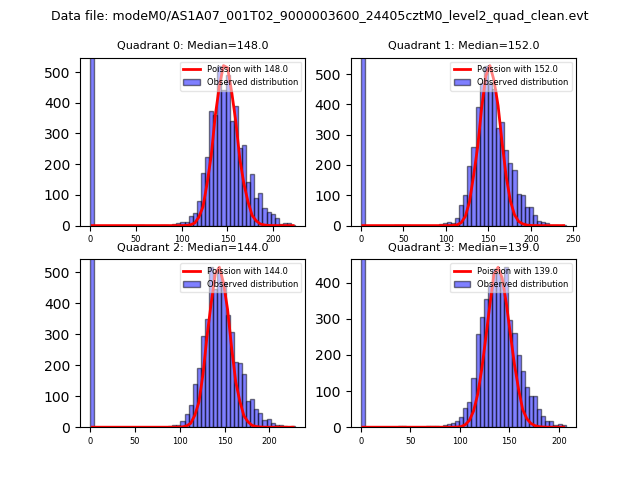 |
 |
| Quadrant-wise count rates Data is divided into 100 sec bins |
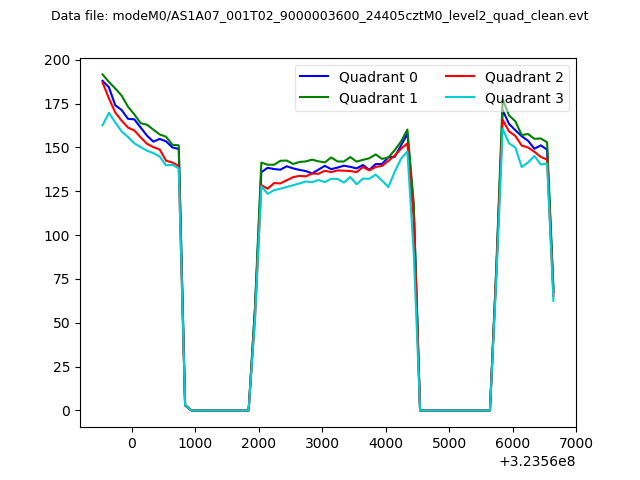 |
|
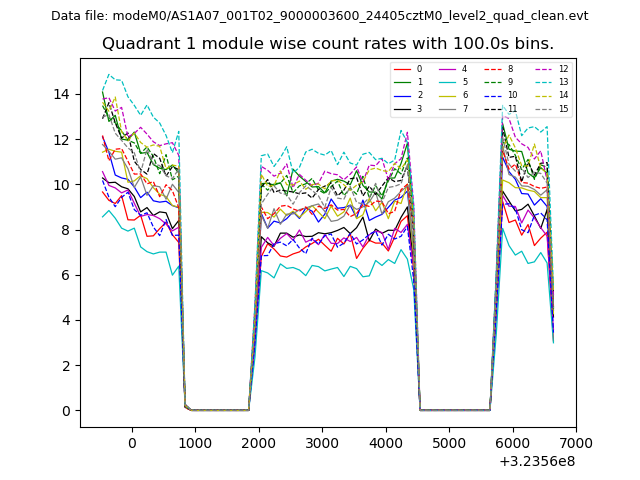
| Module-wise count rates for Quadrant A Data is divided into 100 sec bins |
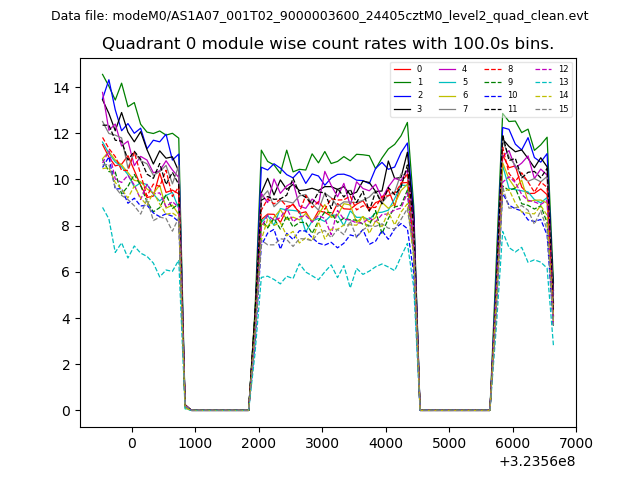 |
 |
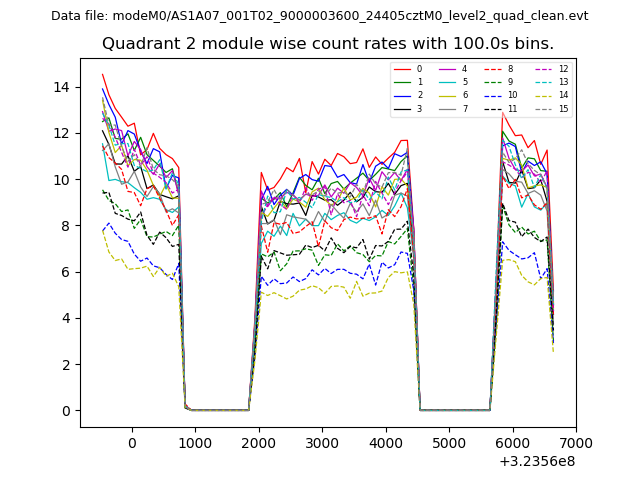
| Module-wise count rates for Quadrant B Data is divided into 100 sec bins |
 |
 |
| Module-wise count rates for Quadrant C Data is divided into 100 sec bins |
 |
 |
| Module-wise count rates for Quadrant D Data is divided into 100 sec bins |
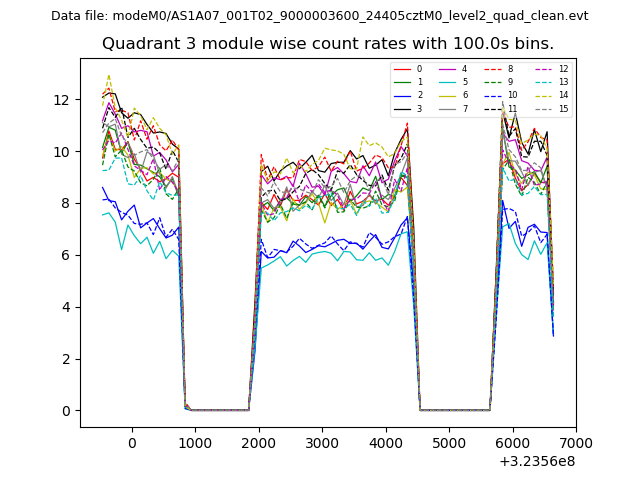 |
 |
| Parameter | Plot |
|---|---|
| CZT HV Monitor |  |
| D_VDD | 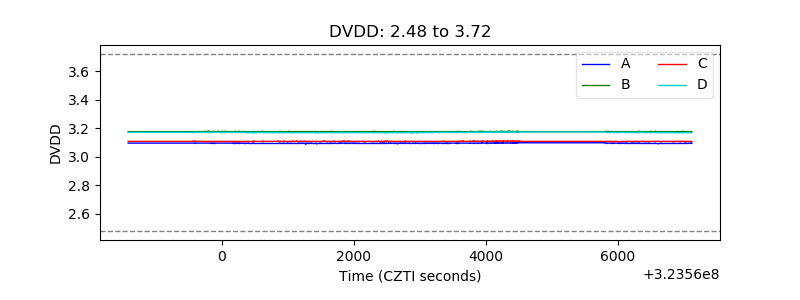 |
| Temperature 1 | 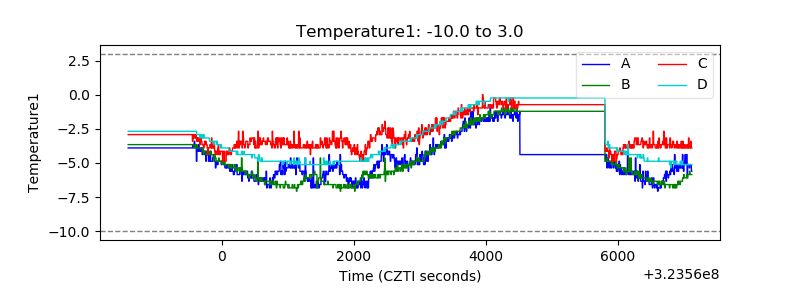 |
| Veto HV Monitor | 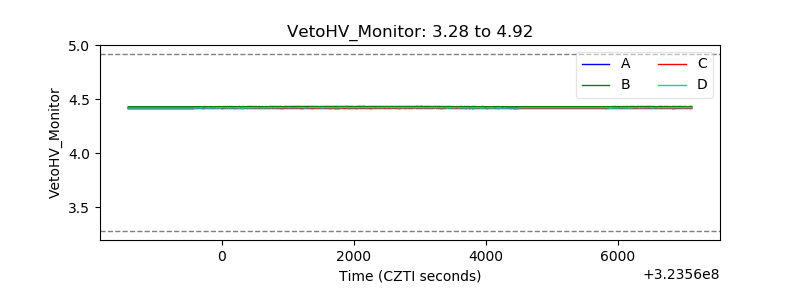 |
| Veto LLD | 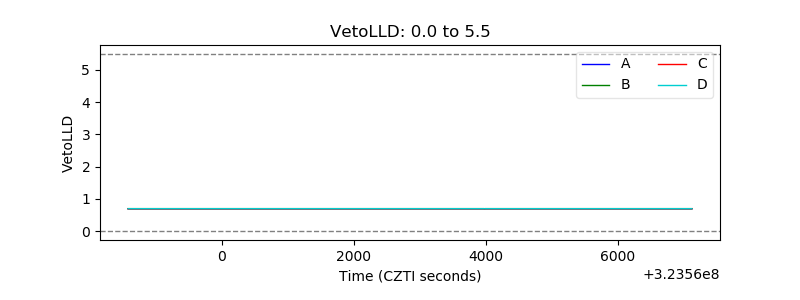 |
| Alpha Counter | 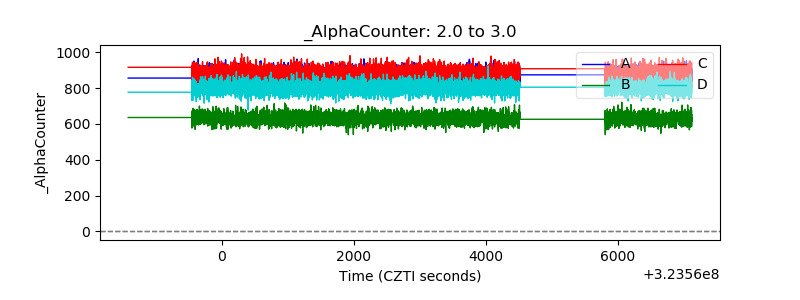 |
| _CPM_Rate | 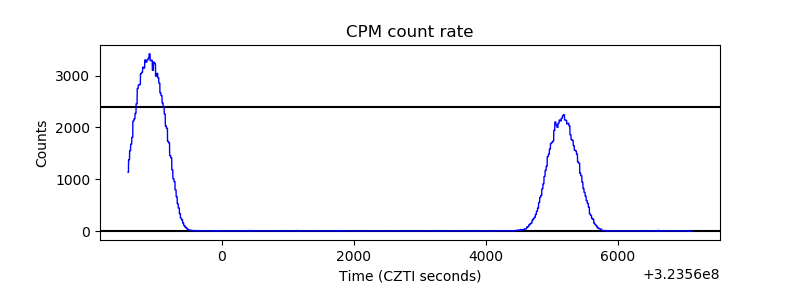 |
| CZT Counter | 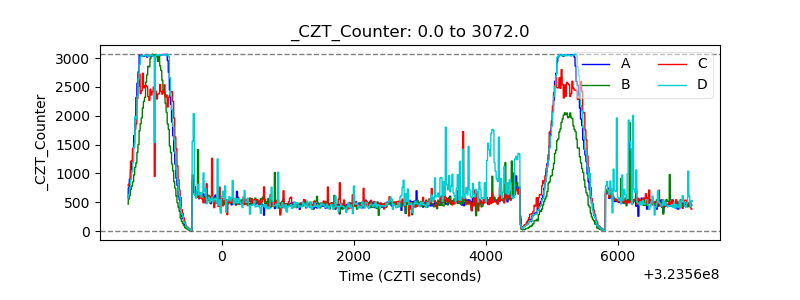 |
| +2.5 Volts monitor |  |
| +5 Volts monitor | 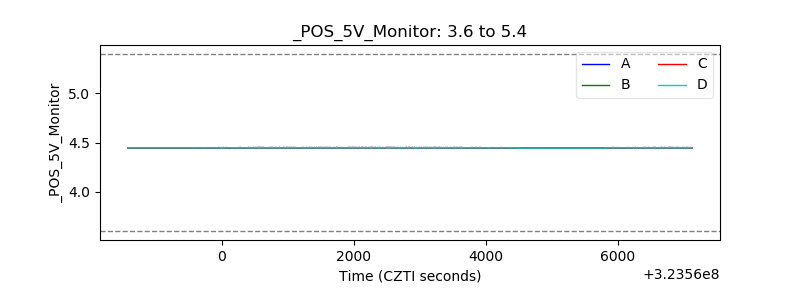 |
| _ROLL_ROT | 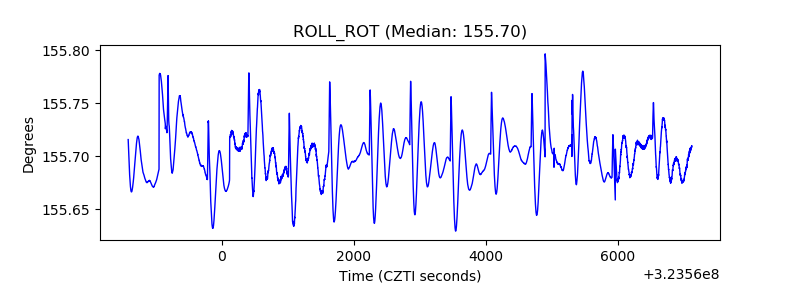 |
| _Roll_DEC | 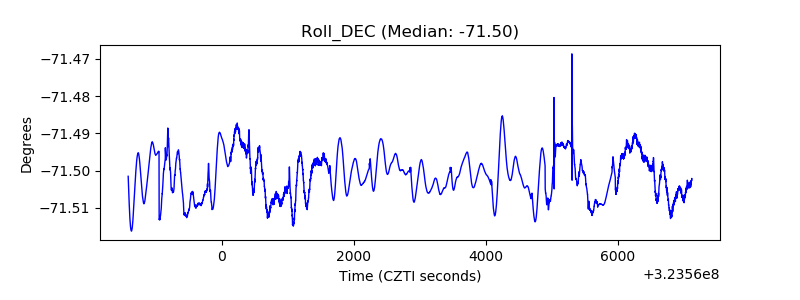 |
| _Roll_RA | 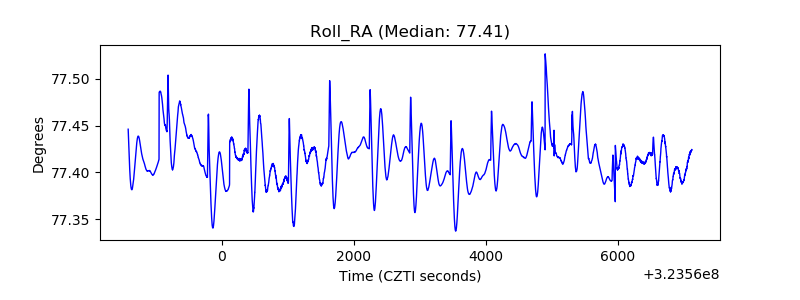 |
| Veto Counter | 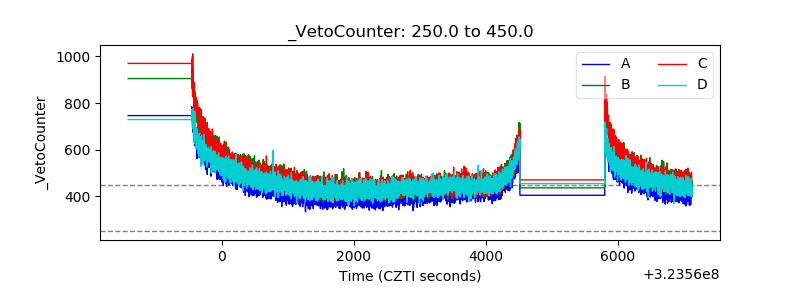 |