| Param | Original file | Final file |
|---|---|---|
| Filename | modeM0/AS1A07_001T02_9000003600_24406cztM0_level2.evt | modeM0/AS1A07_001T02_9000003600_24406cztM0_level2_quad_clean.evt |
| Size (bytes) | 473,149,440 | 96,390,720 |
| Size | 451.2 MB | 91.9 MB |
| Events in quadrant A | 3,083,087 | 630,088 |
| Events in quadrant B | 3,212,798 | 644,087 |
| Events in quadrant C | 3,235,905 | 612,884 |
| Events in quadrant D | 4,360,502 | 583,198 |
| Mode M9 | |||
|---|---|---|---|
| Quadrant | BADHDUFLAG | Total packets | Discarded packets |
| A | 0 | 15 | 0 |
| B | 0 | 16 | 0 |
| C | 0 | 16 | 0 |
| D | 0 | 16 | 0 |
| Mode M0 | |||
|---|---|---|---|
| Quadrant | BADHDUFLAG | Total packets | Discarded packets |
| A | 0 | 13177 | 2 |
| B | 0 | 13455 | 2 |
| C | 0 | 13358 | 2 |
| D | 0 | 17219 | 2 |
| Mode SS | |||
|---|---|---|---|
| Quadrant | BADHDUFLAG | Total packets | Discarded packets |
| A | 0 | 130 | 0 |
| B | 0 | 130 | 0 |
| C | 0 | 130 | 0 |
| D | 0 | 130 | 0 |
| Quadrant | Total seconds | Saturated seconds | Saturation percentage |
|---|---|---|---|
| A | 6436 | 25 | 0.388440% |
| B | 6436 | 64 | 0.994406% |
| C | 6436 | 74 | 1.149782% |
| D | 6436 | 291 | 4.521442% |
Noise dominated data is calculated using 1-second bins in cleaned event files. If a bin has >2000 counts, and if more than 50% of those come from <1% of pixels, then it is considered to be noise-dominated and hence unusable.
| Quadrant | # 1 sec bins | Bins with >0 counts | Bins with >2000 counts | High rate bins dominated by noise | Noise dominated (total time) | Noise dominated (detector-on time) | Marked lightcurve |
|---|---|---|---|---|---|---|---|
| A | 7596 | 6437 | 0 | 0 | 0.00% | 0.00% | 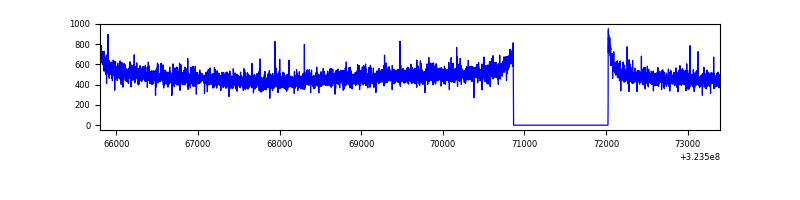 |
| B | 7596 | 6437 | 10 | 10 | 0.13% | 0.16% | 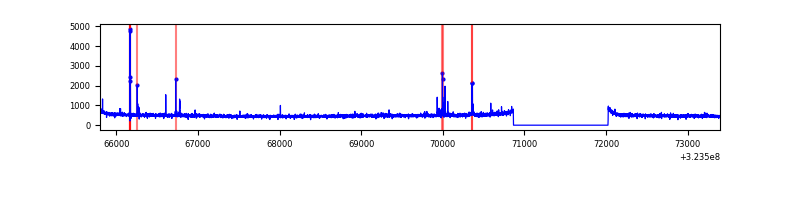 |
| C | 7596 | 6437 | 2 | 2 | 0.03% | 0.03% |  |
| D | 7596 | 6437 | 212 | 212 | 2.79% | 3.29% | 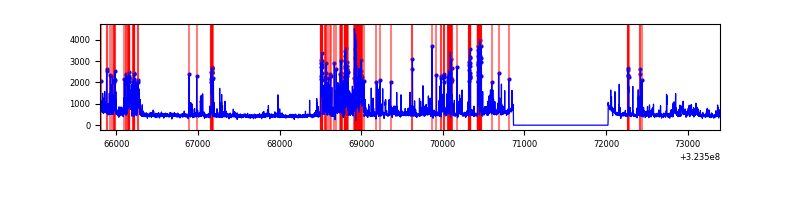 |
Top three noisy pixels from each quadrant. If the there are fewer than three noisy pixels in the level2.evt file, extra rows are filled as -1
| Pixel properties | Quadrant properties | ||||||
|---|---|---|---|---|---|---|---|
| Quadrant | DetID | PixID | Counts | Sigma | Mean | Median | Sigma |
| A | 13 | 254 | 11051 | 63.93 | 799 | 782 | 160.6 |
| A | 0 | 226 | 6831 | 37.66 | 799 | 782 | 160.6 |
| A | 3 | 137 | 6830 | 37.65 | 799 | 782 | 160.6 |
| B | 10 | 247 | 33860 | 222.37 | 800 | 780 | 148.8 |
| B | 12 | 17 | 23751 | 154.42 | 800 | 780 | 148.8 |
| B | 12 | 111 | 17501 | 112.4 | 800 | 780 | 148.8 |
| C | 14 | 238 | 126396 | 714.66 | 770 | 776 | 175.8 |
| C | 7 | 247 | 56374 | 316.3 | 770 | 776 | 175.8 |
| C | 2 | 16 | 45201 | 252.73 | 770 | 776 | 175.8 |
| D | 1 | 52 | 1377125 | 7467.07 | 766 | 742 | 184.3 |
| D | 8 | 195 | 27743 | 146.48 | 766 | 742 | 184.3 |
| D | 2 | 234 | 26127 | 137.72 | 766 | 742 | 184.3 |
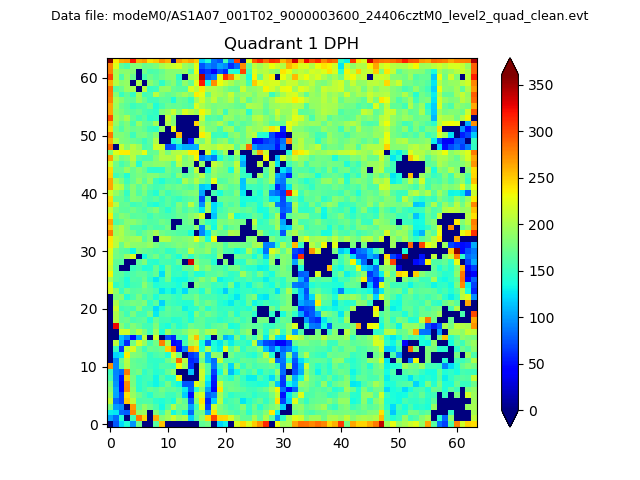
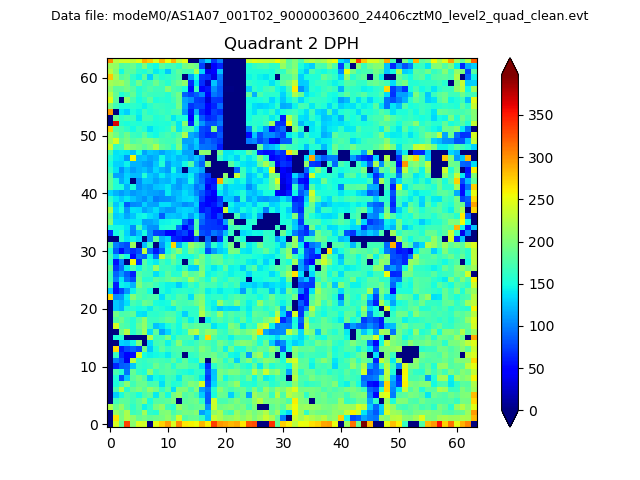
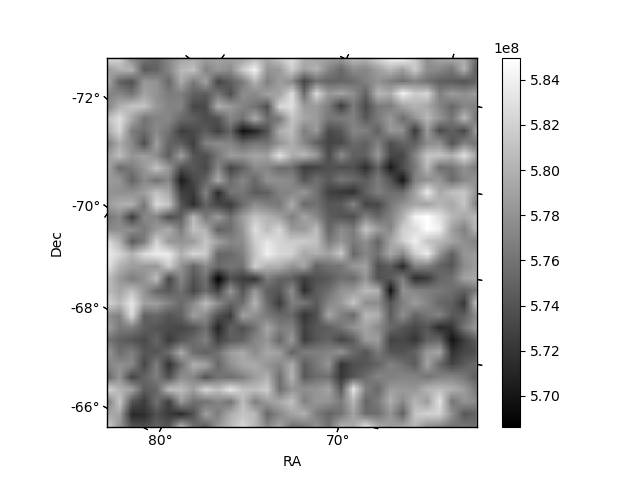
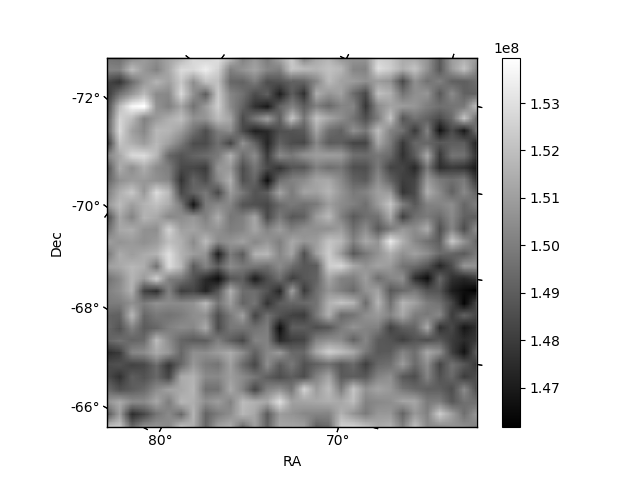
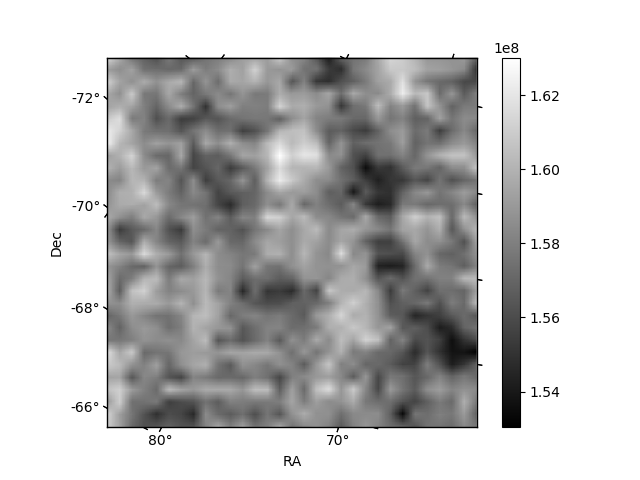
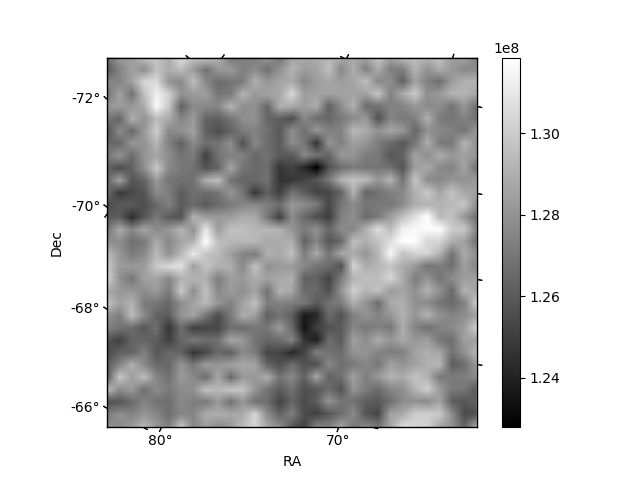
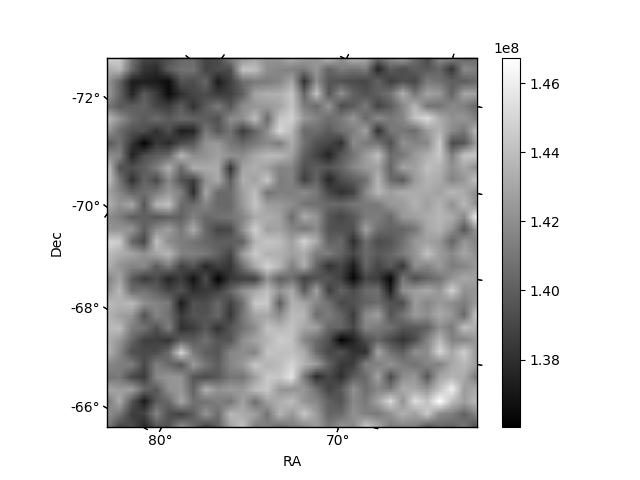
Histogram calculated using DETX and DETY for each event in the final _common_clean file
| Quadrant A | 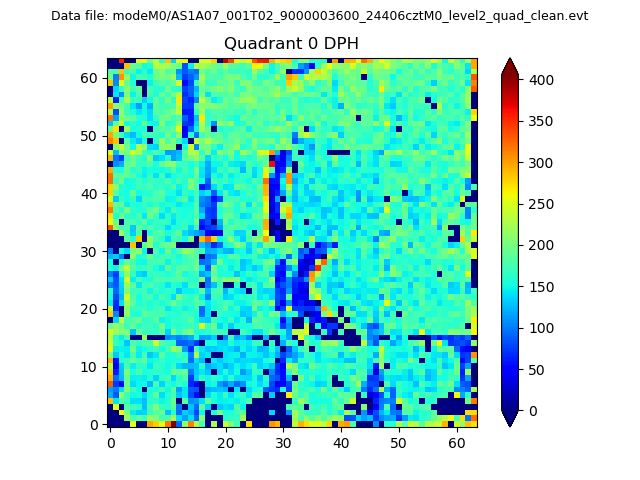 |
 |
Quadrant B |
|---|---|---|---|
| Quadrant D | 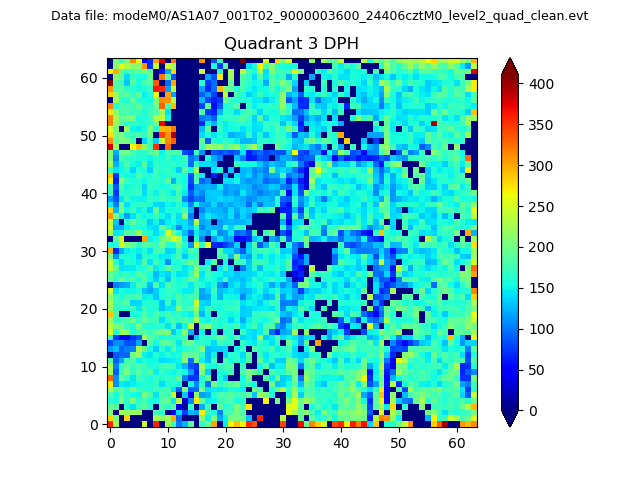 |
 |
Quadrant C |
| Plot type | Count rate plots | Images |
|---|---|---|
| Comparison with Poisson distribution Blue bars denote a histogram of data divided into 1 sec bins. Red curve is a Poisson curve with rate = median count rate of data. |
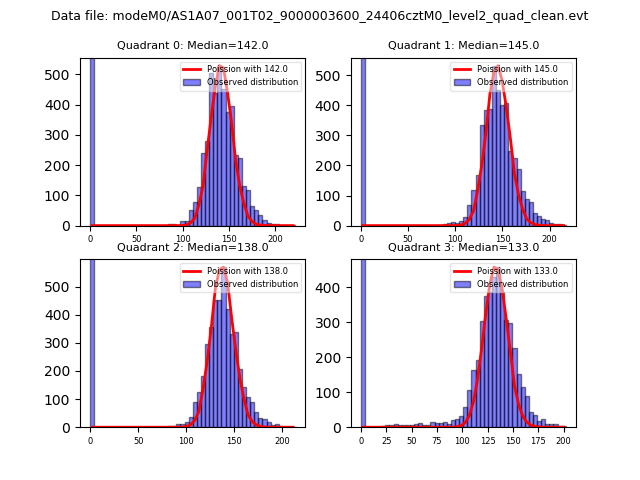 |
 |
| Quadrant-wise count rates Data is divided into 100 sec bins |
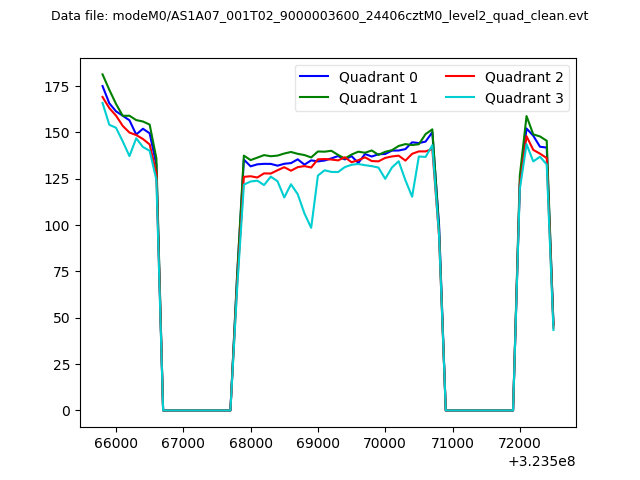 |
|
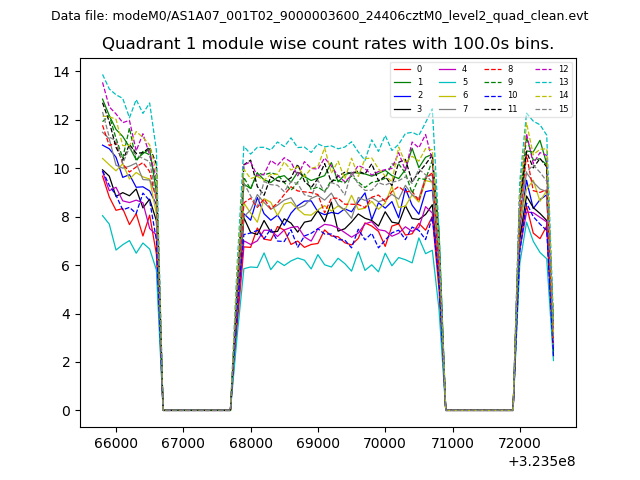
| Module-wise count rates for Quadrant A Data is divided into 100 sec bins |
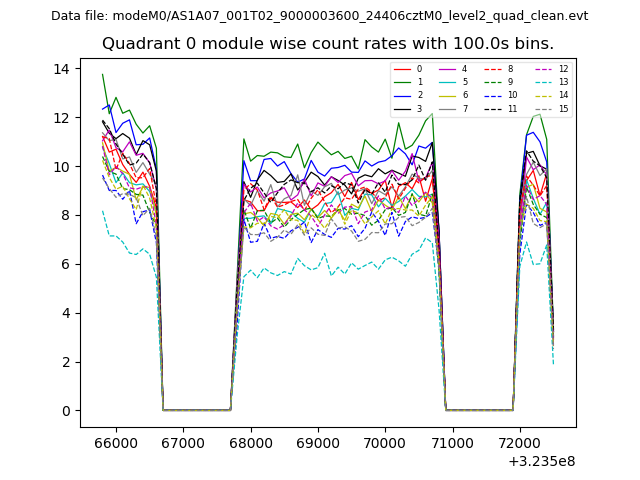 |
 |
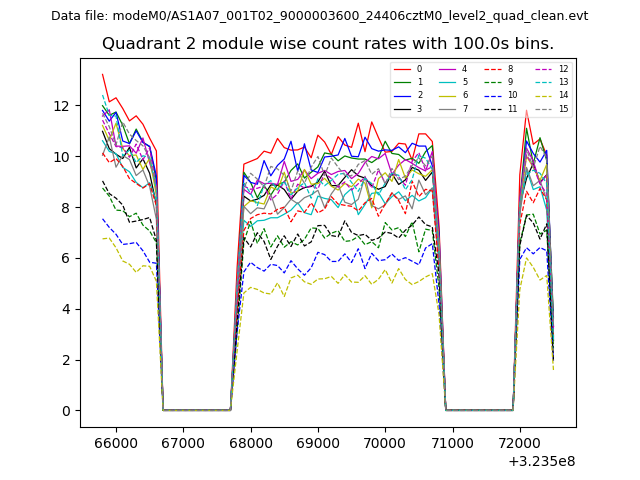
| Module-wise count rates for Quadrant B Data is divided into 100 sec bins |
 |
 |
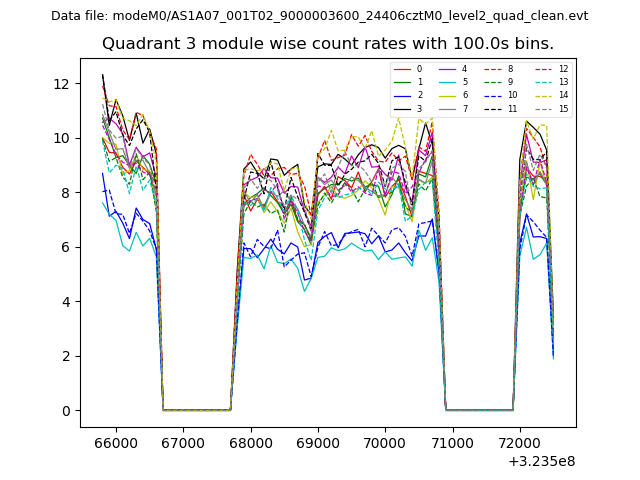
| Module-wise count rates for Quadrant C Data is divided into 100 sec bins |
 |
 |
| Module-wise count rates for Quadrant D Data is divided into 100 sec bins |
 |
 |
| Parameter | Plot |
|---|---|
| CZT HV Monitor | 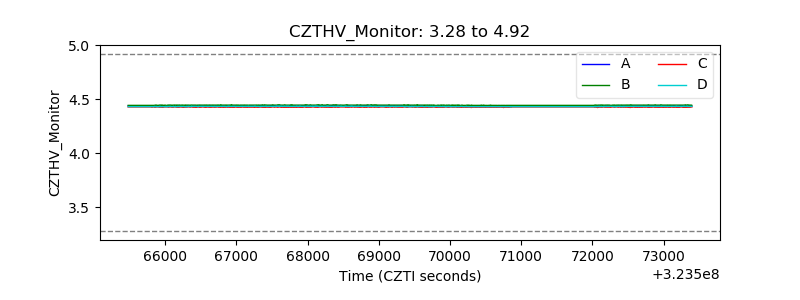 |
| D_VDD | 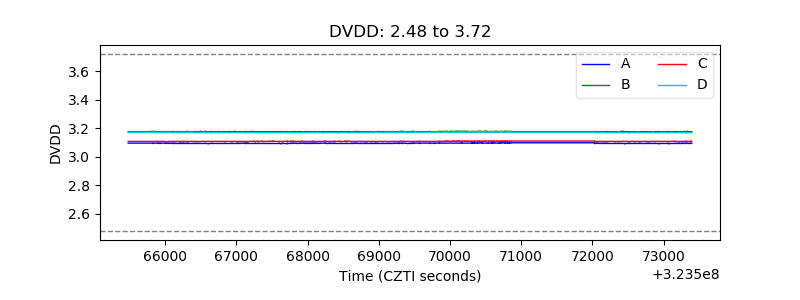 |
| Temperature 1 | 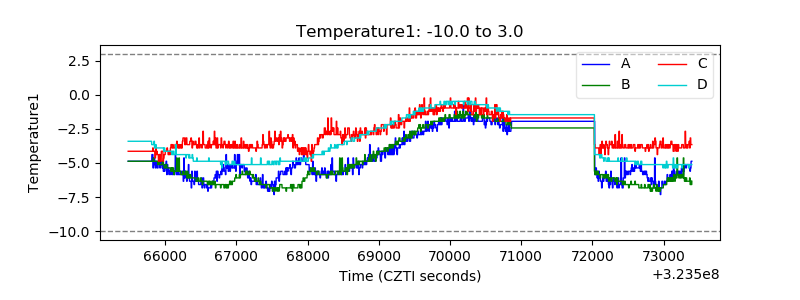 |
| Veto HV Monitor |  |
| Veto LLD | 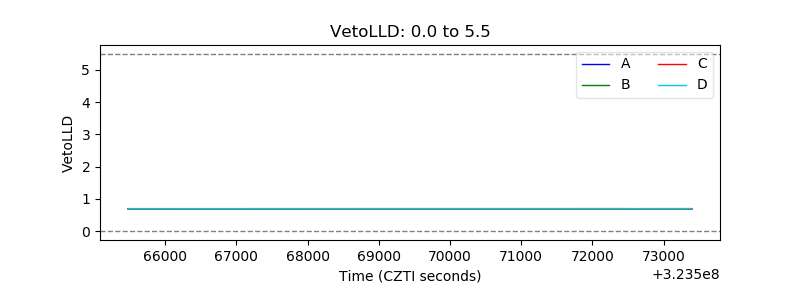 |
| Alpha Counter | 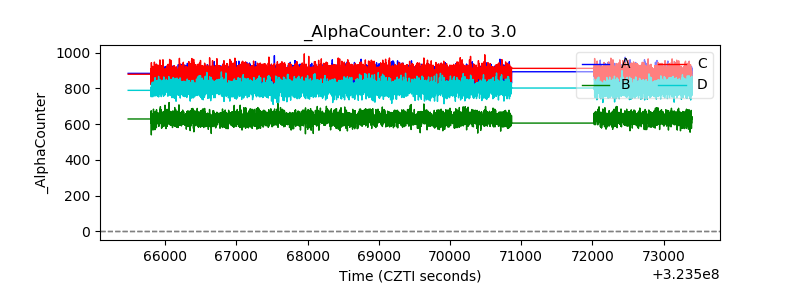 |
| _CPM_Rate | 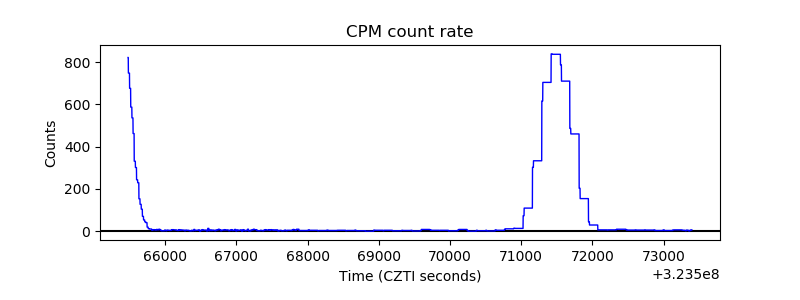 |
| CZT Counter | 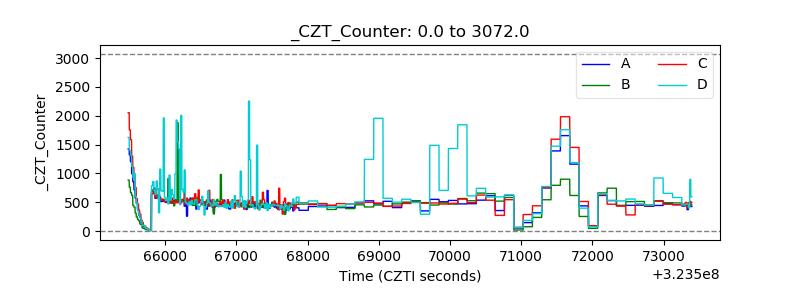 |
| +2.5 Volts monitor |  |
| +5 Volts monitor |  |
| _ROLL_ROT | 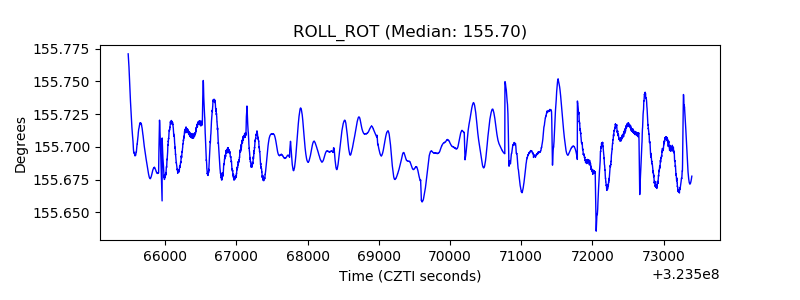 |
| _Roll_DEC | 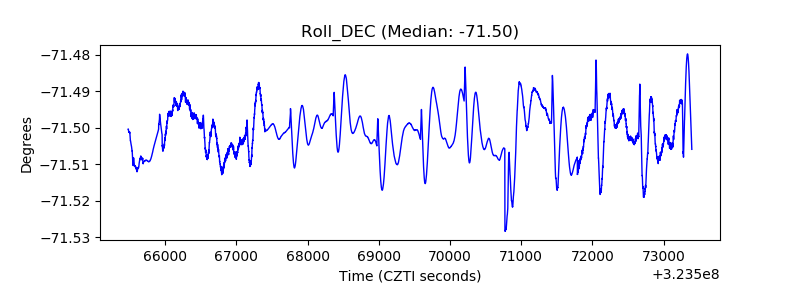 |
| _Roll_RA | 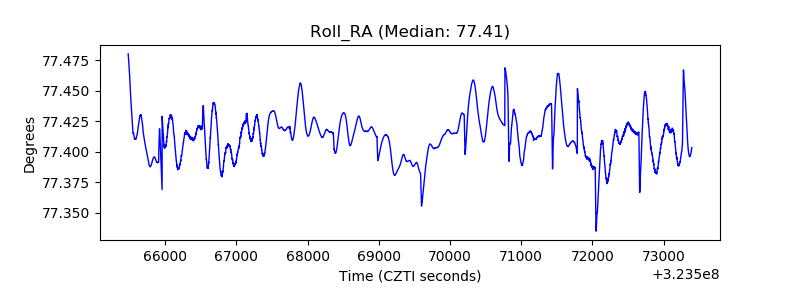 |
| Veto Counter | 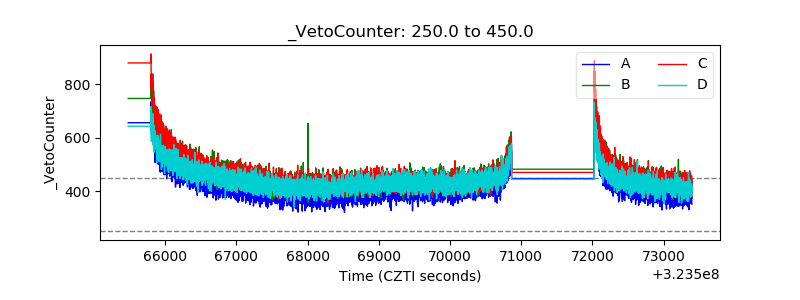 |