| Param | Original file | Final file |
|---|---|---|
| Filename | modeM0/AS1A07_001T02_9000003600_24407cztM0_level2.evt | modeM0/AS1A07_001T02_9000003600_24407cztM0_level2_quad_clean.evt |
| Size (bytes) | 476,314,560 | 98,976,960 |
| Size | 454.2 MB | 94.4 MB |
| Events in quadrant A | 3,301,298 | 636,545 |
| Events in quadrant B | 3,397,409 | 648,774 |
| Events in quadrant C | 3,431,171 | 617,821 |
| Events in quadrant D | 3,814,443 | 601,476 |
| Mode M9 | |||
|---|---|---|---|
| Quadrant | BADHDUFLAG | Total packets | Discarded packets |
| A | 0 | 18 | 0 |
| B | 0 | 19 | 0 |
| C | 0 | 19 | 0 |
| D | 0 | 19 | 0 |
| Mode M0 | |||
|---|---|---|---|
| Quadrant | BADHDUFLAG | Total packets | Discarded packets |
| A | 0 | 14450 | 2 |
| B | 0 | 14604 | 2 |
| C | 0 | 14536 | 3 |
| D | 0 | 15961 | 2 |
| Mode SS | |||
|---|---|---|---|
| Quadrant | BADHDUFLAG | Total packets | Discarded packets |
| A | 0 | 144 | 0 |
| B | 0 | 144 | 0 |
| C | 0 | 144 | 0 |
| D | 0 | 144 | 0 |
| Quadrant | Total seconds | Saturated seconds | Saturation percentage |
|---|---|---|---|
| A | 7077 | 49 | 0.692384% |
| B | 7077 | 96 | 1.356507% |
| C | 7076 | 106 | 1.498021% |
| D | 7076 | 87 | 1.229508% |
Noise dominated data is calculated using 1-second bins in cleaned event files. If a bin has >2000 counts, and if more than 50% of those come from <1% of pixels, then it is considered to be noise-dominated and hence unusable.
| Quadrant | # 1 sec bins | Bins with >0 counts | Bins with >2000 counts | High rate bins dominated by noise | Noise dominated (total time) | Noise dominated (detector-on time) | Marked lightcurve |
|---|---|---|---|---|---|---|---|
| A | 7907 | 7078 | 0 | 0 | 0.00% | 0.00% | 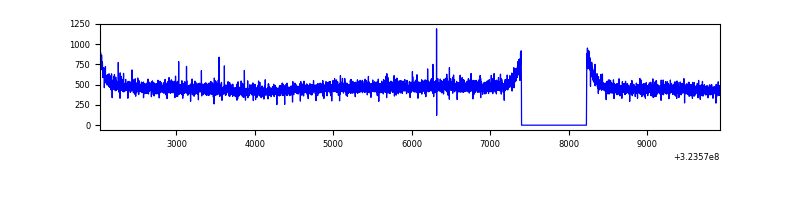 |
| B | 7907 | 7078 | 8 | 8 | 0.10% | 0.11% | 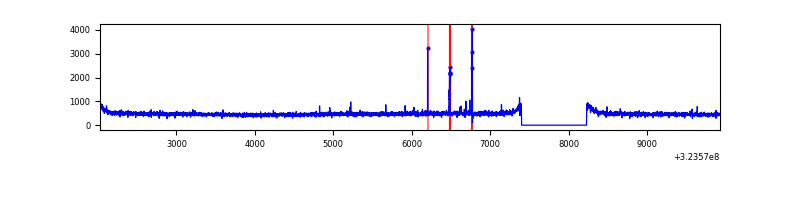 |
| C | 7906 | 7077 | 0 | 0 | 0.00% | 0.00% | 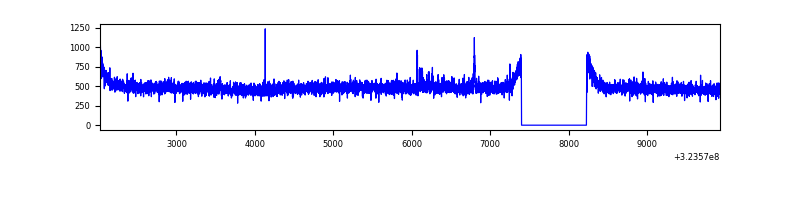 |
| D | 7906 | 7077 | 33 | 33 | 0.42% | 0.47% | 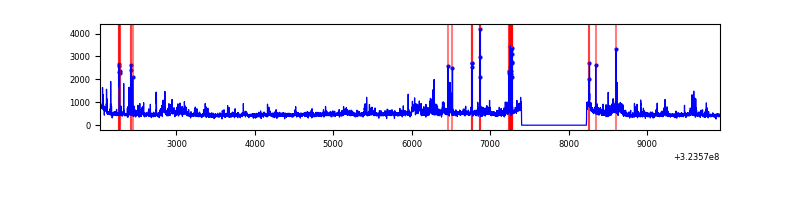 |
Top three noisy pixels from each quadrant. If the there are fewer than three noisy pixels in the level2.evt file, extra rows are filled as -1
| Pixel properties | Quadrant properties | ||||||
|---|---|---|---|---|---|---|---|
| Quadrant | DetID | PixID | Counts | Sigma | Mean | Median | Sigma |
| A | 13 | 254 | 12356 | 67.57 | 855 | 837 | 170.5 |
| A | 3 | 137 | 7561 | 39.44 | 855 | 837 | 170.5 |
| A | 0 | 226 | 7257 | 37.66 | 855 | 837 | 170.5 |
| B | 5 | 172 | 20302 | 121.22 | 857 | 835 | 160.6 |
| B | 12 | 111 | 19554 | 116.56 | 857 | 835 | 160.6 |
| B | 11 | 111 | 17211 | 101.97 | 857 | 835 | 160.6 |
| C | 14 | 238 | 134095 | 701.1 | 824 | 828 | 190.1 |
| C | 7 | 247 | 46120 | 238.27 | 824 | 828 | 190.1 |
| C | 2 | 16 | 29506 | 150.87 | 824 | 828 | 190.1 |
| D | 1 | 52 | 514333 | 2536.01 | 830 | 802 | 202.5 |
| D | 8 | 195 | 143627 | 705.33 | 830 | 802 | 202.5 |
| D | 2 | 234 | 29739 | 142.9 | 830 | 802 | 202.5 |
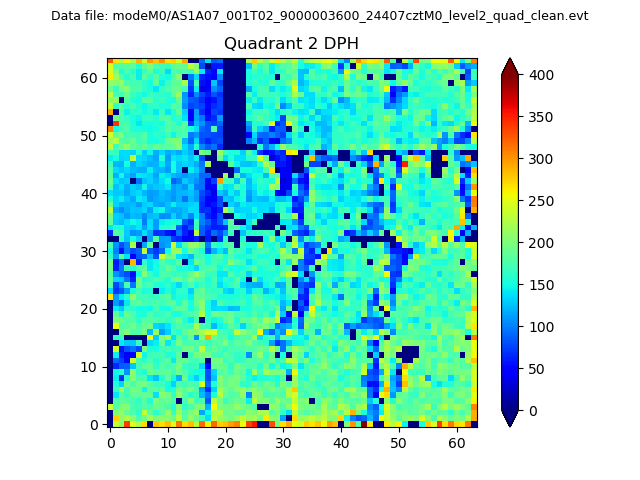
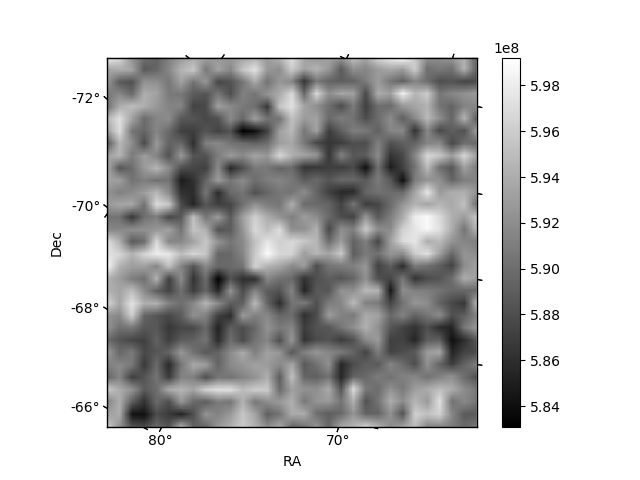
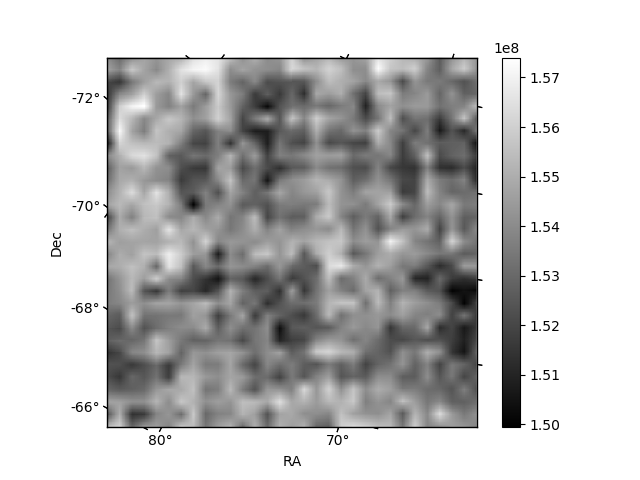
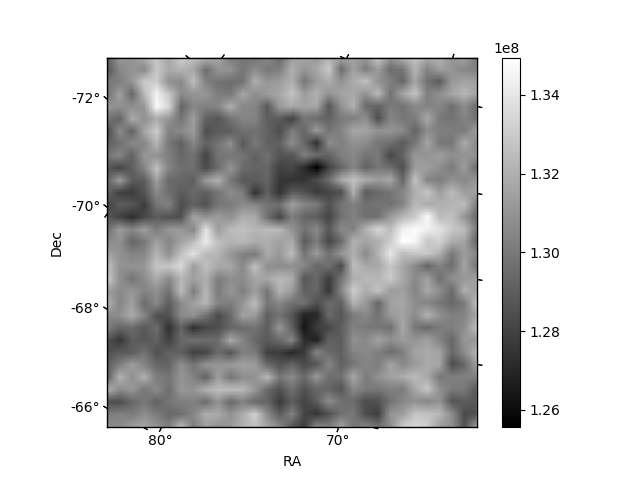
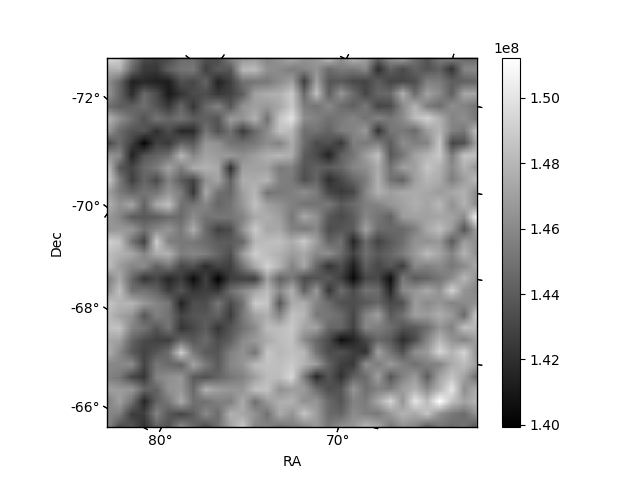
Histogram calculated using DETX and DETY for each event in the final _common_clean file
| Quadrant A | 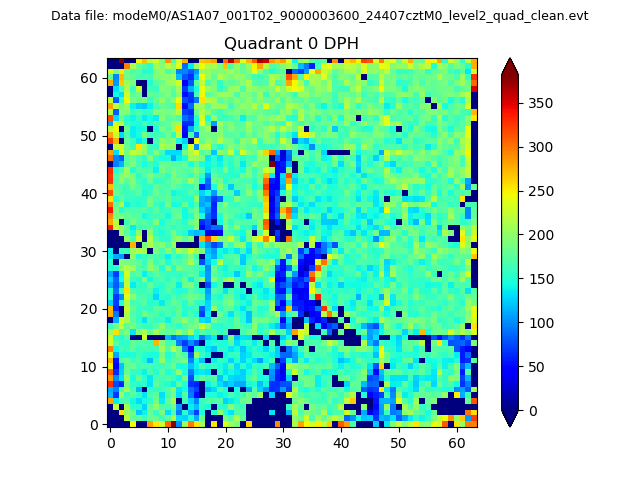 |
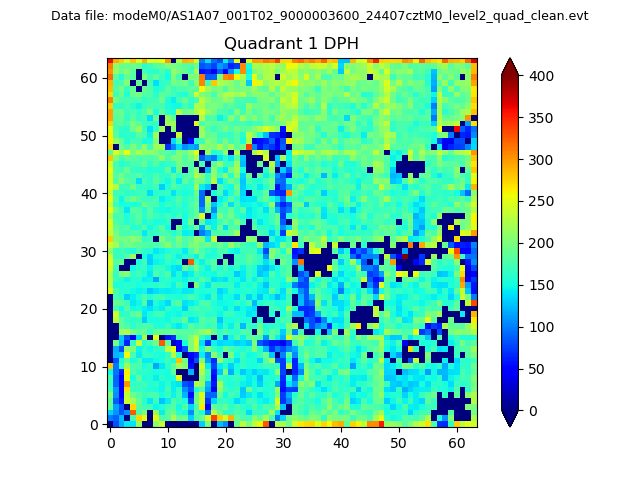 |
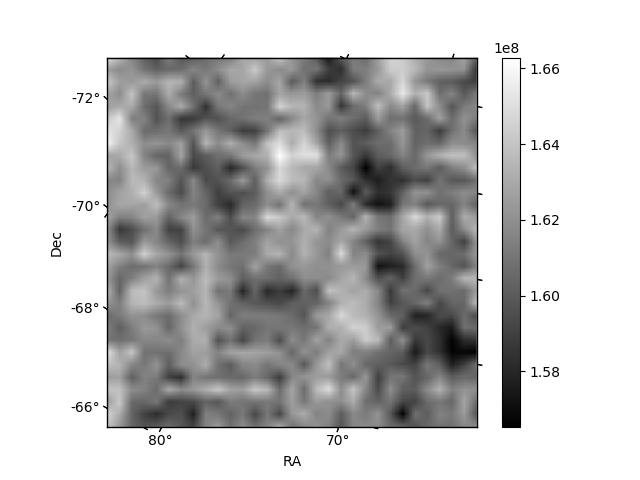
Quadrant B |
|---|---|---|---|
| Quadrant D | 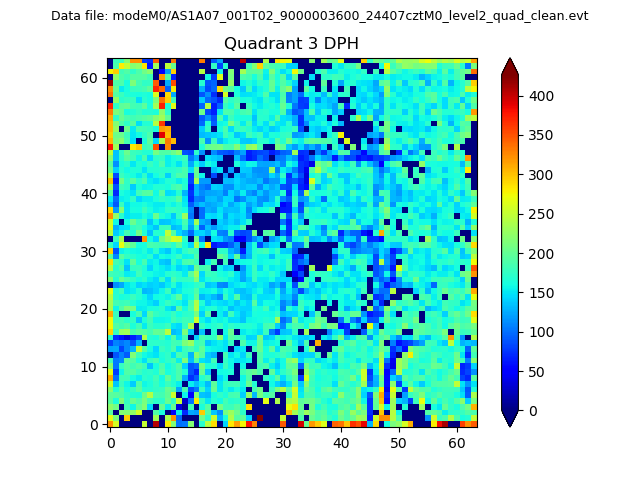 |
 |
Quadrant C |
| Plot type | Count rate plots | Images |
|---|---|---|
| Comparison with Poisson distribution Blue bars denote a histogram of data divided into 1 sec bins. Red curve is a Poisson curve with rate = median count rate of data. |
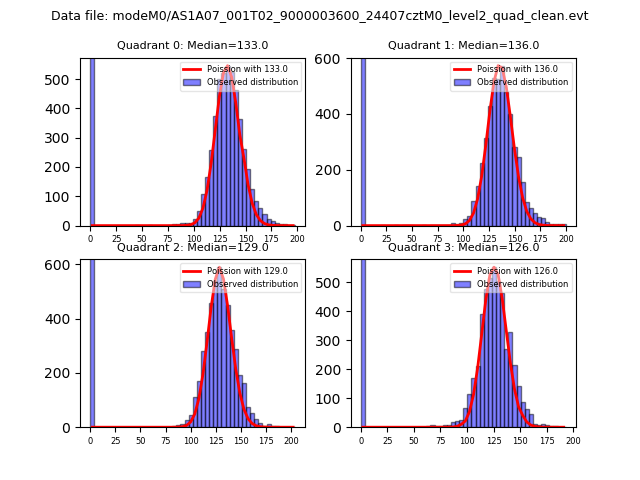 |
 |
| Quadrant-wise count rates Data is divided into 100 sec bins |
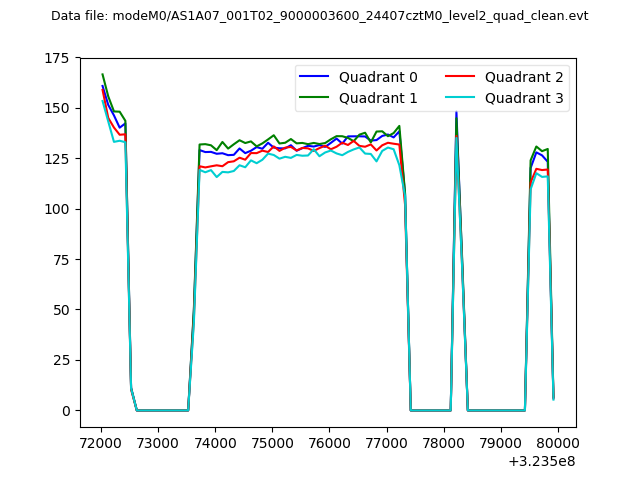 |
|
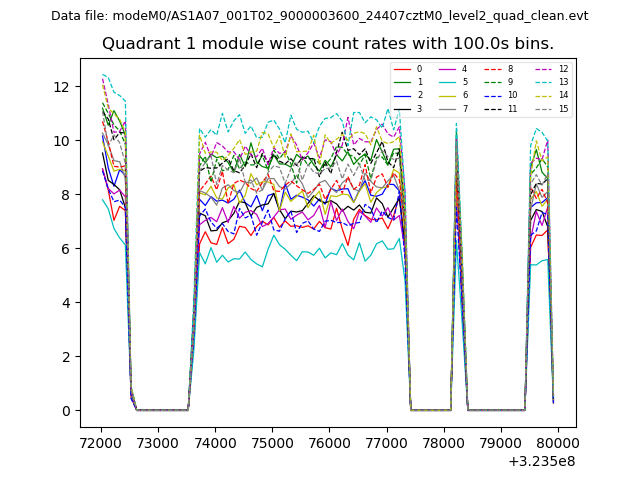
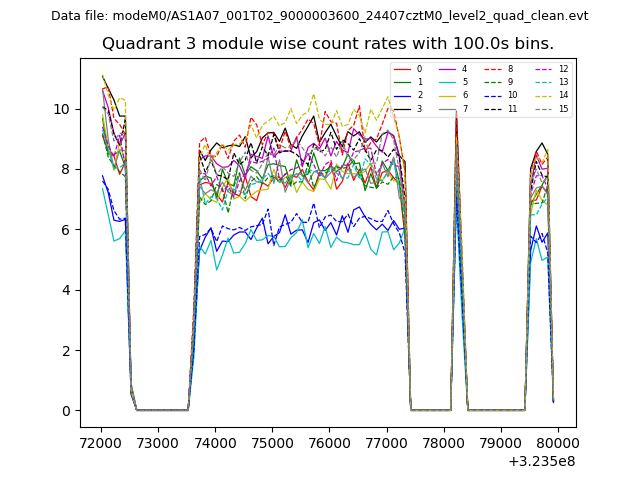
| Module-wise count rates for Quadrant A Data is divided into 100 sec bins |
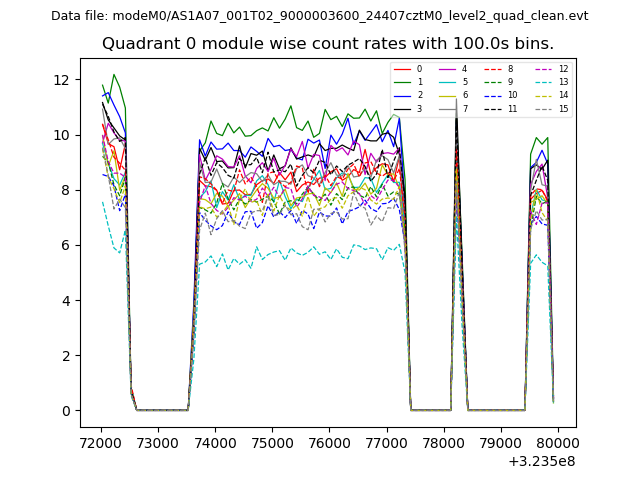 |
 |
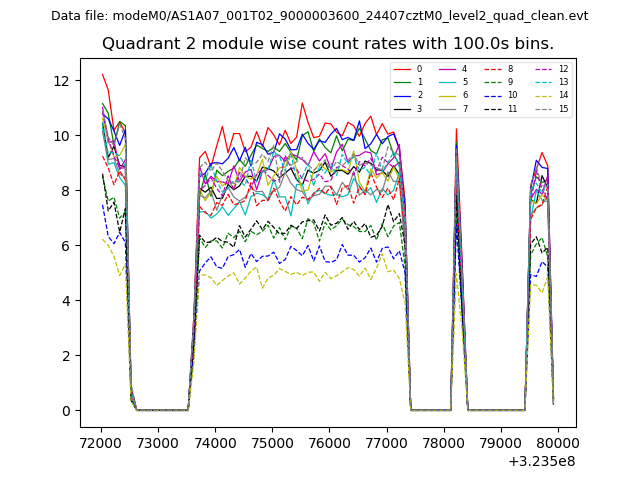
| Module-wise count rates for Quadrant B Data is divided into 100 sec bins |
 |
 |
| Module-wise count rates for Quadrant C Data is divided into 100 sec bins |
 |
 |
| Module-wise count rates for Quadrant D Data is divided into 100 sec bins |
 |
 |
| Parameter | Plot |
|---|---|
| CZT HV Monitor | 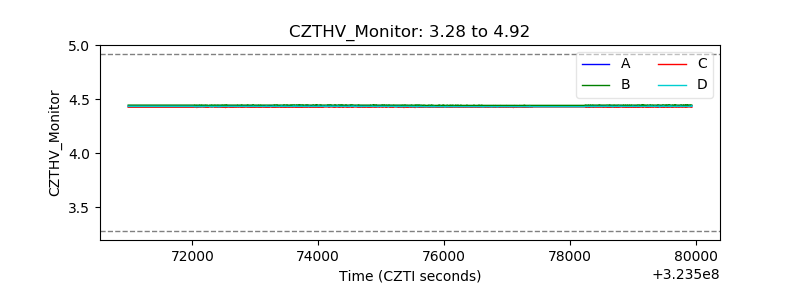 |
| D_VDD | 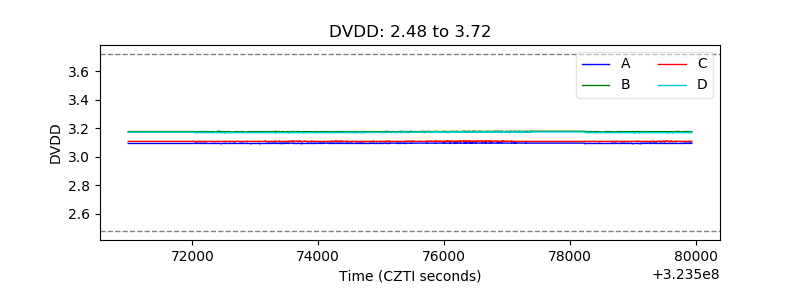 |
| Temperature 1 | 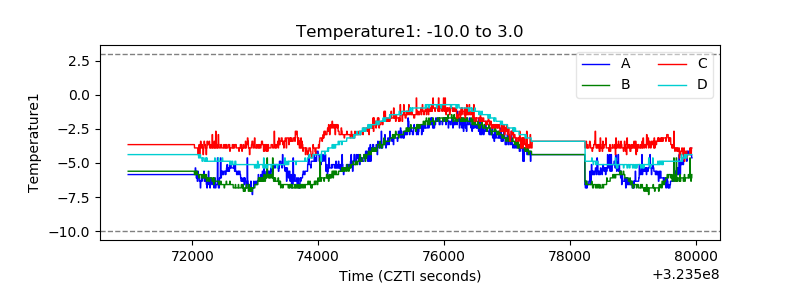 |
| Veto HV Monitor | 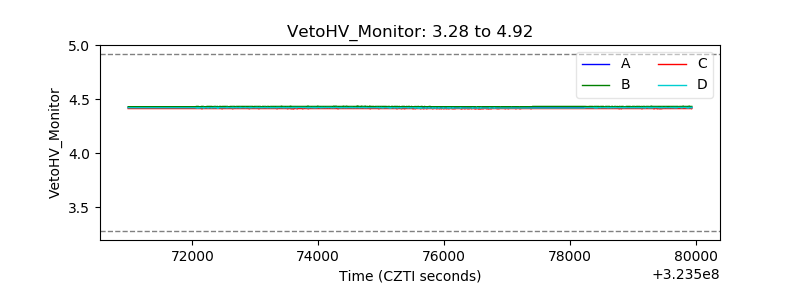 |
| Veto LLD | 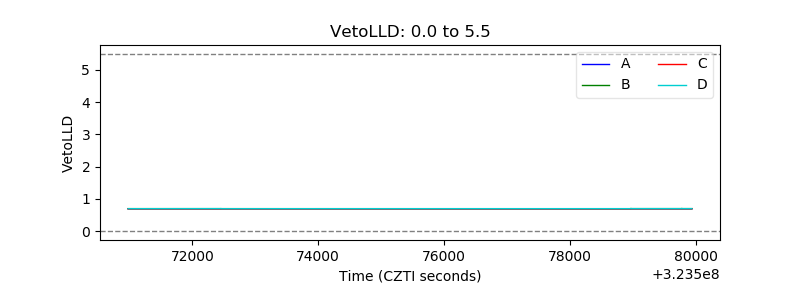 |
| Alpha Counter | 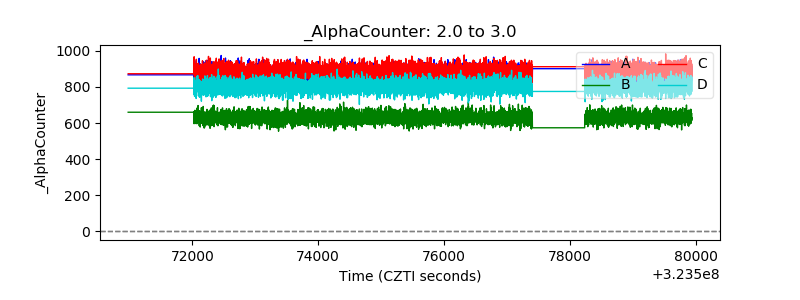 |
| _CPM_Rate | 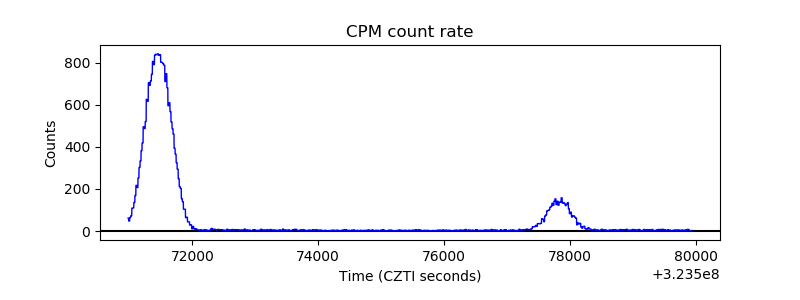 |
| CZT Counter | 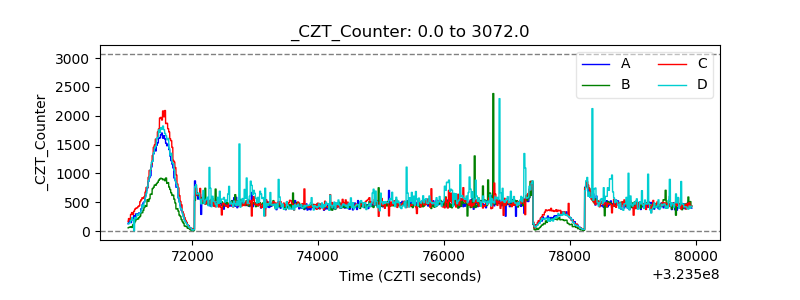 |
| +2.5 Volts monitor |  |
| +5 Volts monitor |  |
| _ROLL_ROT | 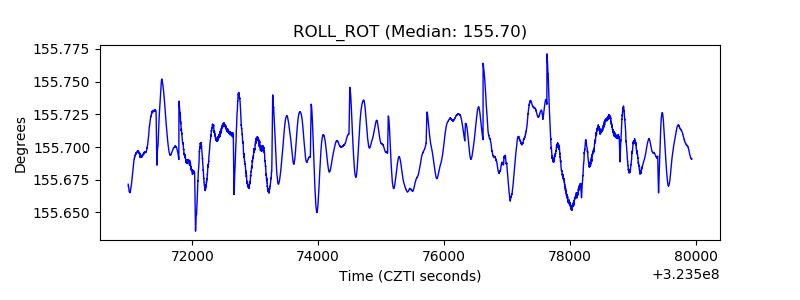 |
| _Roll_DEC |  |
| _Roll_RA | 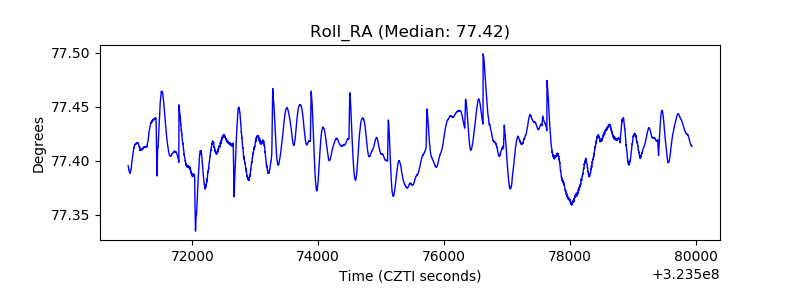 |
| Veto Counter | 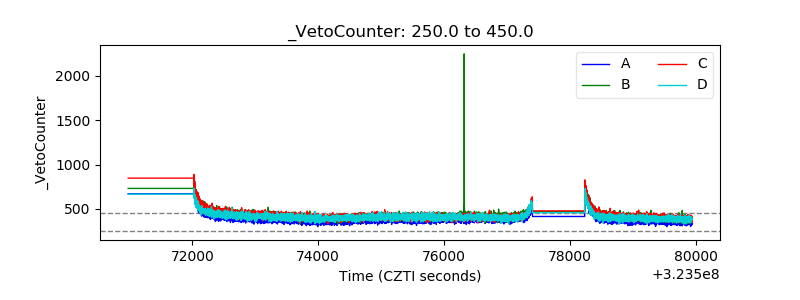 |