| Param | Original file | Final file |
|---|---|---|
| Filename | modeM0/AS1A07_001T02_9000003600_24409cztM0_level2.evt | modeM0/AS1A07_001T02_9000003600_24409cztM0_level2_quad_clean.evt |
| Size (bytes) | 447,359,040 | 109,480,320 |
| Size | 426.6 MB | 104.4 MB |
| Events in quadrant A | 3,117,148 | 721,964 |
| Events in quadrant B | 3,182,798 | 734,751 |
| Events in quadrant C | 3,193,130 | 700,706 |
| Events in quadrant D | 3,593,775 | 685,774 |
| Mode M9 | |||
|---|---|---|---|
| Quadrant | BADHDUFLAG | Total packets | Discarded packets |
| A | 0 | 2 | 0 |
| B | 0 | 2 | 0 |
| C | 0 | 2 | 0 |
| D | 0 | 2 | 0 |
| Mode M0 | |||
|---|---|---|---|
| Quadrant | BADHDUFLAG | Total packets | Discarded packets |
| A | 0 | 13881 | 1 |
| B | 0 | 13946 | 1 |
| C | 0 | 13924 | 1 |
| D | 0 | 15322 | 1 |
| Mode SS | |||
|---|---|---|---|
| Quadrant | BADHDUFLAG | Total packets | Discarded packets |
| A | 0 | 140 | 0 |
| B | 0 | 140 | 0 |
| C | 0 | 140 | 0 |
| D | 0 | 140 | 0 |
| Quadrant | Total seconds | Saturated seconds | Saturation percentage |
|---|---|---|---|
| A | 6779 | 175 | 2.581502% |
| B | 6780 | 201 | 2.964602% |
| C | 6780 | 230 | 3.392330% |
| D | 6780 | 173 | 2.551622% |
Noise dominated data is calculated using 1-second bins in cleaned event files. If a bin has >2000 counts, and if more than 50% of those come from <1% of pixels, then it is considered to be noise-dominated and hence unusable.
| Quadrant | # 1 sec bins | Bins with >0 counts | Bins with >2000 counts | High rate bins dominated by noise | Noise dominated (total time) | Noise dominated (detector-on time) | Marked lightcurve |
|---|---|---|---|---|---|---|---|
| A | 6959 | 6781 | 0 | 0 | 0.00% | 0.00% | 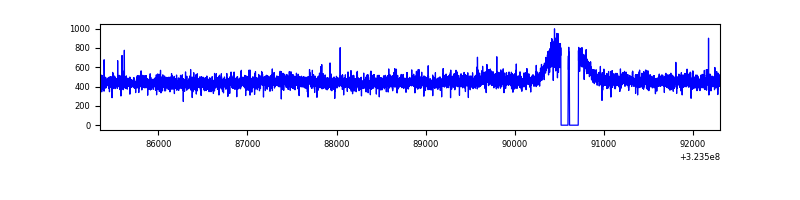 |
| B | 6960 | 6782 | 0 | 0 | 0.00% | 0.00% | 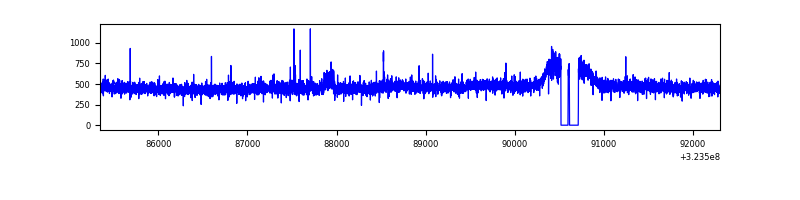 |
| C | 6960 | 6782 | 0 | 0 | 0.00% | 0.00% | 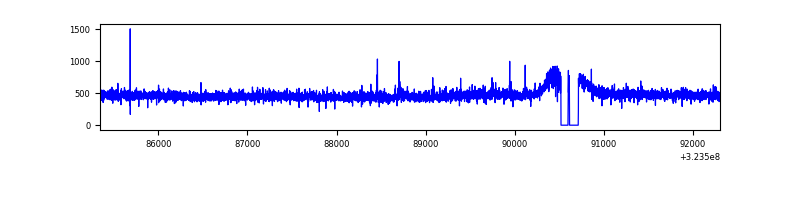 |
| D | 6960 | 6782 | 14 | 14 | 0.20% | 0.21% | 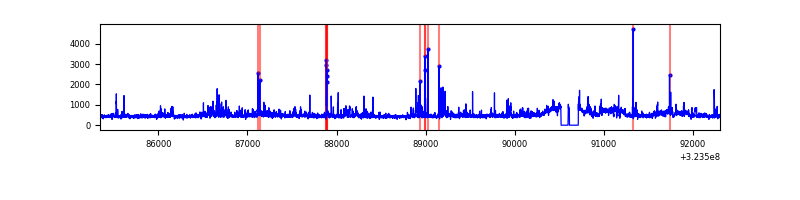 |
Top three noisy pixels from each quadrant. If the there are fewer than three noisy pixels in the level2.evt file, extra rows are filled as -1
| Pixel properties | Quadrant properties | ||||||
|---|---|---|---|---|---|---|---|
| Quadrant | DetID | PixID | Counts | Sigma | Mean | Median | Sigma |
| A | 13 | 254 | 10880 | 61.87 | 808 | 789 | 163.1 |
| A | 3 | 137 | 7523 | 41.29 | 808 | 789 | 163.1 |
| A | 0 | 226 | 6903 | 37.49 | 808 | 789 | 163.1 |
| B | 12 | 111 | 18940 | 118.52 | 803 | 783 | 153.2 |
| B | 0 | 190 | 17197 | 107.15 | 803 | 783 | 153.2 |
| B | 11 | 111 | 16915 | 105.31 | 803 | 783 | 153.2 |
| C | 14 | 238 | 121934 | 664.38 | 777 | 780 | 182.4 |
| C | 7 | 247 | 15153 | 78.82 | 777 | 780 | 182.4 |
| C | 3 | 233 | 14585 | 75.7 | 777 | 780 | 182.4 |
| D | 1 | 52 | 358607 | 1865.77 | 788 | 760 | 191.8 |
| D | 8 | 195 | 201041 | 1044.24 | 788 | 760 | 191.8 |
| D | 12 | 218 | 41024 | 209.93 | 788 | 760 | 191.8 |
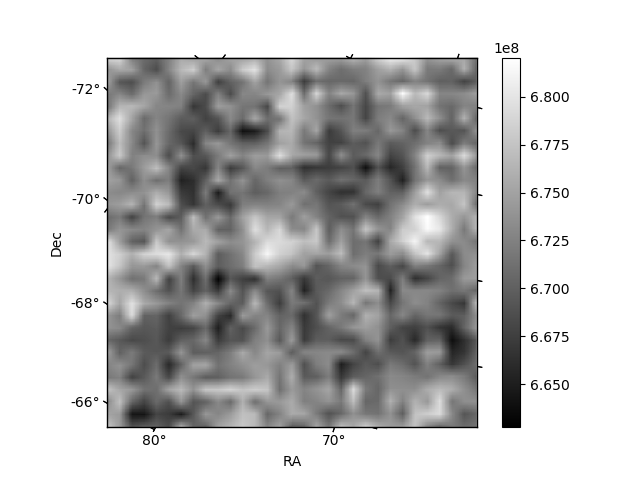
Histogram calculated using DETX and DETY for each event in the final _common_clean file
| Quadrant A | 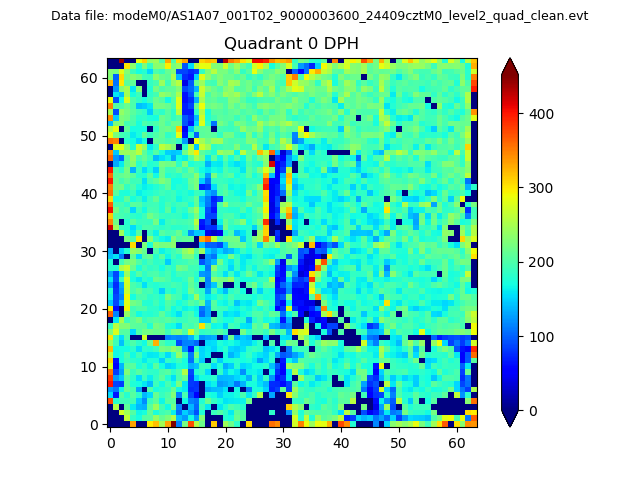 |
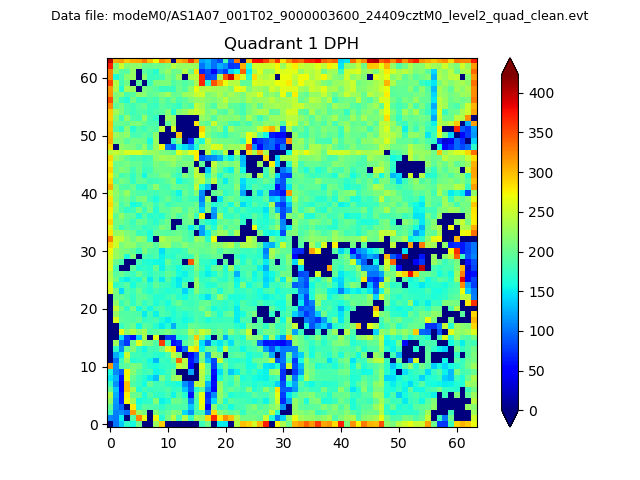 |
Quadrant B |
|---|---|---|---|
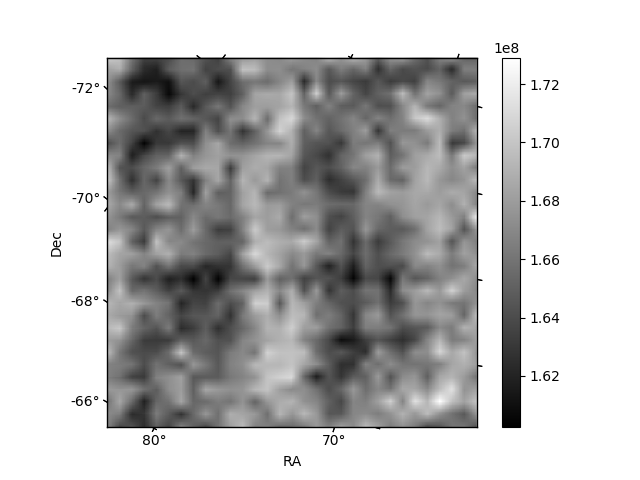
| Quadrant D |  |
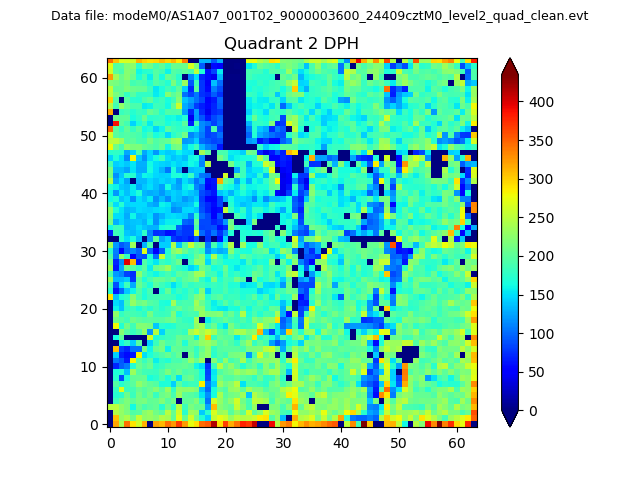 |
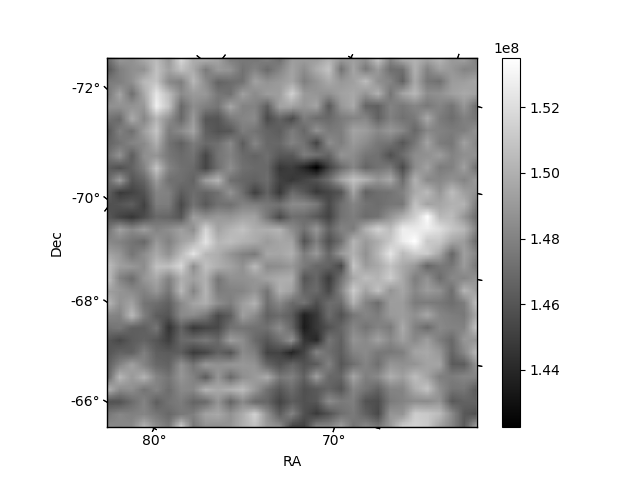
Quadrant C |
| Plot type | Count rate plots | Images |
|---|---|---|
| Comparison with Poisson distribution Blue bars denote a histogram of data divided into 1 sec bins. Red curve is a Poisson curve with rate = median count rate of data. |
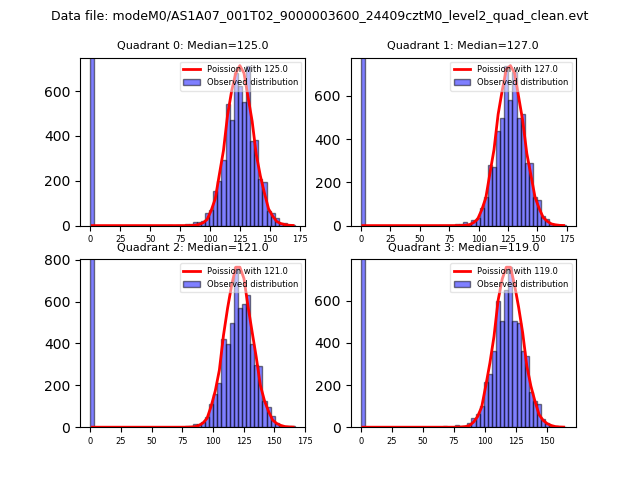 |
 |
| Quadrant-wise count rates Data is divided into 100 sec bins |
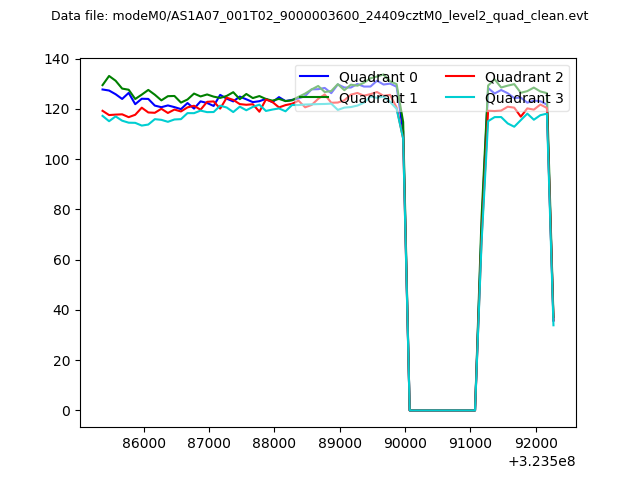 |
|
| Module-wise count rates for Quadrant A Data is divided into 100 sec bins |
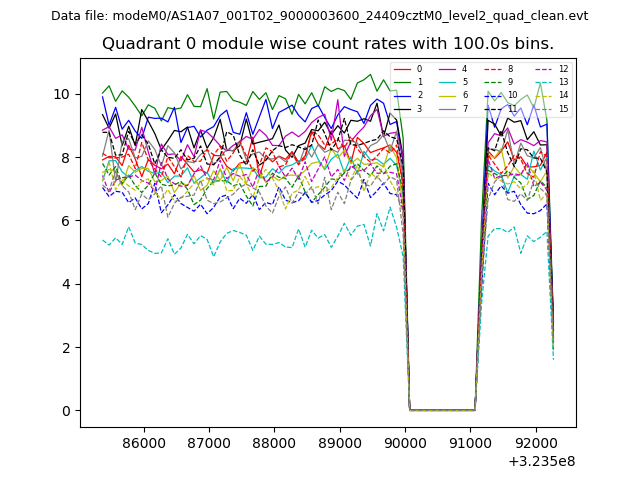 |
 |
| Module-wise count rates for Quadrant B Data is divided into 100 sec bins |
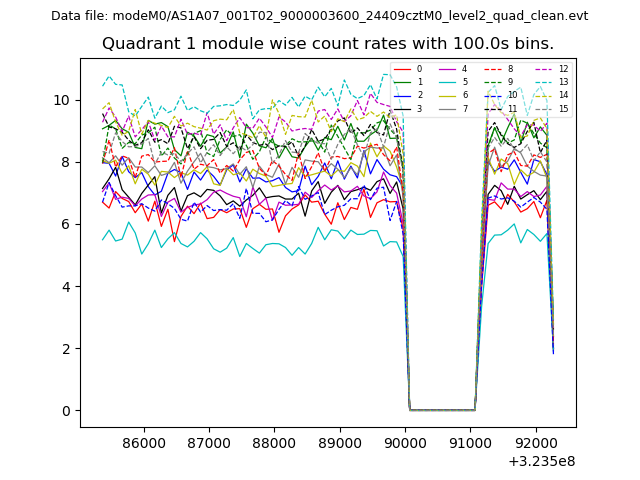 |
 |
| Module-wise count rates for Quadrant C Data is divided into 100 sec bins |
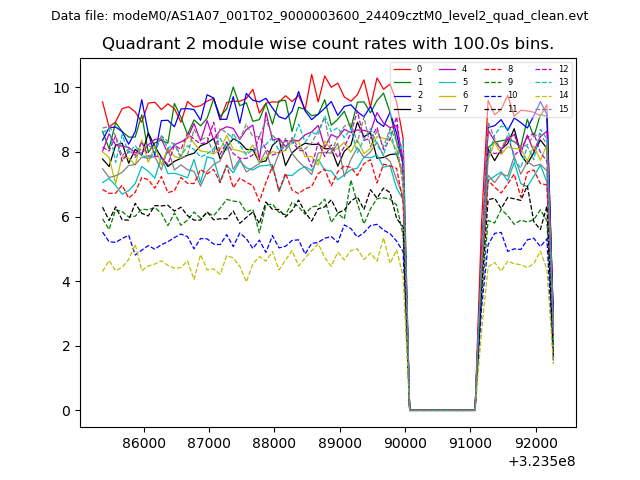 |
 |
| Module-wise count rates for Quadrant D Data is divided into 100 sec bins |
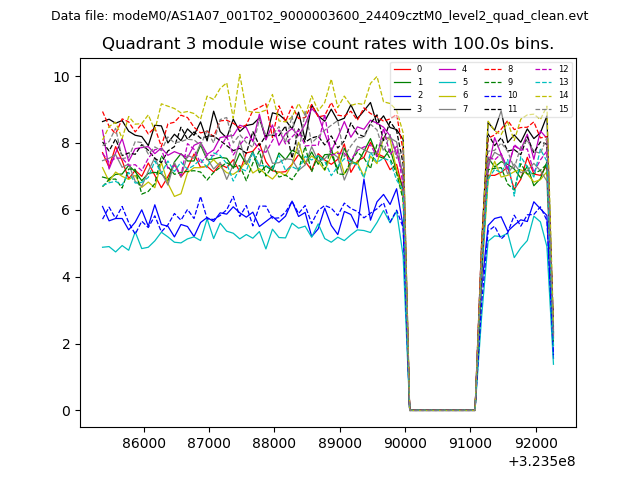 |
 |
| Parameter | Plot |
|---|---|
| CZT HV Monitor | 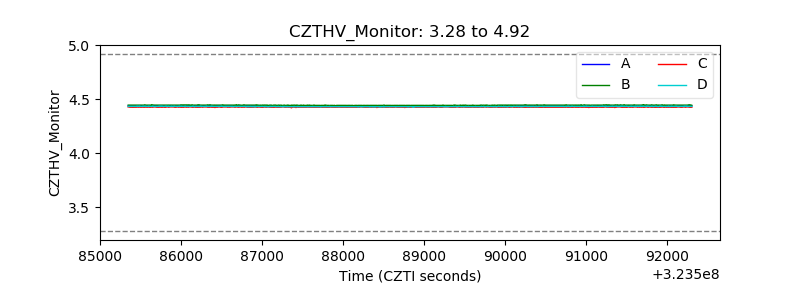 |
| D_VDD | 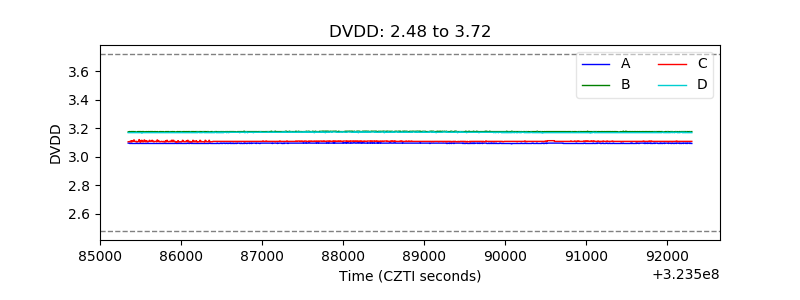 |
| Temperature 1 | 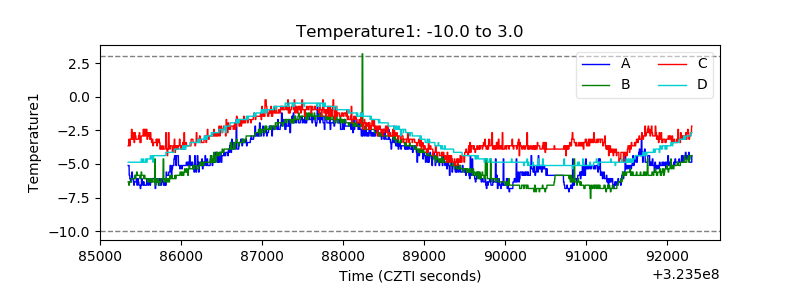 |
| Veto HV Monitor | 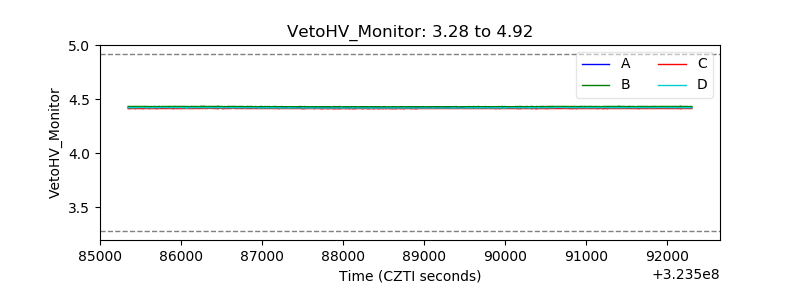 |
| Veto LLD | 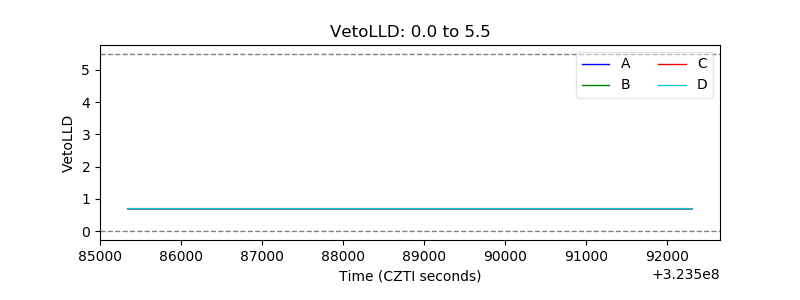 |
| Alpha Counter | 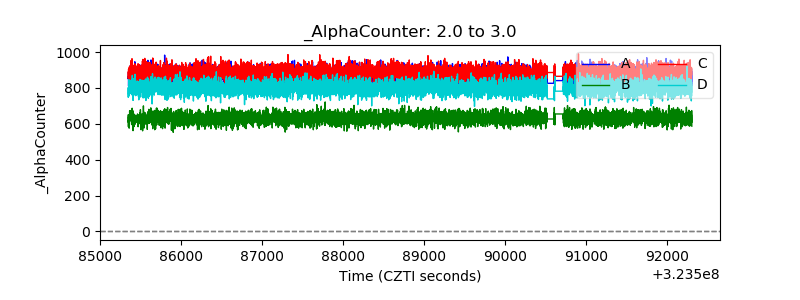 |
| _CPM_Rate | 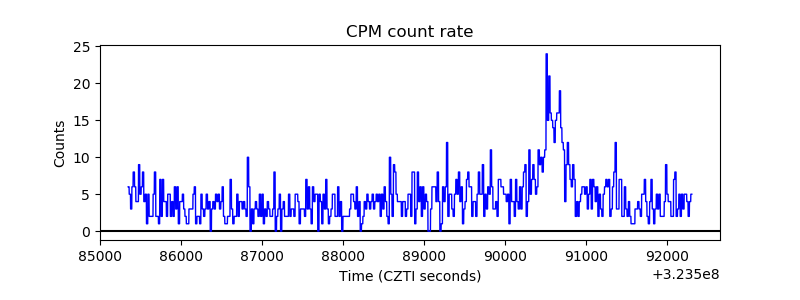 |
| CZT Counter | 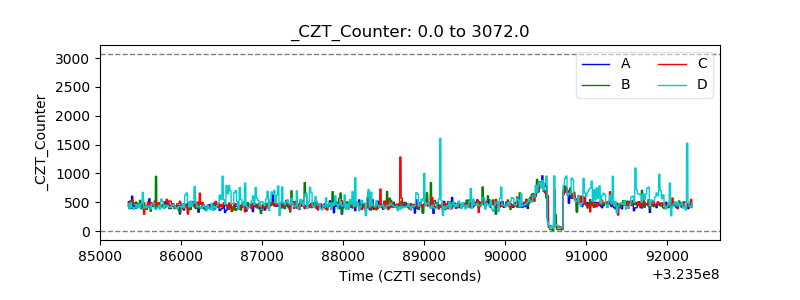 |
| +2.5 Volts monitor |  |
| +5 Volts monitor | 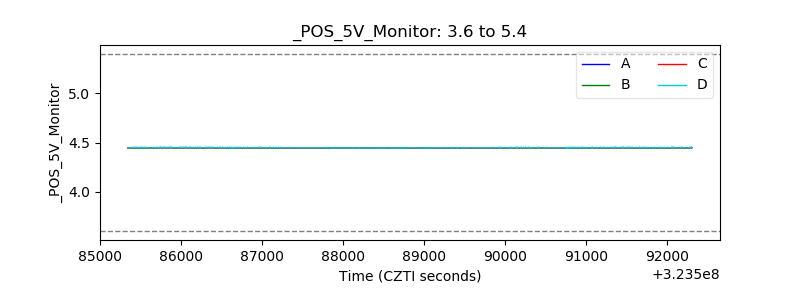 |
| _ROLL_ROT | 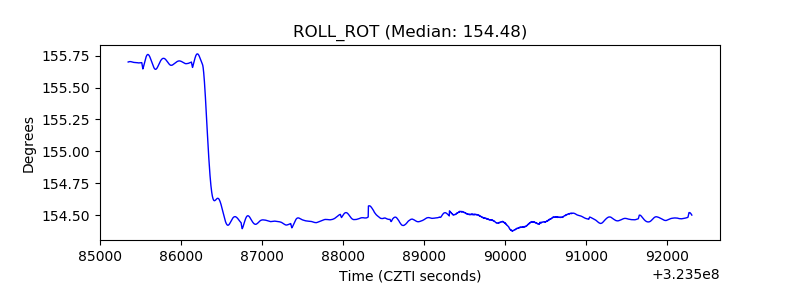 |
| _Roll_DEC | 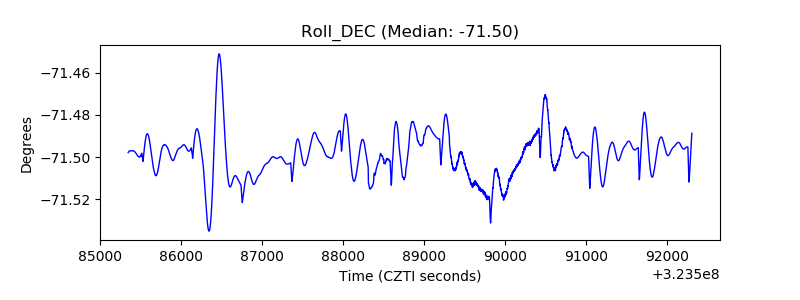 |
| _Roll_RA | 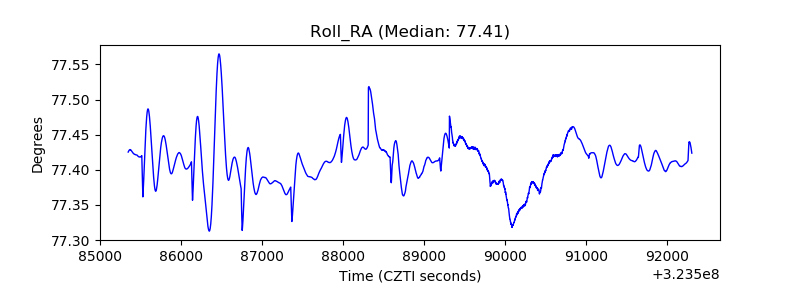 |
| Veto Counter | 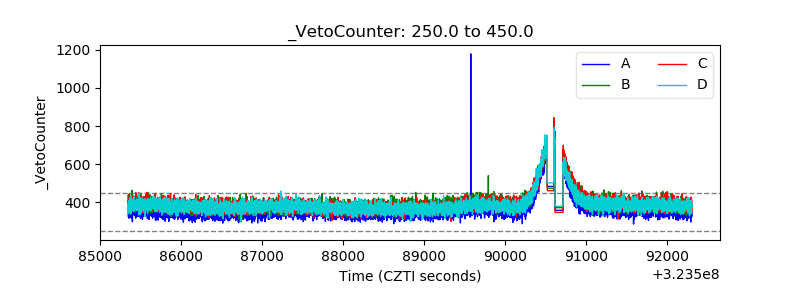 |