| Param | Original file | Final file |
|---|---|---|
| Filename | modeM0/AS1A07_001T02_9000003600_24410cztM0_level2.evt | modeM0/AS1A07_001T02_9000003600_24410cztM0_level2_quad_clean.evt |
| Size (bytes) | 269,435,520 | 73,716,480 |
| Size | 257.0 MB | 70.3 MB |
| Events in quadrant A | 1,813,111 | 492,187 |
| Events in quadrant B | 1,856,980 | 501,329 |
| Events in quadrant C | 1,833,238 | 480,309 |
| Events in quadrant D | 2,375,030 | 468,208 |
| Mode M0 | |||
|---|---|---|---|
| Quadrant | BADHDUFLAG | Total packets | Discarded packets |
| A | 0 | 8253 | 0 |
| B | 0 | 8333 | 0 |
| C | 0 | 8268 | 0 |
| D | 0 | 9874 | 0 |
| Mode SS | |||
|---|---|---|---|
| Quadrant | BADHDUFLAG | Total packets | Discarded packets |
| A | 0 | 82 | 0 |
| B | 0 | 82 | 0 |
| C | 0 | 82 | 0 |
| D | 0 | 82 | 0 |
| Quadrant | Total seconds | Saturated seconds | Saturation percentage |
|---|---|---|---|
| A | 4120 | 2 | 0.048544% |
| B | 4121 | 5 | 0.121330% |
| C | 4121 | 17 | 0.412521% |
| D | 4121 | 26 | 0.630915% |
Noise dominated data is calculated using 1-second bins in cleaned event files. If a bin has >2000 counts, and if more than 50% of those come from <1% of pixels, then it is considered to be noise-dominated and hence unusable.
| Quadrant | # 1 sec bins | Bins with >0 counts | Bins with >2000 counts | High rate bins dominated by noise | Noise dominated (total time) | Noise dominated (detector-on time) | Marked lightcurve |
|---|---|---|---|---|---|---|---|
| A | 4120 | 4120 | 0 | 0 | 0.00% | 0.00% | 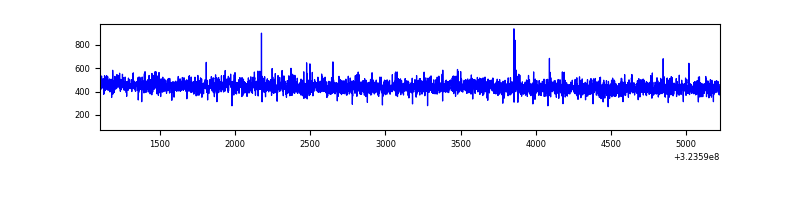 |
| B | 4121 | 4121 | 1 | 1 | 0.02% | 0.02% | 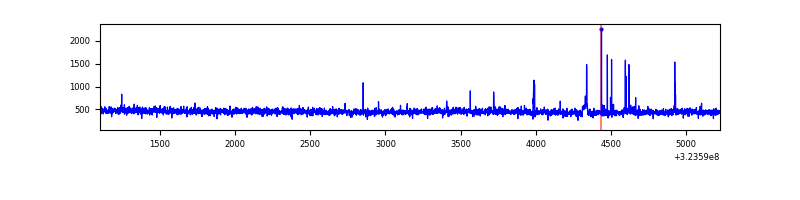 |
| C | 4121 | 4121 | 0 | 0 | 0.00% | 0.00% | 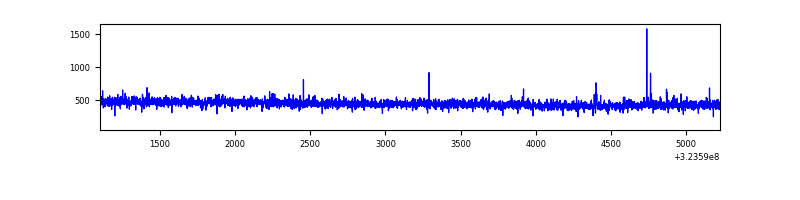 |
| D | 4121 | 4121 | 20 | 20 | 0.49% | 0.49% | 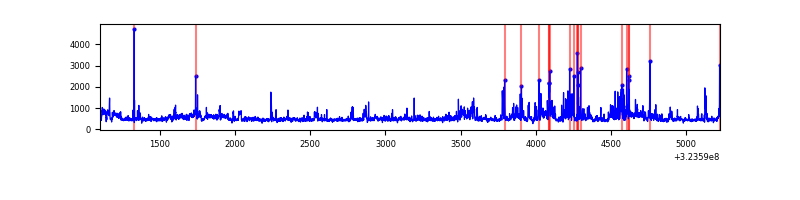 |
Top three noisy pixels from each quadrant. If the there are fewer than three noisy pixels in the level2.evt file, extra rows are filled as -1
| Pixel properties | Quadrant properties | ||||||
|---|---|---|---|---|---|---|---|
| Quadrant | DetID | PixID | Counts | Sigma | Mean | Median | Sigma |
| A | 13 | 254 | 6985 | 68.33 | 469 | 459 | 95.5 |
| A | 3 | 137 | 4198 | 39.15 | 469 | 459 | 95.5 |
| A | 0 | 226 | 4082 | 37.94 | 469 | 459 | 95.5 |
| B | 5 | 172 | 15746 | 171.3 | 464 | 452 | 89.3 |
| B | 4 | 52 | 13693 | 148.31 | 464 | 452 | 89.3 |
| B | 12 | 111 | 10618 | 113.86 | 464 | 452 | 89.3 |
| C | 14 | 238 | 71065 | 668.94 | 447 | 449 | 105.6 |
| C | 2 | 16 | 7491 | 66.71 | 447 | 449 | 105.6 |
| C | 7 | 247 | 6706 | 59.27 | 447 | 449 | 105.6 |
| D | 1 | 52 | 525403 | 4734.17 | 453 | 438 | 110.9 |
| D | 8 | 195 | 104859 | 941.68 | 453 | 438 | 110.9 |
| D | 2 | 234 | 22340 | 197.51 | 453 | 438 | 110.9 |
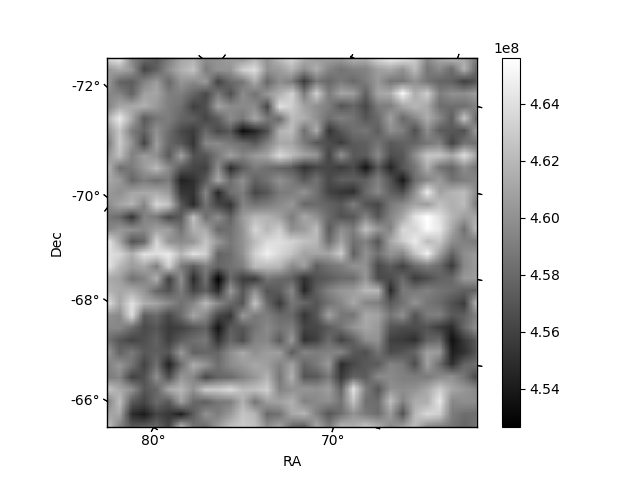
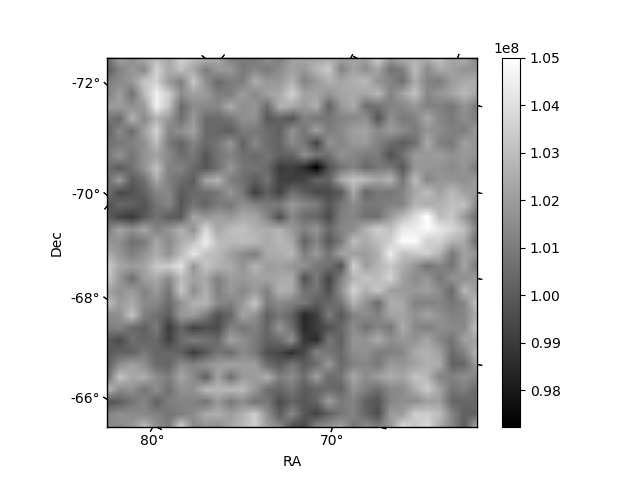
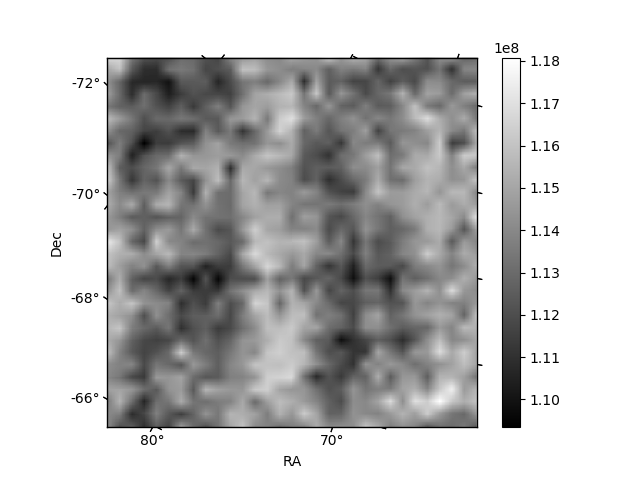
Histogram calculated using DETX and DETY for each event in the final _common_clean file
| Quadrant A | 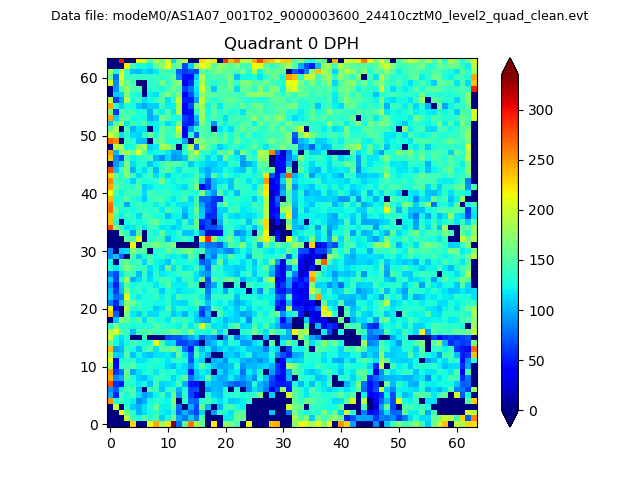 |
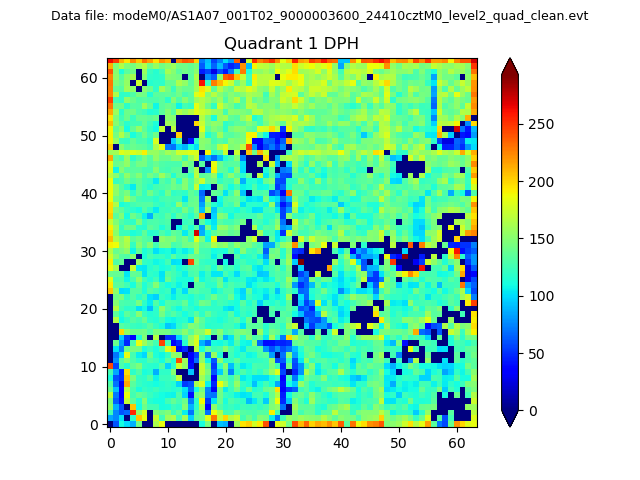 |
Quadrant B |
|---|---|---|---|
| Quadrant D | 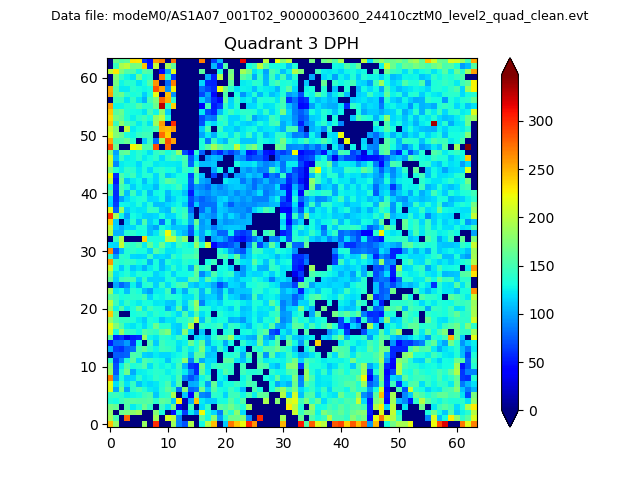 |
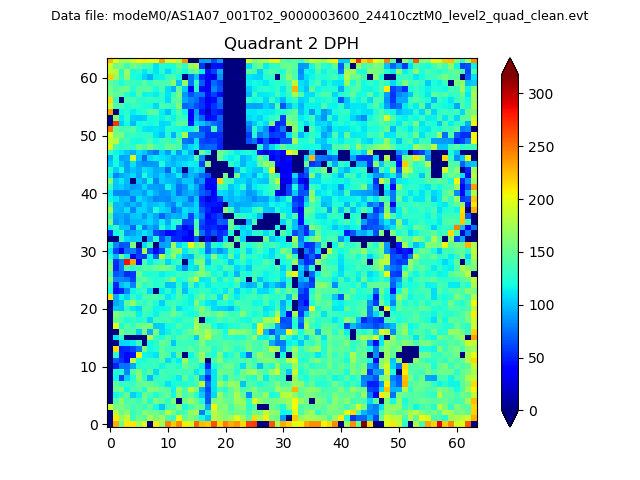 |
Quadrant C |
| Plot type | Count rate plots | Images |
|---|---|---|
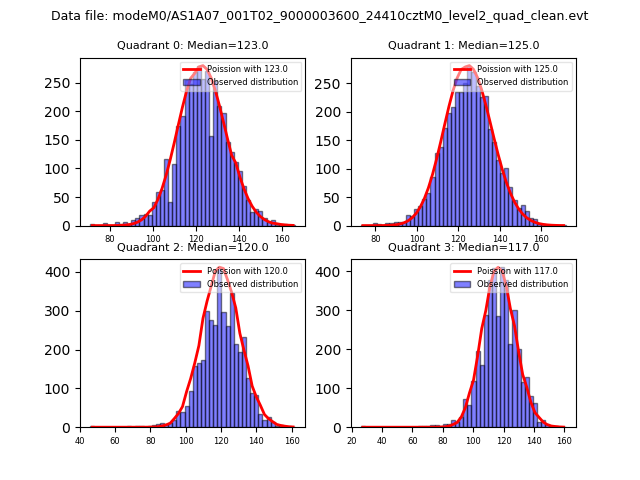
| Comparison with Poisson distribution Blue bars denote a histogram of data divided into 1 sec bins. Red curve is a Poisson curve with rate = median count rate of data. |
 |
 |
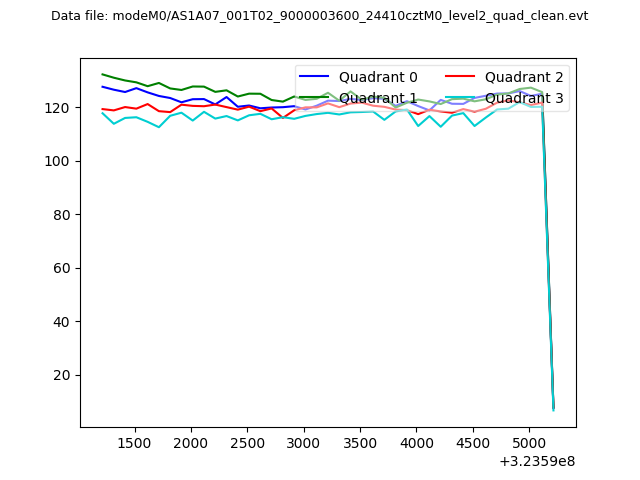
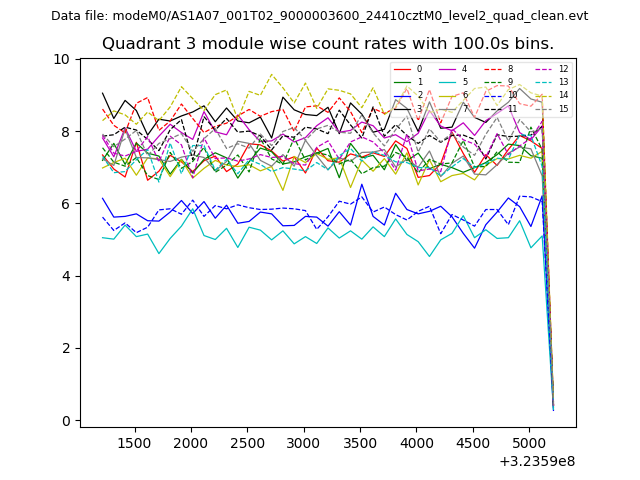
| Quadrant-wise count rates Data is divided into 100 sec bins |
 |
|
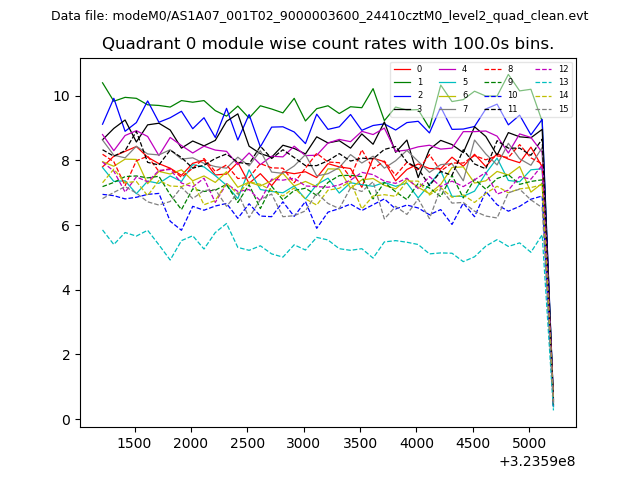
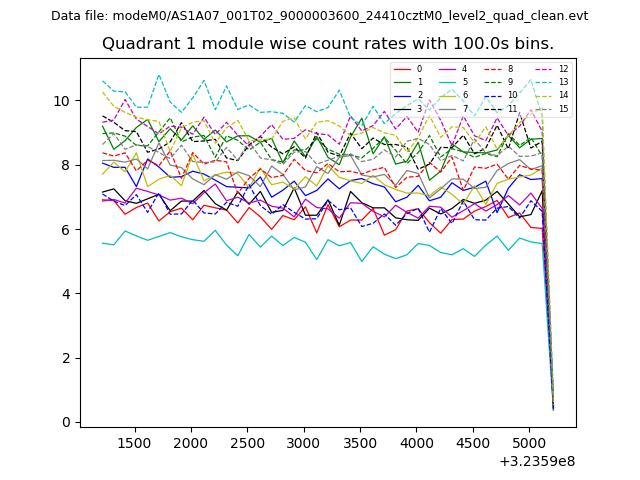
| Module-wise count rates for Quadrant A Data is divided into 100 sec bins |
 |
 |
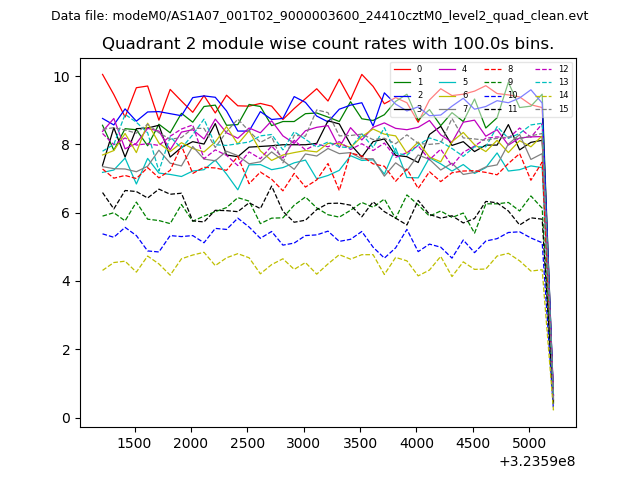
| Module-wise count rates for Quadrant B Data is divided into 100 sec bins |
 |
 |
| Module-wise count rates for Quadrant C Data is divided into 100 sec bins |
 |
 |
| Module-wise count rates for Quadrant D Data is divided into 100 sec bins |
 |
 |
| Parameter | Plot |
|---|---|
| CZT HV Monitor | 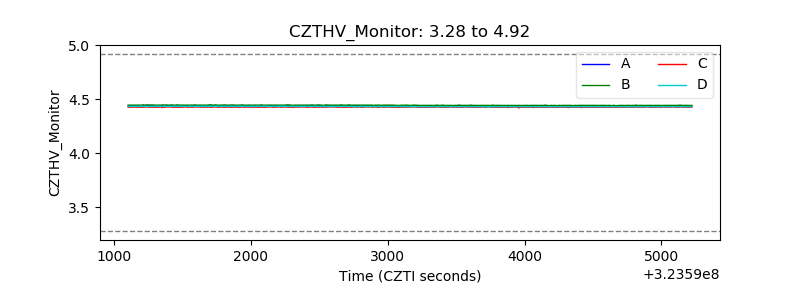 |
| D_VDD | 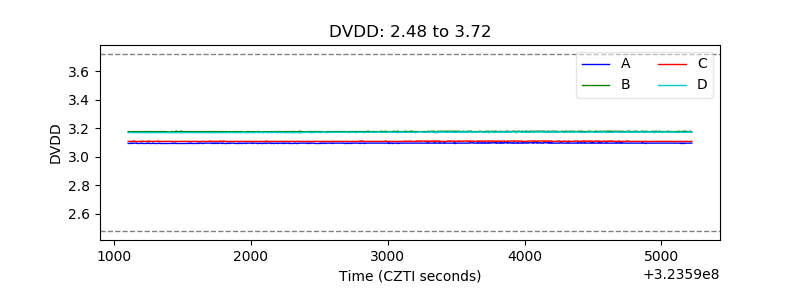 |
| Temperature 1 |  |
| Veto HV Monitor | 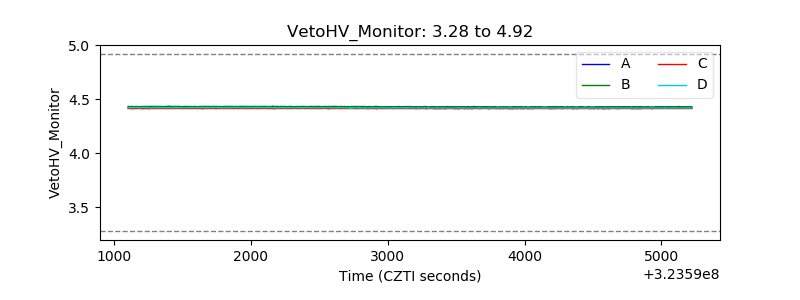 |
| Veto LLD | 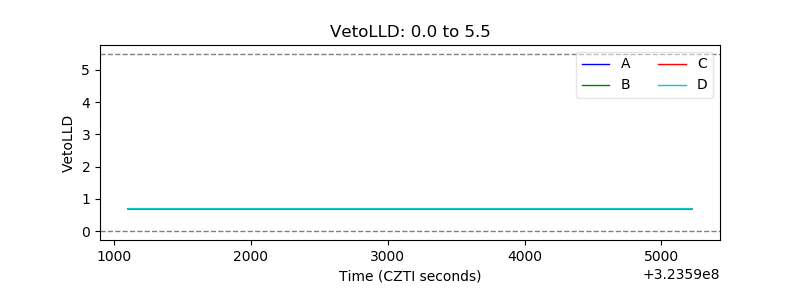 |
| Alpha Counter | 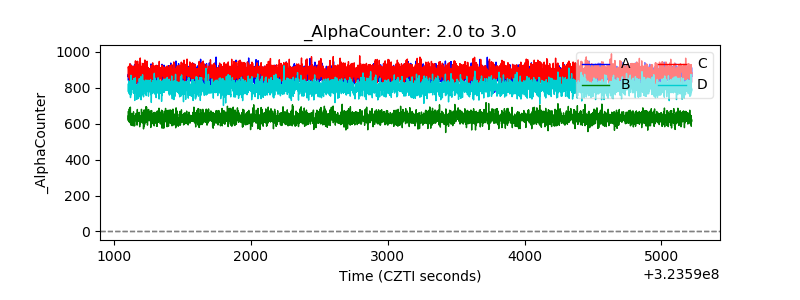 |
| _CPM_Rate | 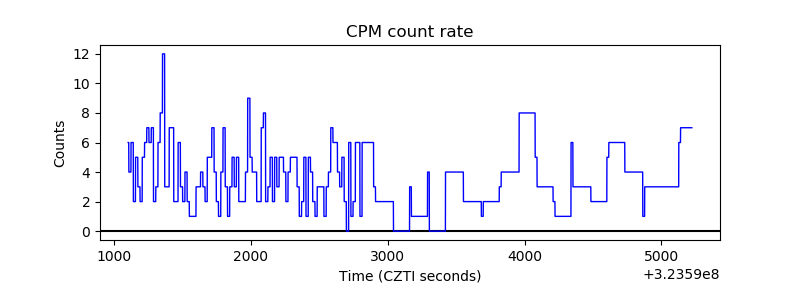 |
| CZT Counter | 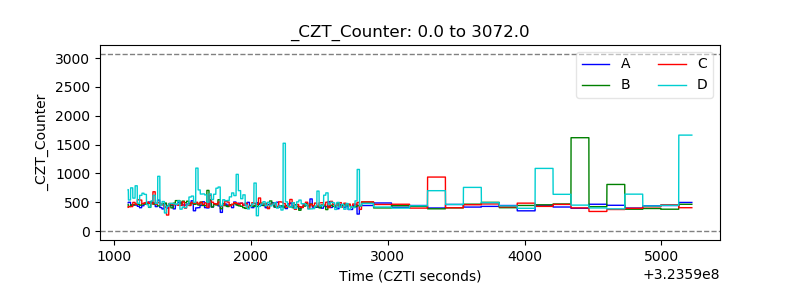 |
| +2.5 Volts monitor |  |
| +5 Volts monitor |  |
| _ROLL_ROT | 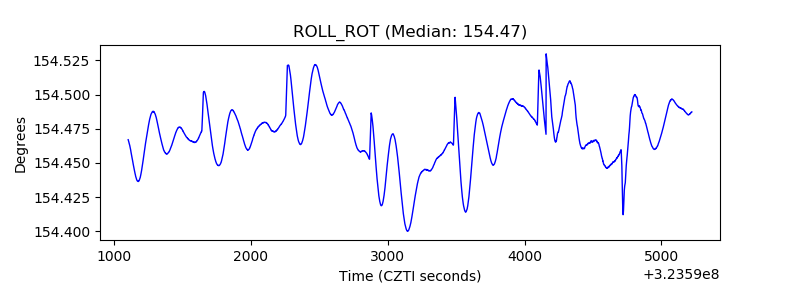 |
| _Roll_DEC |  |
| _Roll_RA | 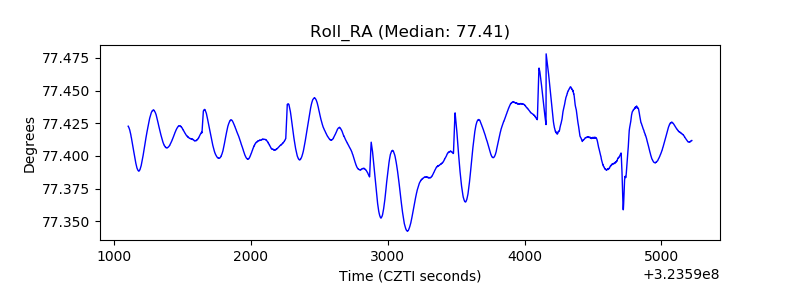 |
| Veto Counter | 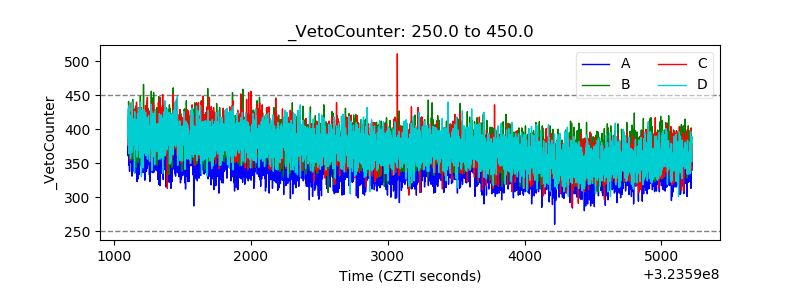 |