| Param | Original file | Final file |
|---|---|---|
| Filename | modeM0/AS1A07_001T03_9000003602cztM0_level2.fits | modeM0/AS1A07_001T03_9000003602cztM0_level2_quad_clean.evt |
| Size (bytes) | 146,188,800 | 164,738,880 |
| Size | 139.4 MB | 157.1 MB |
| Events in quadrant A | 884,706 | 1,021,359 |
| Events in quadrant B | 848,940 | 1,019,310 |
| Events in quadrant C | 859,270 | 977,829 |
| Events in quadrant D | 751,350 | 887,300 |
| Mode SS | |||
|---|---|---|---|
| Quadrant | BADHDUFLAG | Total packets | Discarded packets |
| A | 0 | 320 | 0 |
| B | 0 | 320 | 0 |
| C | 0 | 320 | 0 |
| D | 0 | 320 | 0 |
| Mode M9 | |||
|---|---|---|---|
| Quadrant | BADHDUFLAG | Total packets | Discarded packets |
| A | 0 | 16 | 0 |
| B | 0 | 16 | 0 |
| C | 0 | 16 | 0 |
| D | 0 | 16 | 0 |
| Mode M0 | |||
|---|---|---|---|
| Quadrant | BADHDUFLAG | Total packets | Discarded packets |
| A | 0 | 31829 | 0 |
| B | 0 | 32083 | 0 |
| C | 0 | 31927 | 0 |
| D | 0 | 38280 | 0 |
| Quadrant | Total seconds | Saturated seconds | Saturation percentage |
|---|---|---|---|
| A | 15699 | 177 | 1.127460% |
| B | 15699 | 214 | 1.363144% |
| C | 15699 | 270 | 1.719855% |
| D | 15699 | 380 | 2.420536% |
Noise dominated data is calculated using 1-second bins in cleaned event files. If a bin has >2000 counts, and if more than 50% of those come from <1% of pixels, then it is considered to be noise-dominated and hence unusable.
| Quadrant | # 1 sec bins | Bins with >0 counts | Bins with >2000 counts | High rate bins dominated by noise | Noise dominated (total time) | Noise dominated (detector-on time) | Marked lightcurve |
|---|---|---|---|---|---|---|---|
| A | 17304 | 15699 | 0 | 0 | 0.00% | 0.00% |  |
| B | 17304 | 15699 | 0 | 0 | 0.00% | 0.00% |  |
| C | 17304 | 15699 | 0 | 0 | 0.00% | 0.00% |  |
| D | 17304 | 15694 | 0 | 0 | 0.00% | 0.00% |  |
Top three noisy pixels from each quadrant. If the there are fewer than three noisy pixels in the level2.evt file, extra rows are filled as -1
| Pixel properties | Quadrant properties | ||||||
|---|---|---|---|---|---|---|---|
| Quadrant | DetID | PixID | Counts | Sigma | Mean | Median | Sigma |
| A | 0 | 29 | 861 | 10.78 | 230 | 215 | 59.9 |
| A | 7 | 110 | 698 | 8.06 | 230 | 215 | 59.9 |
| A | 9 | 19 | 662 | 7.46 | 230 | 215 | 59.9 |
| B | 2 | 9 | 695 | 10.31 | 224 | 213 | 46.7 |
| B | 2 | 8 | 584 | 7.94 | 224 | 213 | 46.7 |
| B | 3 | 17 | 584 | 7.94 | 224 | 213 | 46.7 |
| C | 12 | 241 | 602 | 6.53 | 226 | 212 | 59.7 |
| C | 3 | 126 | 593 | 6.38 | 226 | 212 | 59.7 |
| C | 9 | 242 | 593 | 6.38 | 226 | 212 | 59.7 |
| D | 6 | 231 | 554 | 6.04 | 214 | 194 | 59.6 |
| D | 7 | 3 | 542 | 5.84 | 214 | 194 | 59.6 |
| D | 15 | 46 | 539 | 5.79 | 214 | 194 | 59.6 |
Histogram calculated using DETX and DETY for each event in the final _common_clean file
| Quadrant A |  |
 |
Quadrant B |
|---|---|---|---|
| Quadrant D |  |
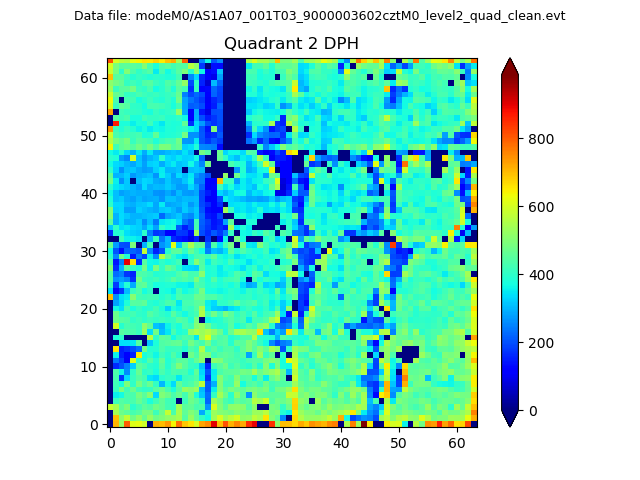 |
Quadrant C |
| Plot type | Count rate plots | Images |
|---|---|---|
| Comparison with Poisson distribution Blue bars denote a histogram of data divided into 1 sec bins. Red curve is a Poisson curve with rate = median count rate of data. |
 |
 |
| Quadrant-wise count rates Data is divided into 100 sec bins |
 |
|
| Module-wise count rates for Quadrant A Data is divided into 100 sec bins |
 |
 |
| Module-wise count rates for Quadrant B Data is divided into 100 sec bins |
 |
 |
| Module-wise count rates for Quadrant C Data is divided into 100 sec bins |
 |
 |
| Module-wise count rates for Quadrant D Data is divided into 100 sec bins |
 |
 |
| Parameter | Plot |
|---|---|
| CZT HV Monitor |  |
| D_VDD | 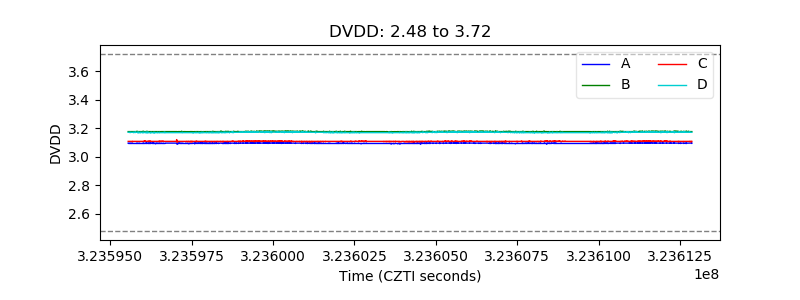 |
| Temperature 1 |  |
| Veto HV Monitor |  |
| Veto LLD |  |
| Alpha Counter |  |
| _CPM_Rate |  |
| CZT Counter |  |
| +2.5 Volts monitor |  |
| +5 Volts monitor |  |
| _ROLL_ROT |  |
| _Roll_DEC |  |
| _Roll_RA |  |
| Veto Counter |  |