| Param | Original file | Final file |
|---|---|---|
| Filename | modeM0/AS1A07_054T01_9000003604cztM0_level2.fits | modeM0/AS1A07_054T01_9000003604cztM0_level2_quad_clean.evt |
| Size (bytes) | 668,255,040 | 839,652,480 |
| Size | 637.3 MB | 800.8 MB |
| Events in quadrant A | 4,171,524 | 5,591,458 |
| Events in quadrant B | 3,996,064 | 5,621,184 |
| Events in quadrant C | 4,113,870 | 5,397,110 |
| Events in quadrant D | 3,138,394 | 4,008,533 |
| Mode M0 | |||
|---|---|---|---|
| Quadrant | BADHDUFLAG | Total packets | Discarded packets |
| A | 0 | 144256 | 0 |
| B | 0 | 149322 | 0 |
| C | 0 | 147520 | 0 |
| D | 0 | 247626 | 0 |
| Mode M9 | |||
|---|---|---|---|
| Quadrant | BADHDUFLAG | Total packets | Discarded packets |
| A | 0 | 114 | 0 |
| B | 0 | 114 | 0 |
| C | 0 | 114 | 0 |
| D | 0 | 114 | 0 |
| Mode SS | |||
|---|---|---|---|
| Quadrant | BADHDUFLAG | Total packets | Discarded packets |
| A | 0 | 1430 | 0 |
| B | 0 | 1430 | 0 |
| C | 0 | 1430 | 0 |
| D | 0 | 1430 | 0 |
| Quadrant | Total seconds | Saturated seconds | Saturation percentage |
|---|---|---|---|
| A | 70191 | 541 | 0.770754% |
| B | 70191 | 966 | 1.376245% |
| C | 70191 | 874 | 1.245174% |
| D | 70191 | 11919 | 16.980810% |
Noise dominated data is calculated using 1-second bins in cleaned event files. If a bin has >2000 counts, and if more than 50% of those come from <1% of pixels, then it is considered to be noise-dominated and hence unusable.
| Quadrant | # 1 sec bins | Bins with >0 counts | Bins with >2000 counts | High rate bins dominated by noise | Noise dominated (total time) | Noise dominated (detector-on time) | Marked lightcurve |
|---|---|---|---|---|---|---|---|
| A | 81561 | 70191 | 0 | 0 | 0.00% | 0.00% |  |
| B | 81561 | 70190 | 0 | 0 | 0.00% | 0.00% |  |
| C | 81561 | 70191 | 0 | 0 | 0.00% | 0.00% |  |
| D | 81560 | 68923 | 0 | 0 | 0.00% | 0.00% | 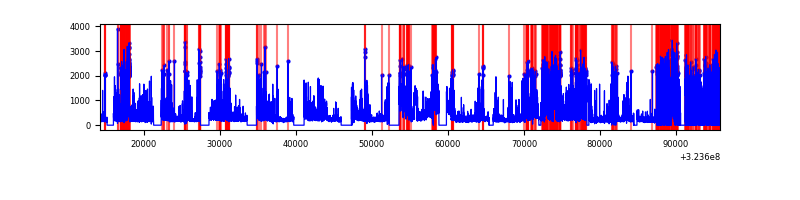 |
Top three noisy pixels from each quadrant. If the there are fewer than three noisy pixels in the level2.evt file, extra rows are filled as -1
| Pixel properties | Quadrant properties | ||||||
|---|---|---|---|---|---|---|---|
| Quadrant | DetID | PixID | Counts | Sigma | Mean | Median | Sigma |
| A | 0 | 29 | 4039 | 11.21 | 1084 | 1020 | 269.3 |
| A | 7 | 110 | 3347 | 8.64 | 1084 | 1020 | 269.3 |
| A | 9 | 19 | 3158 | 7.94 | 1084 | 1020 | 269.3 |
| B | 2 | 9 | 3254 | 10.89 | 1059 | 1015 | 205.6 |
| B | 2 | 8 | 2805 | 8.7 | 1059 | 1015 | 205.6 |
| B | 3 | 17 | 2620 | 7.8 | 1059 | 1015 | 205.6 |
| C | 12 | 241 | 2979 | 7.06 | 1086 | 1021 | 277.5 |
| C | 3 | 126 | 2920 | 6.84 | 1086 | 1021 | 277.5 |
| C | 9 | 209 | 2743 | 6.21 | 1086 | 1021 | 277.5 |
| D | 15 | 46 | 2310 | 6.17 | 897 | 818 | 241.9 |
| D | 3 | 14 | 2283 | 6.06 | 897 | 818 | 241.9 |
| D | 6 | 231 | 2212 | 5.76 | 897 | 818 | 241.9 |
Histogram calculated using DETX and DETY for each event in the final _common_clean file
| Quadrant A |  |
 |
Quadrant B |
|---|---|---|---|
| Quadrant D |  |
 |
Quadrant C |
| Plot type | Count rate plots | Images |
|---|---|---|
| Comparison with Poisson distribution Blue bars denote a histogram of data divided into 1 sec bins. Red curve is a Poisson curve with rate = median count rate of data. |
 |
 |
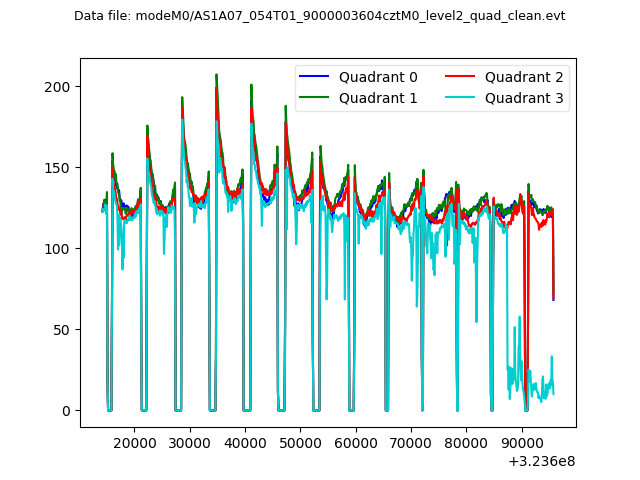
| Quadrant-wise count rates Data is divided into 100 sec bins |
 |
|
| Module-wise count rates for Quadrant A Data is divided into 100 sec bins |
 |
 |
| Module-wise count rates for Quadrant B Data is divided into 100 sec bins |
 |
 |
| Module-wise count rates for Quadrant C Data is divided into 100 sec bins |
 |
 |
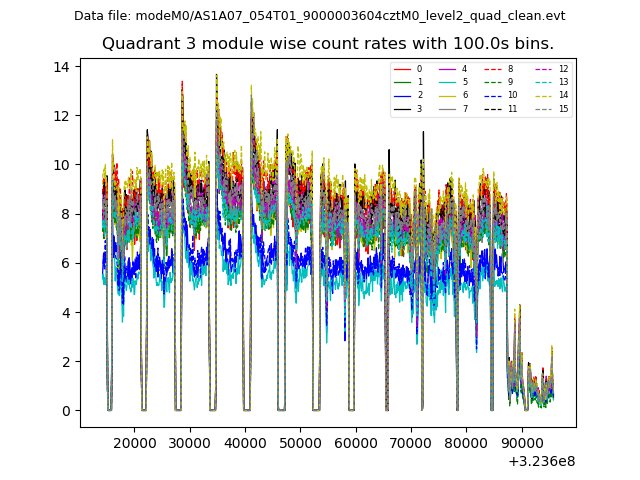
| Module-wise count rates for Quadrant D Data is divided into 100 sec bins |
 |
 |
| Parameter | Plot |
|---|---|
| CZT HV Monitor |  |
| D_VDD | 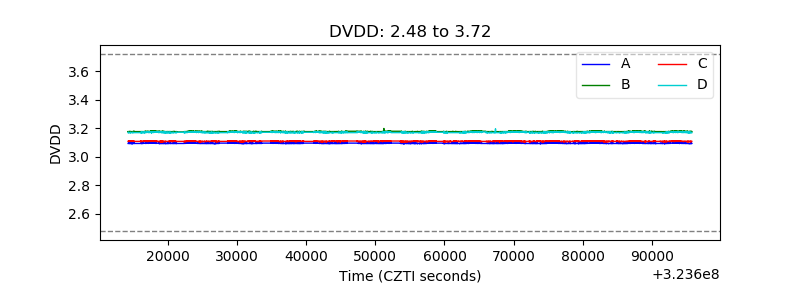 |
| Temperature 1 |  |
| Veto HV Monitor |  |
| Veto LLD |  |
| Alpha Counter |  |
| _CPM_Rate | 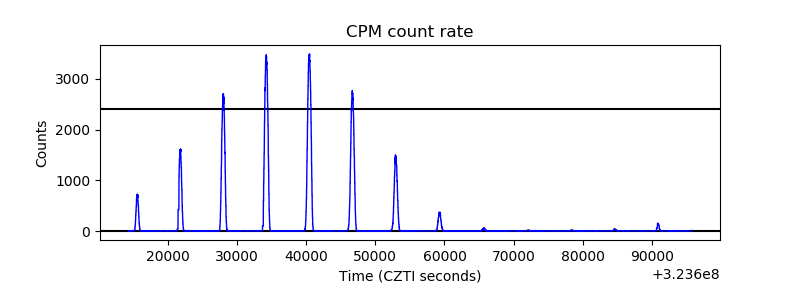 |
| CZT Counter |  |
| +2.5 Volts monitor |  |
| +5 Volts monitor |  |
| _ROLL_ROT |  |
| _Roll_DEC |  |
| _Roll_RA |  |
| Veto Counter |  |