| Param | Original file | Final file |
|---|---|---|
| Filename | modeM0/AS1A07_054T01_9000003604_24413cztM0_level2.evt | modeM0/AS1A07_054T01_9000003604_24413cztM0_level2_quad_clean.evt |
| Size (bytes) | 185,244,480 | 47,445,120 |
| Size | 176.7 MB | 45.2 MB |
| Events in quadrant A | 1,219,350 | 324,915 |
| Events in quadrant B | 1,356,208 | 329,517 |
| Events in quadrant C | 1,215,491 | 311,207 |
| Events in quadrant D | 1,654,169 | 298,572 |
| Mode M0 | |||
|---|---|---|---|
| Quadrant | BADHDUFLAG | Total packets | Discarded packets |
| A | 0 | 5018 | 1 |
| B | 0 | 5450 | 2 |
| C | 0 | 5000 | 1 |
| D | 0 | 6481 | 1 |
| Mode M9 | |||
|---|---|---|---|
| Quadrant | BADHDUFLAG | Total packets | Discarded packets |
| A | 0 | 9 | 0 |
| B | 0 | 9 | 0 |
| C | 0 | 9 | 0 |
| D | 0 | 9 | 0 |
| Mode SS | |||
|---|---|---|---|
| Quadrant | BADHDUFLAG | Total packets | Discarded packets |
| A | 0 | 48 | 0 |
| B | 0 | 48 | 0 |
| C | 0 | 48 | 0 |
| D | 0 | 48 | 0 |
| Quadrant | Total seconds | Saturated seconds | Saturation percentage |
|---|---|---|---|
| A | 2401 | 57 | 2.374011% |
| B | 2400 | 44 | 1.833333% |
| C | 2400 | 67 | 2.791667% |
| D | 2400 | 221 | 9.208333% |
Noise dominated data is calculated using 1-second bins in cleaned event files. If a bin has >2000 counts, and if more than 50% of those come from <1% of pixels, then it is considered to be noise-dominated and hence unusable.
| Quadrant | # 1 sec bins | Bins with >0 counts | Bins with >2000 counts | High rate bins dominated by noise | Noise dominated (total time) | Noise dominated (detector-on time) | Marked lightcurve |
|---|---|---|---|---|---|---|---|
| A | 3246 | 2402 | 0 | 0 | 0.00% | 0.00% | 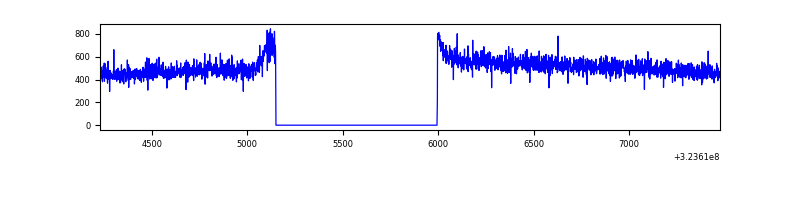 |
| B | 3245 | 2401 | 1 | 1 | 0.03% | 0.04% | 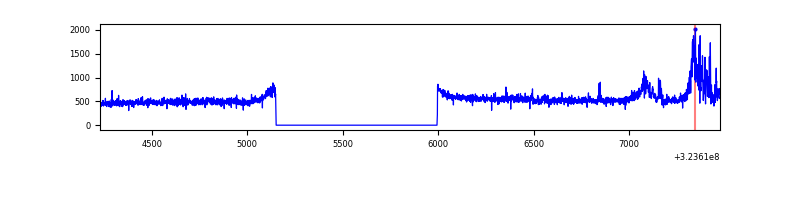 |
| C | 3245 | 2401 | 0 | 0 | 0.00% | 0.00% | 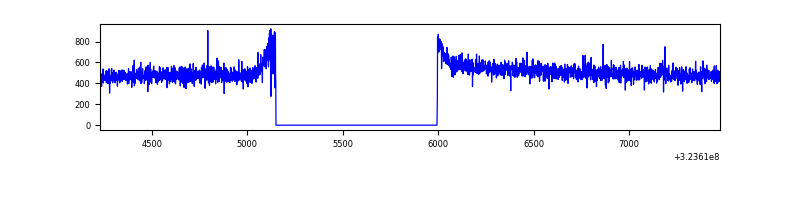 |
| D | 3245 | 2401 | 155 | 155 | 4.78% | 6.46% |  |
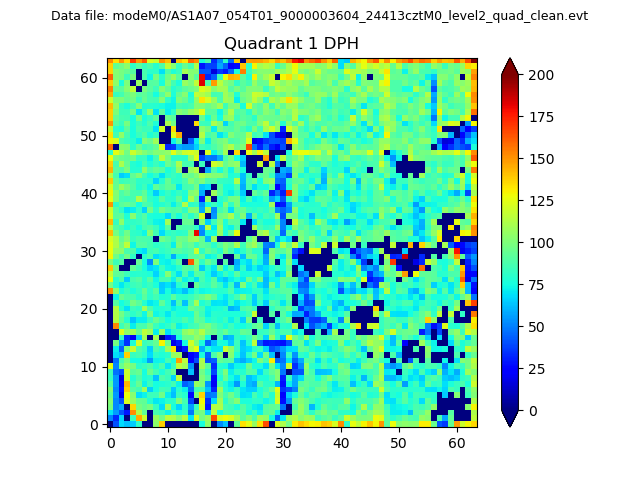
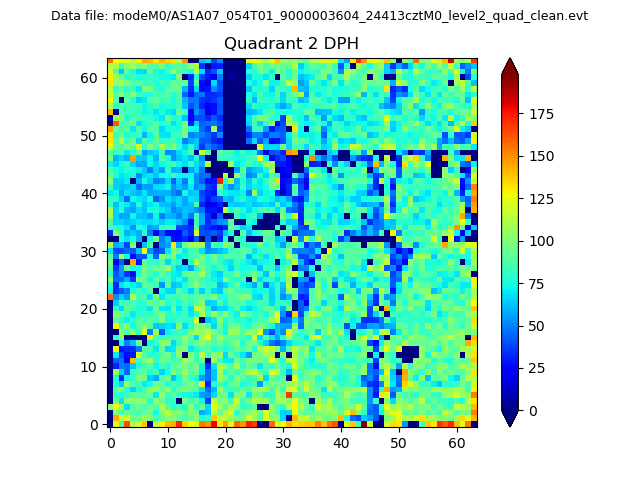
Top three noisy pixels from each quadrant. If the there are fewer than three noisy pixels in the level2.evt file, extra rows are filled as -1
| Pixel properties | Quadrant properties | ||||||
|---|---|---|---|---|---|---|---|
| Quadrant | DetID | PixID | Counts | Sigma | Mean | Median | Sigma |
| A | 13 | 254 | 3942 | 55.94 | 316 | 308 | 65.0 |
| A | 3 | 137 | 2869 | 39.43 | 316 | 308 | 65.0 |
| A | 0 | 226 | 2748 | 37.56 | 316 | 308 | 65.0 |
| B | 15 | 33 | 84905 | 1361.27 | 313 | 304 | 62.1 |
| B | 0 | 190 | 37747 | 602.47 | 313 | 304 | 62.1 |
| B | 4 | 171 | 8995 | 139.84 | 313 | 304 | 62.1 |
| C | 14 | 238 | 47820 | 667.65 | 298 | 298 | 71.2 |
| C | 7 | 247 | 2626 | 32.71 | 298 | 298 | 71.2 |
| C | 13 | 61 | 2225 | 27.07 | 298 | 298 | 71.2 |
| D | 1 | 52 | 478171 | 6448.52 | 298 | 288 | 74.1 |
| D | 9 | 1 | 35732 | 478.28 | 298 | 288 | 74.1 |
| D | 2 | 234 | 9720 | 127.27 | 298 | 288 | 74.1 |
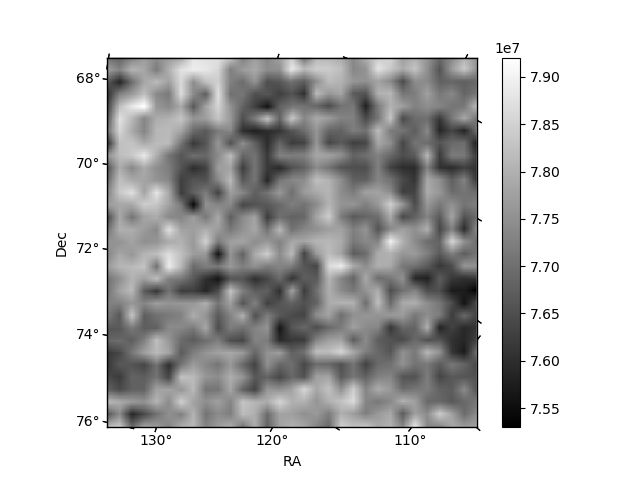
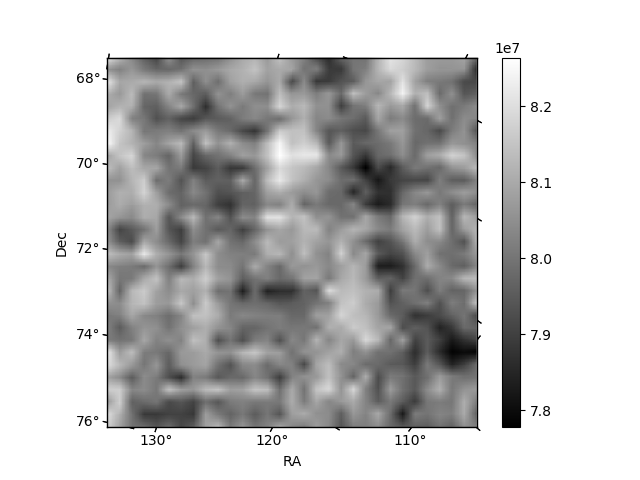
Histogram calculated using DETX and DETY for each event in the final _common_clean file
| Quadrant A | 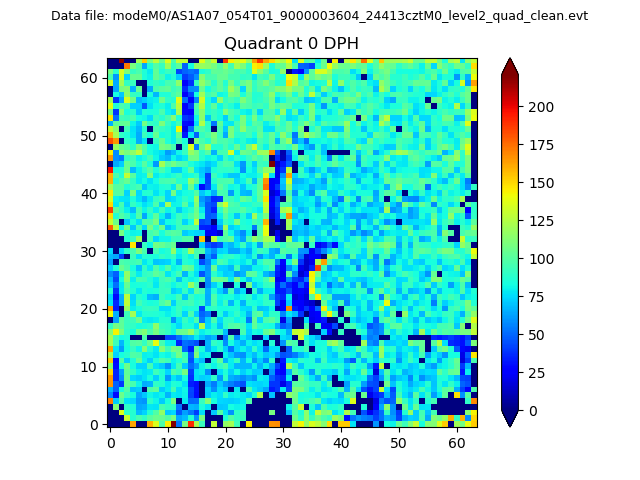 |
 |
Quadrant B |
|---|---|---|---|
| Quadrant D | 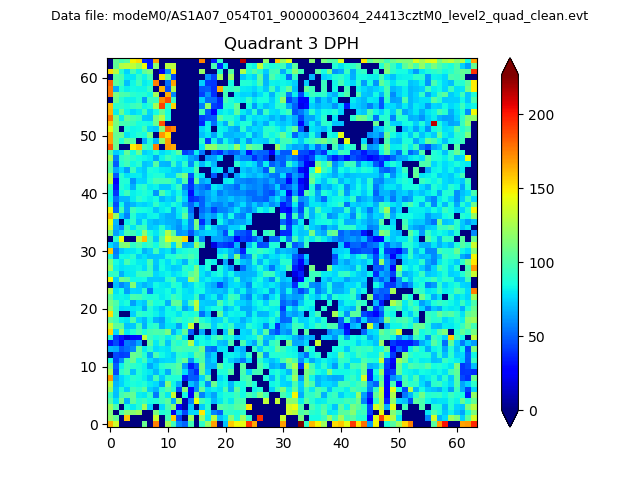 |
 |
Quadrant C |
| Plot type | Count rate plots | Images |
|---|---|---|
| Comparison with Poisson distribution Blue bars denote a histogram of data divided into 1 sec bins. Red curve is a Poisson curve with rate = median count rate of data. |
 |
 |
| Quadrant-wise count rates Data is divided into 100 sec bins |
 |
|
| Module-wise count rates for Quadrant A Data is divided into 100 sec bins |
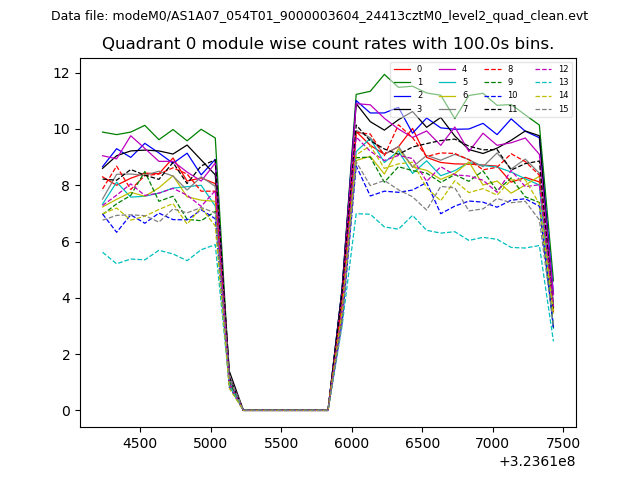 |
 |
| Module-wise count rates for Quadrant B Data is divided into 100 sec bins |
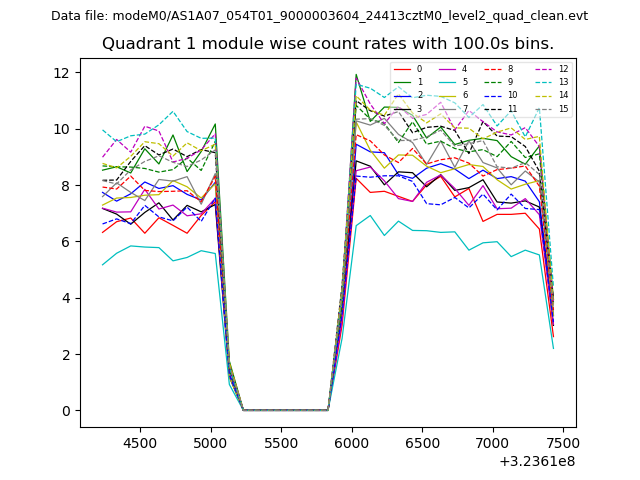 |
 |
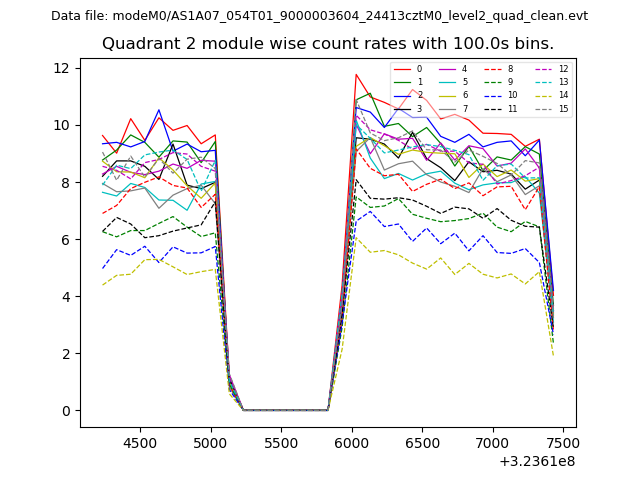
| Module-wise count rates for Quadrant C Data is divided into 100 sec bins |
 |
 |
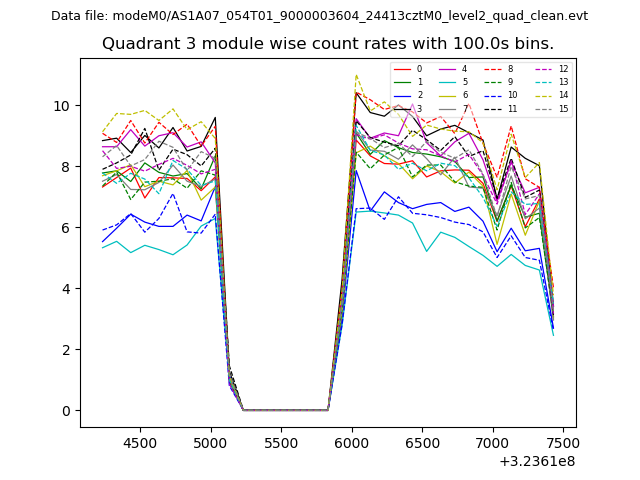
| Module-wise count rates for Quadrant D Data is divided into 100 sec bins |
 |
 |
| Parameter | Plot |
|---|---|
| CZT HV Monitor | 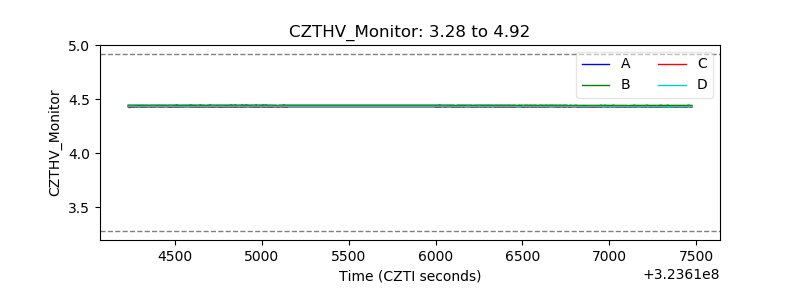 |
| D_VDD | 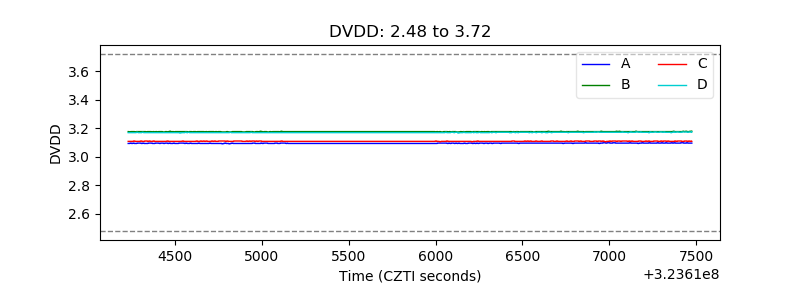 |
| Temperature 1 | 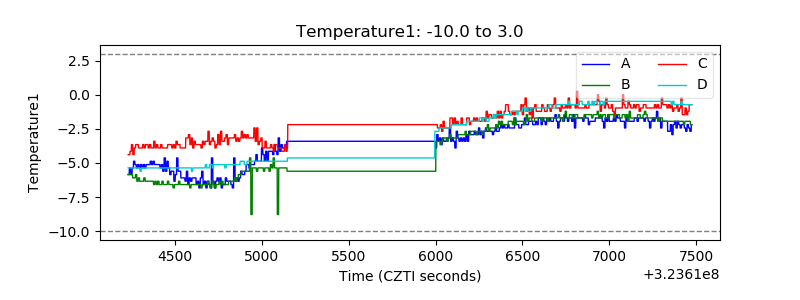 |
| Veto HV Monitor | 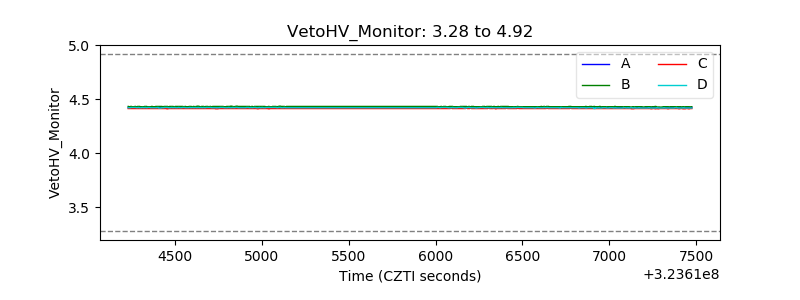 |
| Veto LLD | 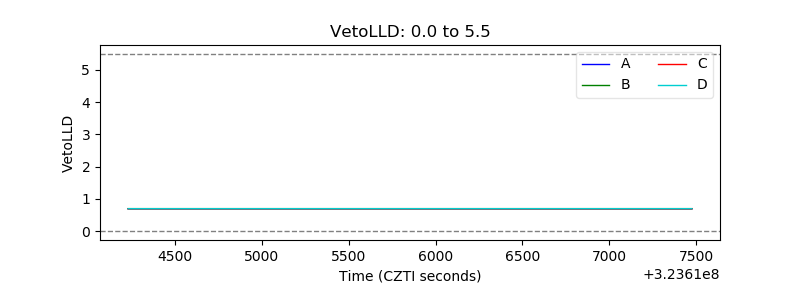 |
| Alpha Counter |  |
| _CPM_Rate |  |
| CZT Counter | 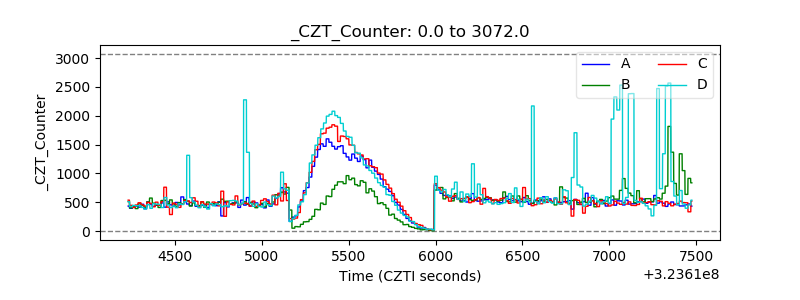 |
| +2.5 Volts monitor |  |
| +5 Volts monitor |  |
| _ROLL_ROT | 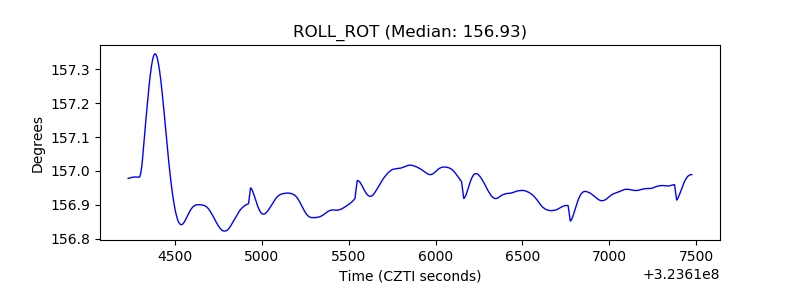 |
| _Roll_DEC | 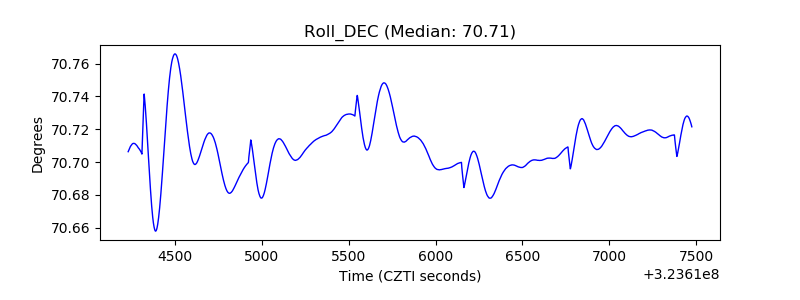 |
| _Roll_RA |  |
| Veto Counter | 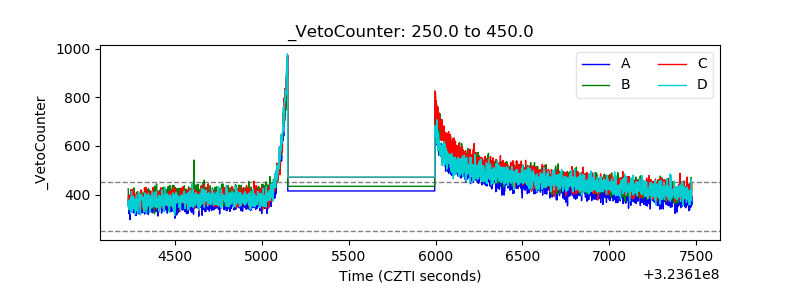 |