| Param | Original file | Final file |
|---|---|---|
| Filename | modeM0/AS1A07_054T01_9000003604_24414cztM0_level2.evt | modeM0/AS1A07_054T01_9000003604_24414cztM0_level2_quad_clean.evt |
| Size (bytes) | 480,193,920 | 126,924,480 |
| Size | 457.9 MB | 121.0 MB |
| Events in quadrant A | 3,065,860 | 872,270 |
| Events in quadrant B | 3,407,207 | 876,895 |
| Events in quadrant C | 3,144,828 | 840,594 |
| Events in quadrant D | 4,483,563 | 801,445 |
| Mode M0 | |||
|---|---|---|---|
| Quadrant | BADHDUFLAG | Total packets | Discarded packets |
| A | 0 | 13446 | 1 |
| B | 0 | 14418 | 1 |
| C | 0 | 13569 | 1 |
| D | 0 | 17710 | 1 |
| Mode M9 | |||
|---|---|---|---|
| Quadrant | BADHDUFLAG | Total packets | Discarded packets |
| A | 0 | 10 | 0 |
| B | 0 | 10 | 0 |
| C | 0 | 10 | 0 |
| D | 0 | 10 | 0 |
| Mode SS | |||
|---|---|---|---|
| Quadrant | BADHDUFLAG | Total packets | Discarded packets |
| A | 0 | 132 | 0 |
| B | 0 | 132 | 0 |
| C | 0 | 132 | 0 |
| D | 0 | 132 | 0 |
| Quadrant | Total seconds | Saturated seconds | Saturation percentage |
|---|---|---|---|
| A | 6495 | 22 | 0.338722% |
| B | 6496 | 59 | 0.908251% |
| C | 6495 | 57 | 0.877598% |
| D | 6495 | 406 | 6.250962% |
Noise dominated data is calculated using 1-second bins in cleaned event files. If a bin has >2000 counts, and if more than 50% of those come from <1% of pixels, then it is considered to be noise-dominated and hence unusable.
| Quadrant | # 1 sec bins | Bins with >0 counts | Bins with >2000 counts | High rate bins dominated by noise | Noise dominated (total time) | Noise dominated (detector-on time) | Marked lightcurve |
|---|---|---|---|---|---|---|---|
| A | 7510 | 6495 | 0 | 0 | 0.00% | 0.00% |  |
| B | 7511 | 6496 | 21 | 21 | 0.28% | 0.32% | 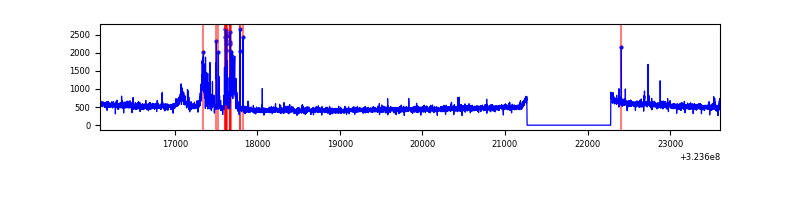 |
| C | 7510 | 6495 | 0 | 0 | 0.00% | 0.00% | 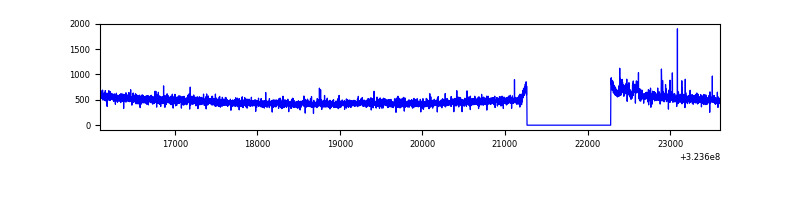 |
| D | 7510 | 6495 | 337 | 337 | 4.49% | 5.19% |  |
Top three noisy pixels from each quadrant. If the there are fewer than three noisy pixels in the level2.evt file, extra rows are filled as -1
| Pixel properties | Quadrant properties | ||||||
|---|---|---|---|---|---|---|---|
| Quadrant | DetID | PixID | Counts | Sigma | Mean | Median | Sigma |
| A | 13 | 254 | 10608 | 61.78 | 794 | 775 | 159.2 |
| A | 0 | 226 | 6912 | 38.56 | 794 | 775 | 159.2 |
| A | 3 | 137 | 6853 | 38.19 | 794 | 775 | 159.2 |
| B | 15 | 33 | 127886 | 857.0 | 788 | 768 | 148.3 |
| B | 5 | 172 | 117229 | 785.15 | 788 | 768 | 148.3 |
| B | 0 | 190 | 54792 | 364.22 | 788 | 768 | 148.3 |
| C | 14 | 238 | 120162 | 675.16 | 762 | 766 | 176.8 |
| C | 10 | 9 | 39499 | 219.03 | 762 | 766 | 176.8 |
| C | 7 | 247 | 6800 | 34.12 | 762 | 766 | 176.8 |
| D | 1 | 52 | 1370367 | 7431.04 | 759 | 735 | 184.3 |
| D | 9 | 1 | 94902 | 510.91 | 759 | 735 | 184.3 |
| D | 8 | 195 | 89223 | 480.1 | 759 | 735 | 184.3 |
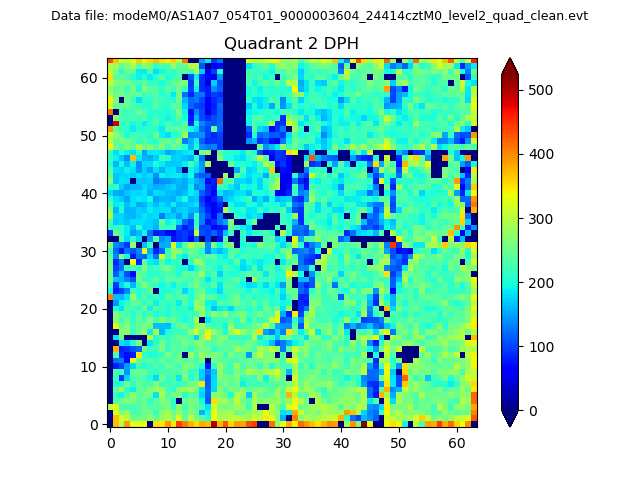
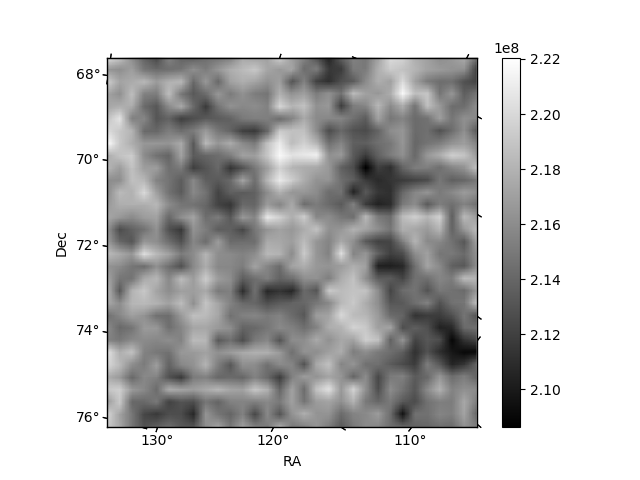
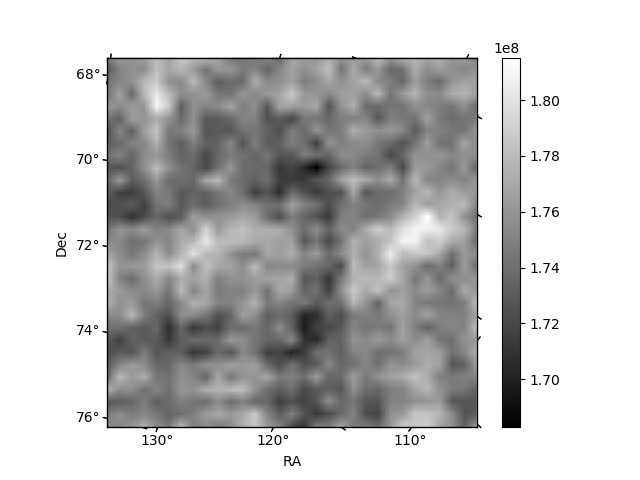
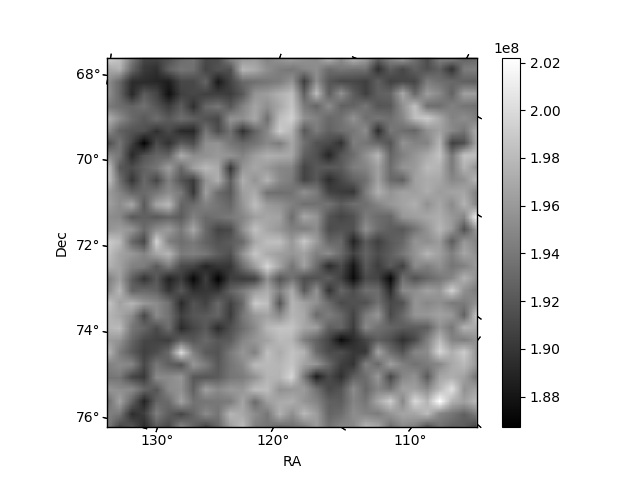
Histogram calculated using DETX and DETY for each event in the final _common_clean file
| Quadrant A | 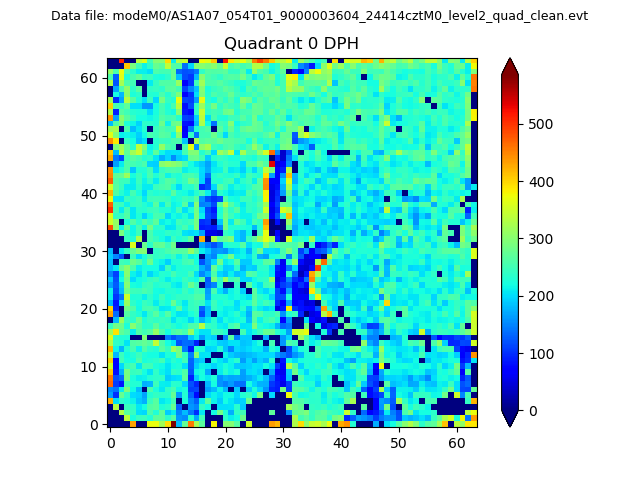 |
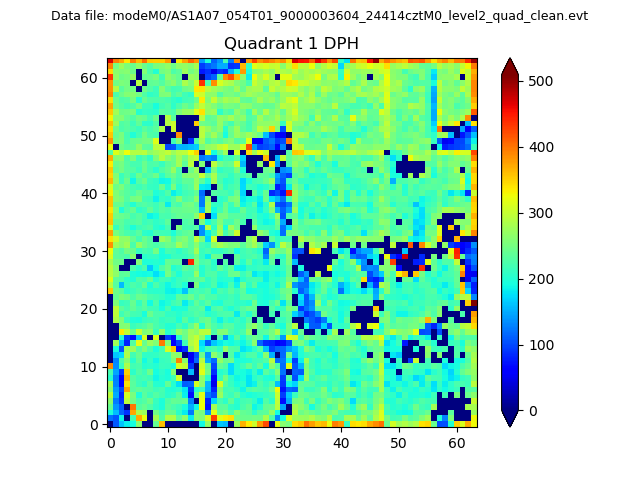 |
Quadrant B |
|---|---|---|---|
| Quadrant D | 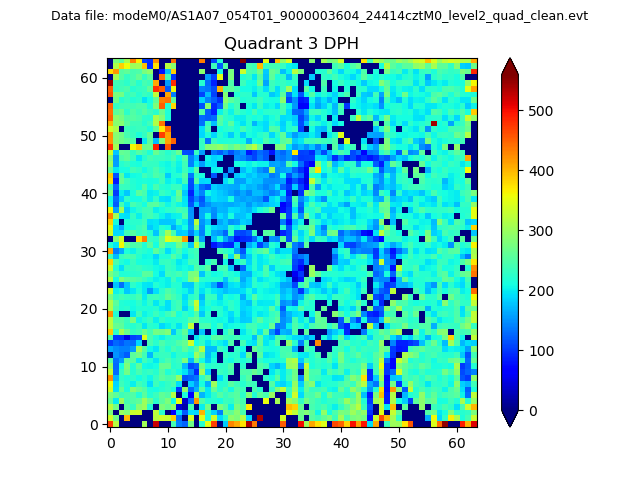 |
 |
Quadrant C |
| Plot type | Count rate plots | Images |
|---|---|---|
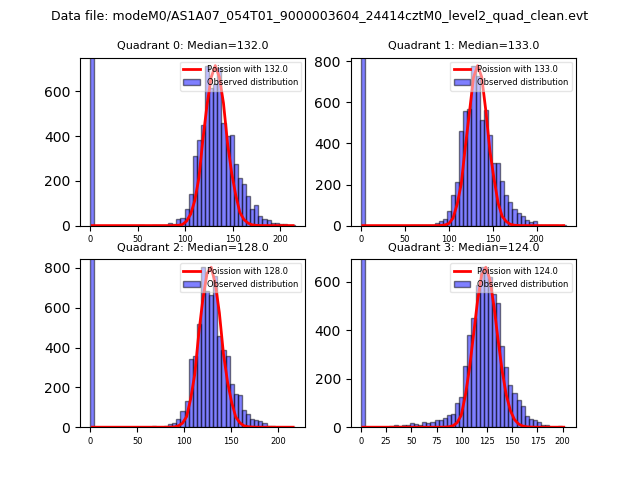
| Comparison with Poisson distribution Blue bars denote a histogram of data divided into 1 sec bins. Red curve is a Poisson curve with rate = median count rate of data. |
 |
 |
| Quadrant-wise count rates Data is divided into 100 sec bins |
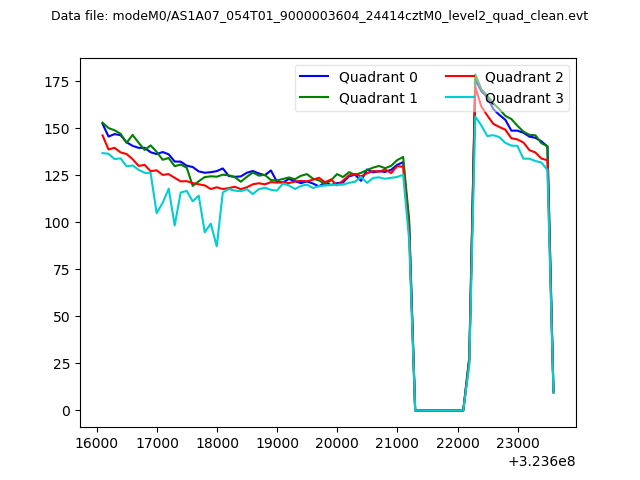 |
|
| Module-wise count rates for Quadrant A Data is divided into 100 sec bins |
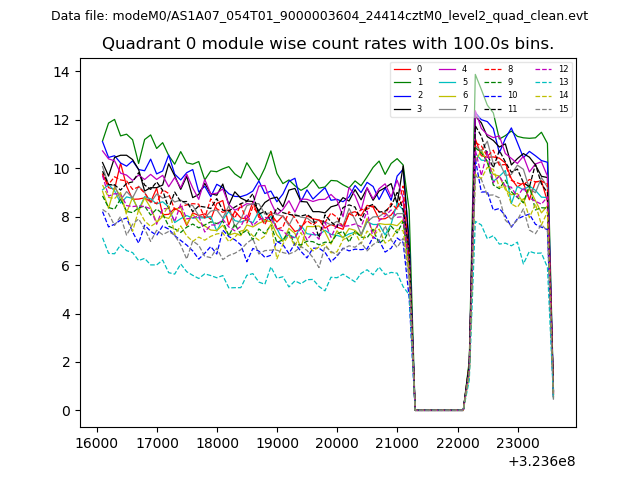 |
 |
| Module-wise count rates for Quadrant B Data is divided into 100 sec bins |
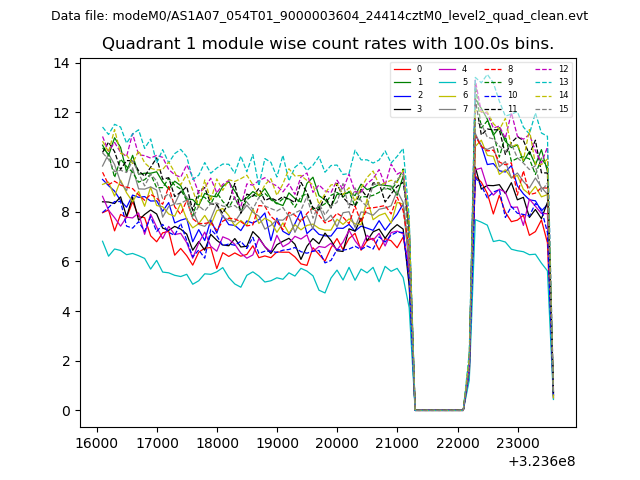 |
 |
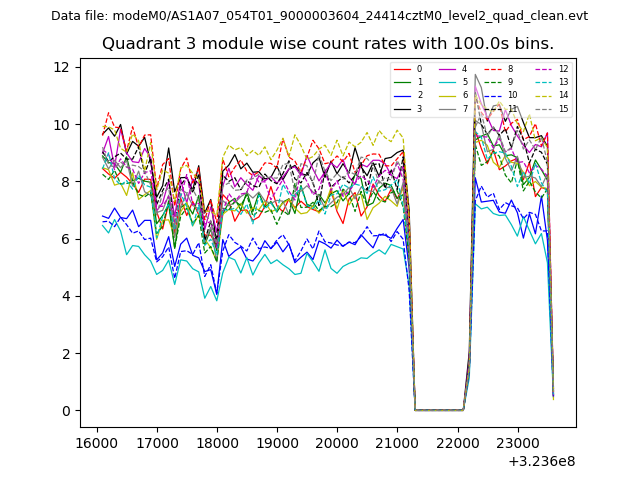
| Module-wise count rates for Quadrant C Data is divided into 100 sec bins |
 |
 |
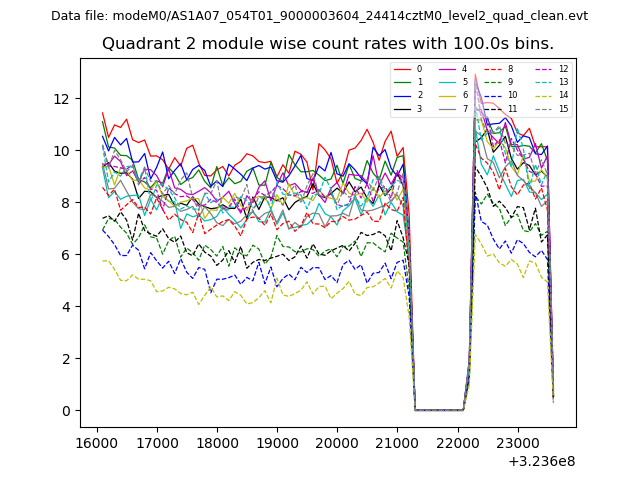
| Module-wise count rates for Quadrant D Data is divided into 100 sec bins |
 |
 |
| Parameter | Plot |
|---|---|
| CZT HV Monitor | 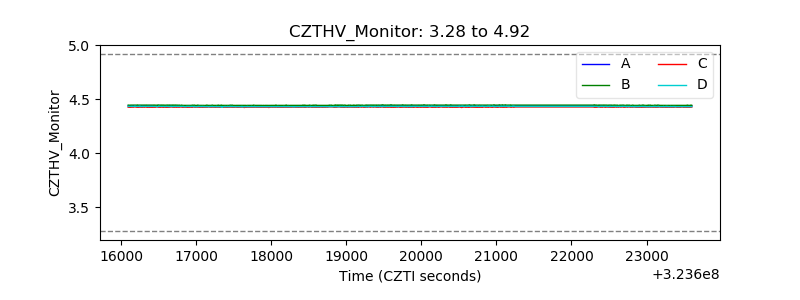 |
| D_VDD | 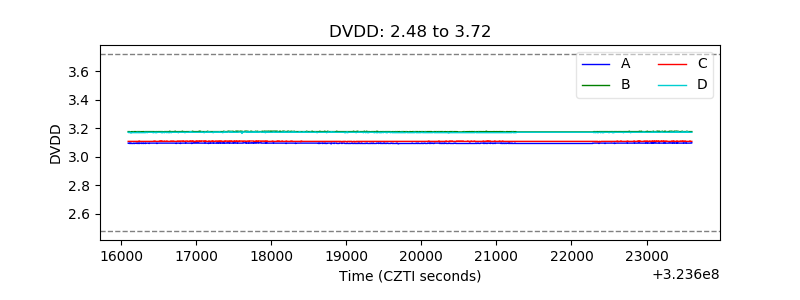 |
| Temperature 1 |  |
| Veto HV Monitor | 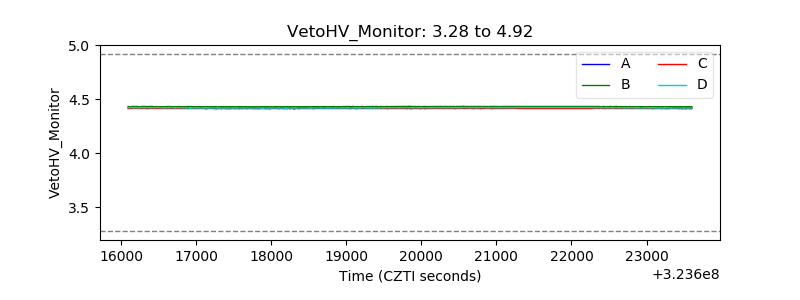 |
| Veto LLD |  |
| Alpha Counter | 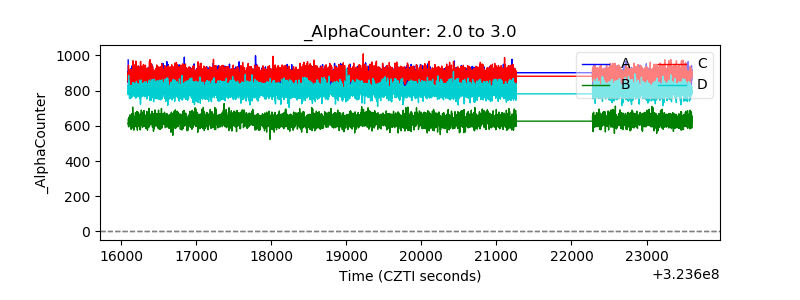 |
| _CPM_Rate | 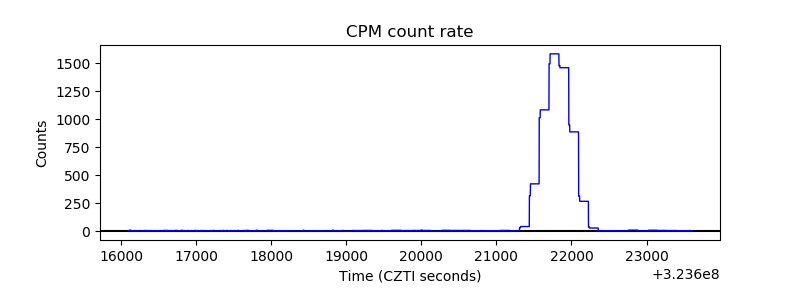 |
| CZT Counter | 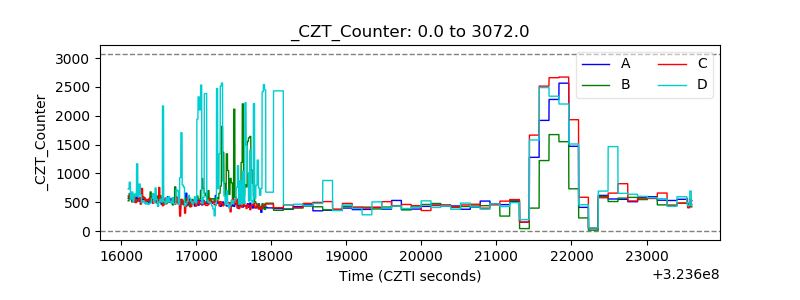 |
| +2.5 Volts monitor | 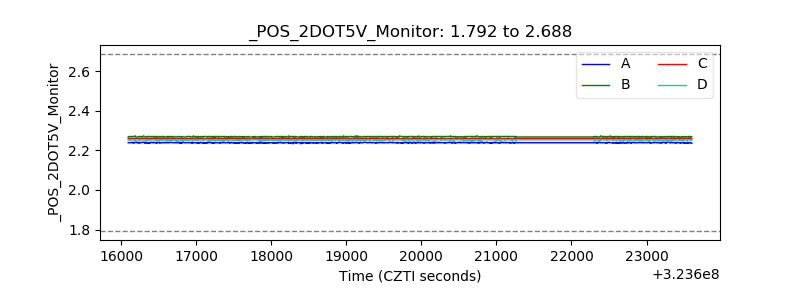 |
| +5 Volts monitor | 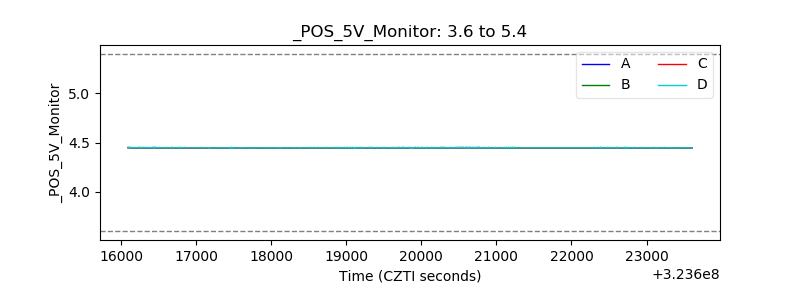 |
| _ROLL_ROT | 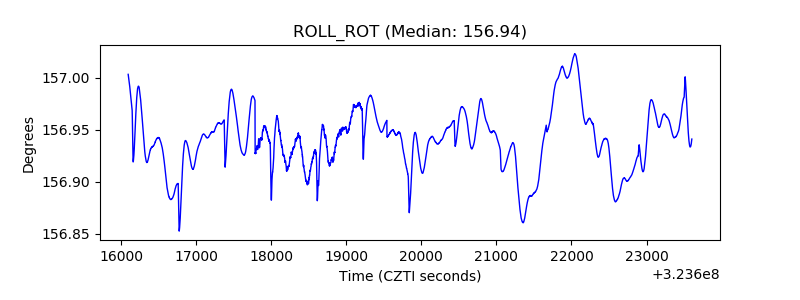 |
| _Roll_DEC | 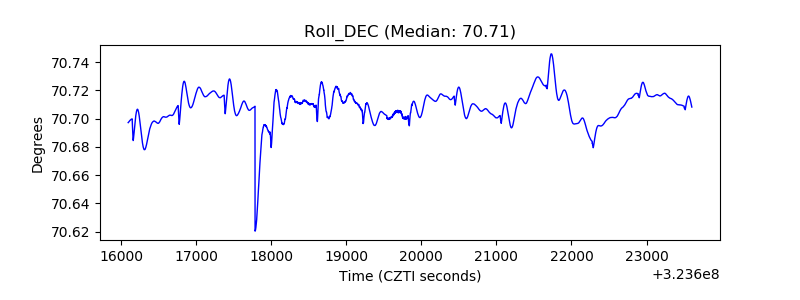 |
| _Roll_RA |  |
| Veto Counter | 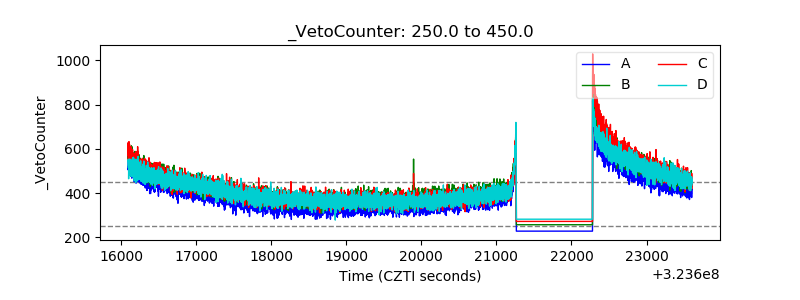 |