| Param | Original file | Final file |
|---|---|---|
| Filename | modeM0/AS1A07_054T01_9000003604_24418cztM0_level2.evt | modeM0/AS1A07_054T01_9000003604_24418cztM0_level2_quad_clean.evt |
| Size (bytes) | 459,570,240 | 134,245,440 |
| Size | 438.3 MB | 128.0 MB |
| Events in quadrant A | 3,001,006 | 914,685 |
| Events in quadrant B | 3,312,398 | 943,212 |
| Events in quadrant C | 3,482,571 | 912,610 |
| Events in quadrant D | 3,706,774 | 868,635 |
| Mode M0 | |||
|---|---|---|---|
| Quadrant | BADHDUFLAG | Total packets | Discarded packets |
| A | 0 | 12962 | 2 |
| B | 0 | 13840 | 2 |
| C | 0 | 14472 | 2 |
| D | 0 | 15210 | 4 |
| Mode M9 | |||
|---|---|---|---|
| Quadrant | BADHDUFLAG | Total packets | Discarded packets |
| A | 0 | 17 | 0 |
| B | 0 | 18 | 0 |
| C | 0 | 18 | 0 |
| D | 0 | 18 | 0 |
| Mode SS | |||
|---|---|---|---|
| Quadrant | BADHDUFLAG | Total packets | Discarded packets |
| A | 0 | 126 | 0 |
| B | 0 | 126 | 0 |
| C | 0 | 126 | 0 |
| D | 0 | 126 | 0 |
| Quadrant | Total seconds | Saturated seconds | Saturation percentage |
|---|---|---|---|
| A | 6114 | 16 | 0.261694% |
| B | 6114 | 68 | 1.112202% |
| C | 6114 | 69 | 1.128557% |
| D | 6113 | 109 | 1.783085% |
Noise dominated data is calculated using 1-second bins in cleaned event files. If a bin has >2000 counts, and if more than 50% of those come from <1% of pixels, then it is considered to be noise-dominated and hence unusable.
| Quadrant | # 1 sec bins | Bins with >0 counts | Bins with >2000 counts | High rate bins dominated by noise | Noise dominated (total time) | Noise dominated (detector-on time) | Marked lightcurve |
|---|---|---|---|---|---|---|---|
| A | 7479 | 6115 | 0 | 0 | 0.00% | 0.00% | 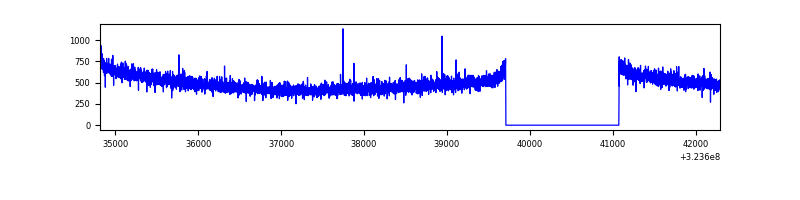 |
| B | 7479 | 6115 | 18 | 18 | 0.24% | 0.29% | 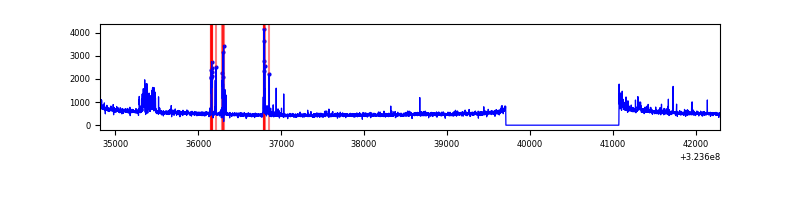 |
| C | 7479 | 6115 | 1 | 1 | 0.01% | 0.02% | 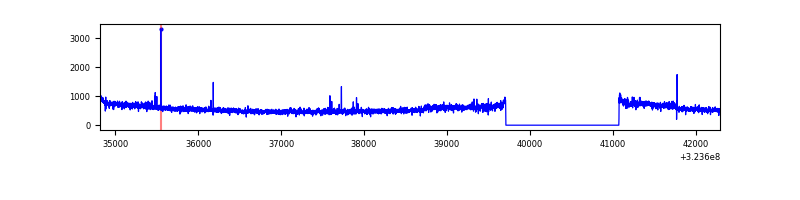 |
| D | 7478 | 6114 | 77 | 77 | 1.03% | 1.26% | 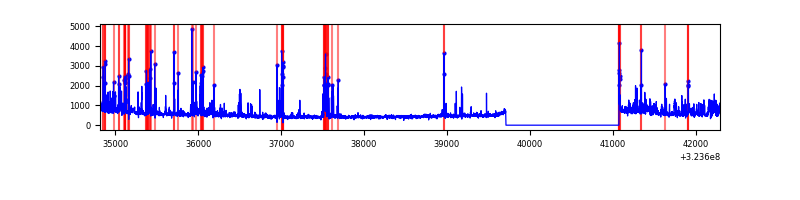 |
Top three noisy pixels from each quadrant. If the there are fewer than three noisy pixels in the level2.evt file, extra rows are filled as -1
| Pixel properties | Quadrant properties | ||||||
|---|---|---|---|---|---|---|---|
| Quadrant | DetID | PixID | Counts | Sigma | Mean | Median | Sigma |
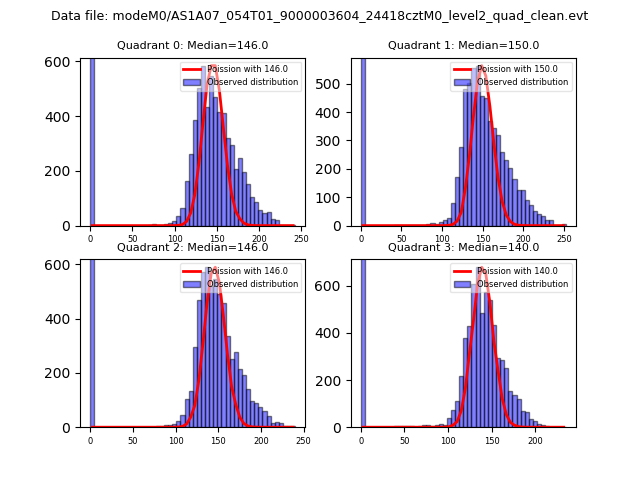
| A | 13 | 254 | 11348 | 68.67 | 778 | 764 | 154.1 |
| A | 0 | 226 | 6736 | 38.75 | 778 | 764 | 154.1 |
| A | 3 | 137 | 6319 | 36.04 | 778 | 764 | 154.1 |
| B | 3 | 64 | 109615 | 759.65 | 786 | 768 | 143.3 |
| B | 15 | 33 | 80789 | 558.47 | 786 | 768 | 143.3 |
| B | 0 | 190 | 29917 | 203.43 | 786 | 768 | 143.3 |
| C | 7 | 247 | 302675 | 1700.82 | 772 | 781 | 177.5 |
| C | 14 | 238 | 125007 | 699.87 | 772 | 781 | 177.5 |
| C | 2 | 16 | 24082 | 131.27 | 772 | 781 | 177.5 |
| D | 1 | 52 | 326762 | 1779.45 | 763 | 741 | 183.2 |
| D | 9 | 35 | 226729 | 1233.46 | 763 | 741 | 183.2 |
| D | 12 | 218 | 168698 | 916.72 | 763 | 741 | 183.2 |
Histogram calculated using DETX and DETY for each event in the final _common_clean file
| Quadrant A |  |
 |
Quadrant B |
|---|---|---|---|
| Quadrant D |  |
 |
Quadrant C |
| Plot type | Count rate plots | Images |
|---|---|---|
| Comparison with Poisson distribution Blue bars denote a histogram of data divided into 1 sec bins. Red curve is a Poisson curve with rate = median count rate of data. |
 |
 |
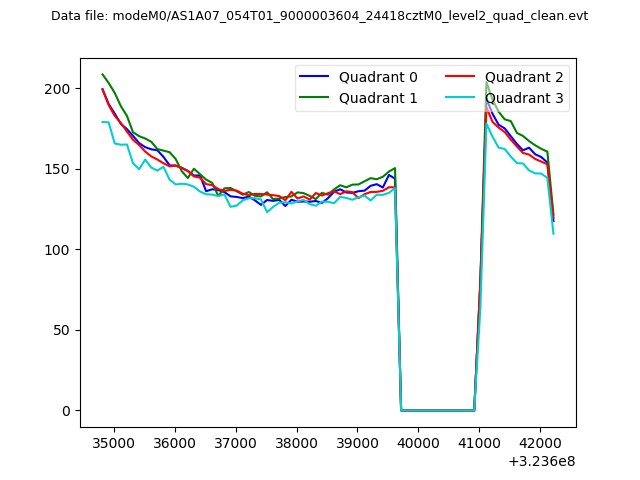
| Quadrant-wise count rates Data is divided into 100 sec bins |
 |
|
| Module-wise count rates for Quadrant A Data is divided into 100 sec bins |
 |
 |
| Module-wise count rates for Quadrant B Data is divided into 100 sec bins |
 |
 |
| Module-wise count rates for Quadrant C Data is divided into 100 sec bins |
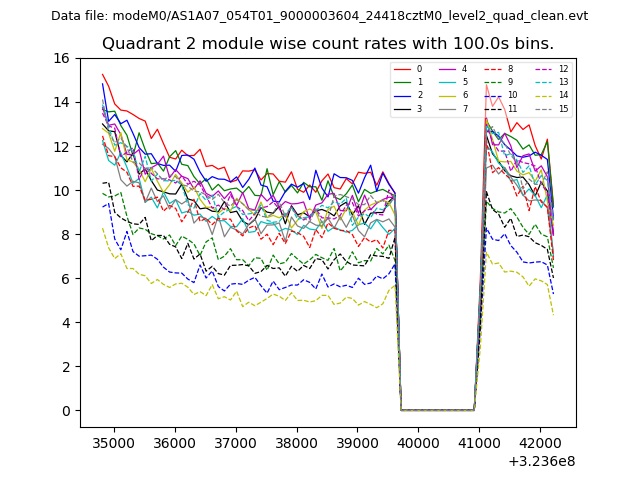 |
 |
| Module-wise count rates for Quadrant D Data is divided into 100 sec bins |
 |
 |
| Parameter | Plot |
|---|---|
| CZT HV Monitor |  |
| D_VDD |  |
| Temperature 1 |  |
| Veto HV Monitor |  |
| Veto LLD |  |
| Alpha Counter | 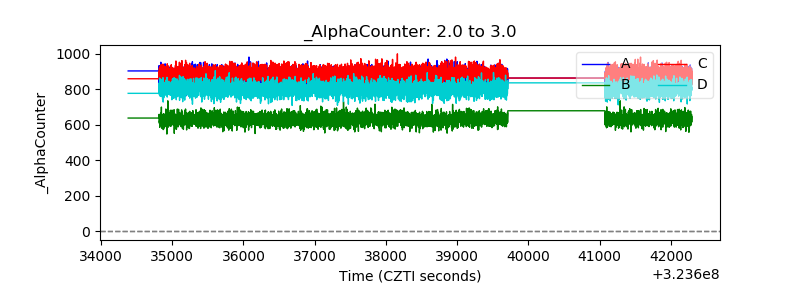 |
| _CPM_Rate | 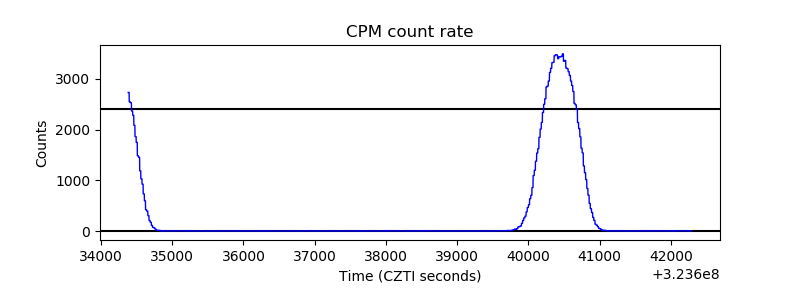 |
| CZT Counter |  |
| +2.5 Volts monitor |  |
| +5 Volts monitor |  |
| _ROLL_ROT |  |
| _Roll_DEC |  |
| _Roll_RA |  |
| Veto Counter |  |