| Param | Original file | Final file |
|---|---|---|
| Filename | modeM0/AS1A07_054T01_9000003604_24420cztM0_level2.evt | modeM0/AS1A07_054T01_9000003604_24420cztM0_level2_quad_clean.evt |
| Size (bytes) | 501,958,080 | 129,816,000 |
| Size | 478.7 MB | 123.8 MB |
| Events in quadrant A | 2,959,727 | 886,531 |
| Events in quadrant B | 3,313,199 | 916,697 |
| Events in quadrant C | 3,118,461 | 886,032 |
| Events in quadrant D | 5,380,738 | 800,786 |
| Mode M0 | |||
|---|---|---|---|
| Quadrant | BADHDUFLAG | Total packets | Discarded packets |
| A | 0 | 12989 | 2 |
| B | 0 | 13958 | 2 |
| C | 0 | 13261 | 2 |
| D | 0 | 20329 | 2 |
| Mode M9 | |||
|---|---|---|---|
| Quadrant | BADHDUFLAG | Total packets | Discarded packets |
| A | 0 | 20 | 0 |
| B | 0 | 21 | 0 |
| C | 0 | 21 | 0 |
| D | 0 | 21 | 0 |
| Mode SS | |||
|---|---|---|---|
| Quadrant | BADHDUFLAG | Total packets | Discarded packets |
| A | 0 | 128 | 0 |
| B | 0 | 128 | 0 |
| C | 0 | 128 | 0 |
| D | 0 | 128 | 0 |
| Quadrant | Total seconds | Saturated seconds | Saturation percentage |
|---|---|---|---|
| A | 6333 | 15 | 0.236855% |
| B | 6333 | 55 | 0.868467% |
| C | 6333 | 56 | 0.884257% |
| D | 6333 | 604 | 9.537344% |
Noise dominated data is calculated using 1-second bins in cleaned event files. If a bin has >2000 counts, and if more than 50% of those come from <1% of pixels, then it is considered to be noise-dominated and hence unusable.
| Quadrant | # 1 sec bins | Bins with >0 counts | Bins with >2000 counts | High rate bins dominated by noise | Noise dominated (total time) | Noise dominated (detector-on time) | Marked lightcurve |
|---|---|---|---|---|---|---|---|
| A | 7633 | 6334 | 0 | 0 | 0.00% | 0.00% |  |
| B | 7633 | 6334 | 14 | 14 | 0.18% | 0.22% |  |
| C | 7633 | 6334 | 0 | 0 | 0.00% | 0.00% |  |
| D | 7633 | 6334 | 445 | 445 | 5.83% | 7.03% |  |
Top three noisy pixels from each quadrant. If the there are fewer than three noisy pixels in the level2.evt file, extra rows are filled as -1
| Pixel properties | Quadrant properties | ||||||
|---|---|---|---|---|---|---|---|
| Quadrant | DetID | PixID | Counts | Sigma | Mean | Median | Sigma |
| A | 13 | 254 | 10347 | 63.35 | 767 | 753 | 151.4 |
| A | 3 | 137 | 6522 | 38.1 | 767 | 753 | 151.4 |
| A | 0 | 226 | 6487 | 37.86 | 767 | 753 | 151.4 |
| B | 3 | 64 | 195886 | 1357.97 | 778 | 757 | 143.7 |
| B | 0 | 190 | 62791 | 431.72 | 778 | 757 | 143.7 |
| B | 12 | 111 | 16874 | 112.16 | 778 | 757 | 143.7 |
| C | 14 | 238 | 122396 | 700.62 | 756 | 763 | 173.6 |
| C | 2 | 16 | 36257 | 204.45 | 756 | 763 | 173.6 |
| C | 3 | 233 | 7766 | 40.34 | 756 | 763 | 173.6 |
| D | 7 | 238 | 1256159 | 7305.4 | 716 | 695 | 171.9 |
| D | 12 | 218 | 932911 | 5424.46 | 716 | 695 | 171.9 |
| D | 1 | 52 | 371215 | 2156.01 | 716 | 695 | 171.9 |
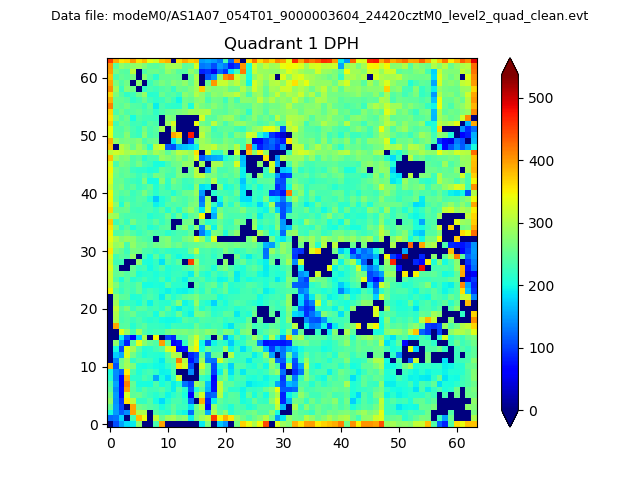
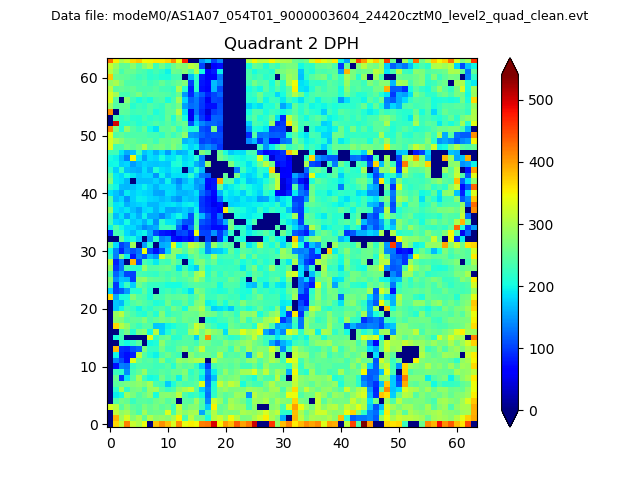
Histogram calculated using DETX and DETY for each event in the final _common_clean file
| Quadrant A |  |
 |
Quadrant B |
|---|---|---|---|
| Quadrant D | 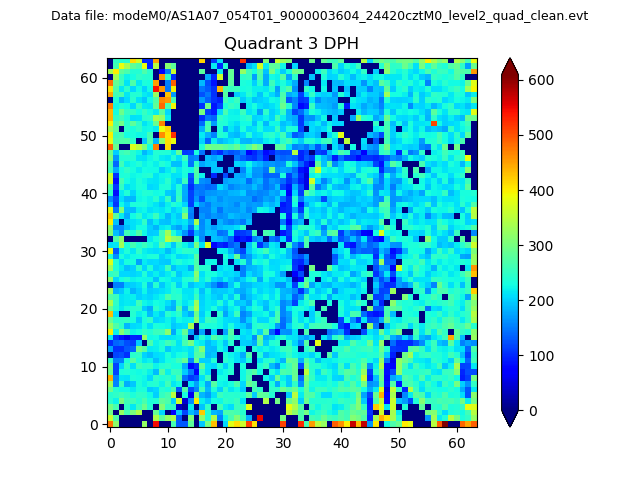 |
 |
Quadrant C |
| Plot type | Count rate plots | Images |
|---|---|---|
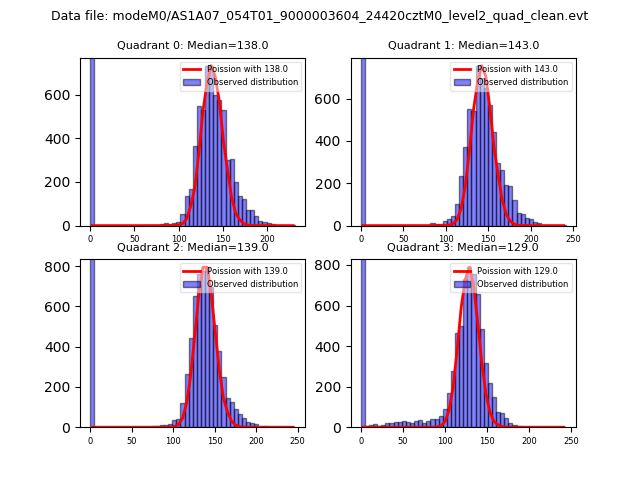
| Comparison with Poisson distribution Blue bars denote a histogram of data divided into 1 sec bins. Red curve is a Poisson curve with rate = median count rate of data. |
 |
 |
| Quadrant-wise count rates Data is divided into 100 sec bins |
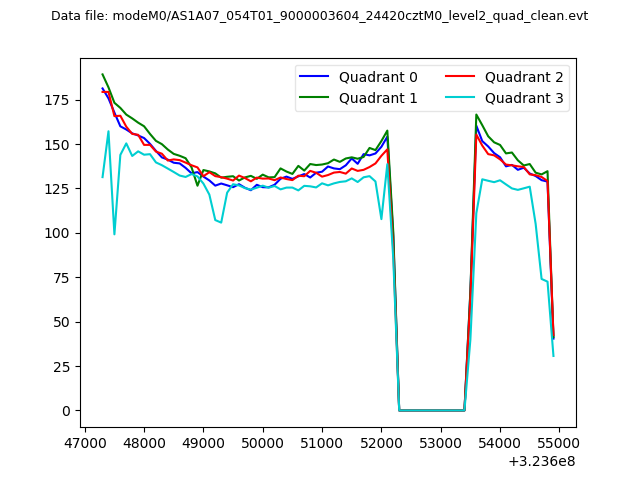 |
|
| Module-wise count rates for Quadrant A Data is divided into 100 sec bins |
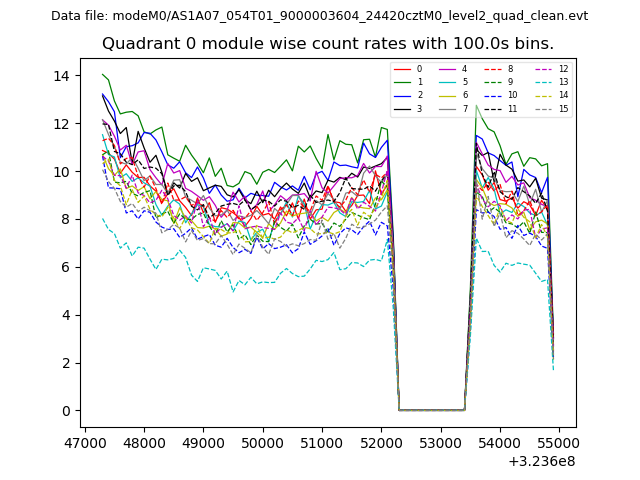 |
 |
| Module-wise count rates for Quadrant B Data is divided into 100 sec bins |
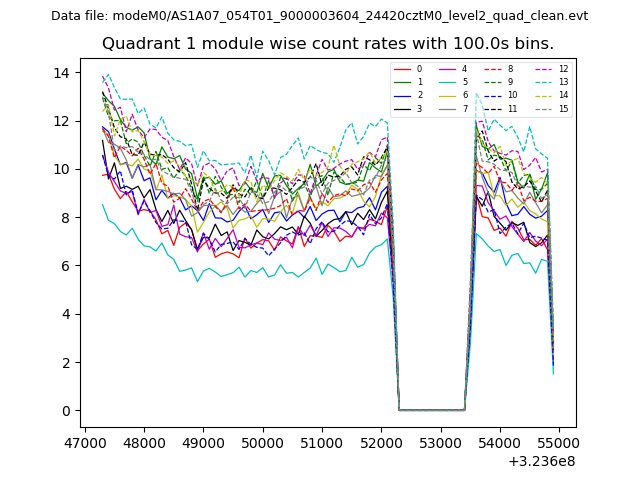 |
 |
| Module-wise count rates for Quadrant C Data is divided into 100 sec bins |
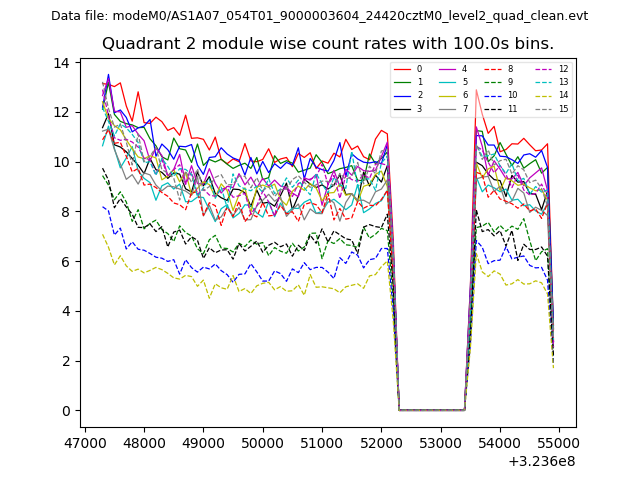 |
 |
| Module-wise count rates for Quadrant D Data is divided into 100 sec bins |
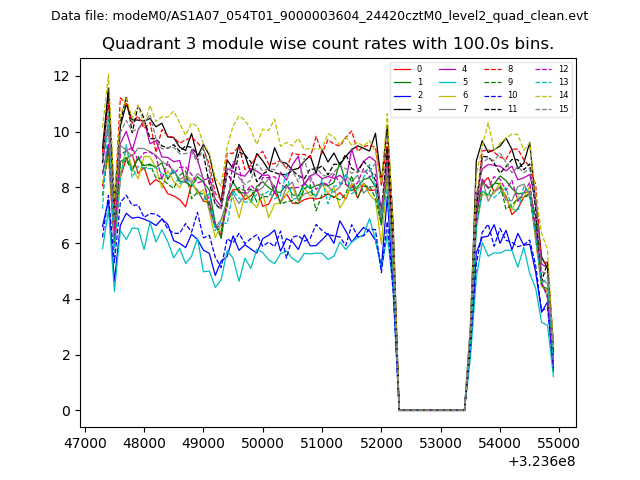 |
 |
| Parameter | Plot |
|---|---|
| CZT HV Monitor | 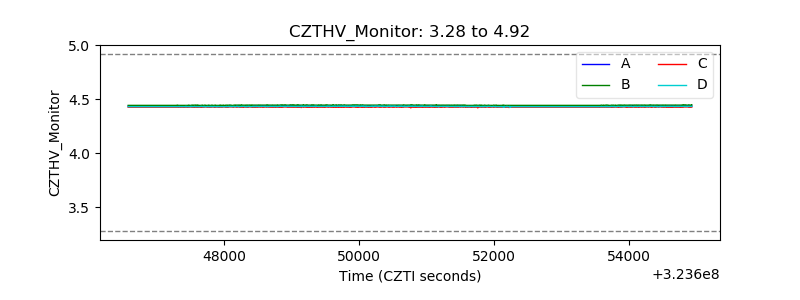 |
| D_VDD | 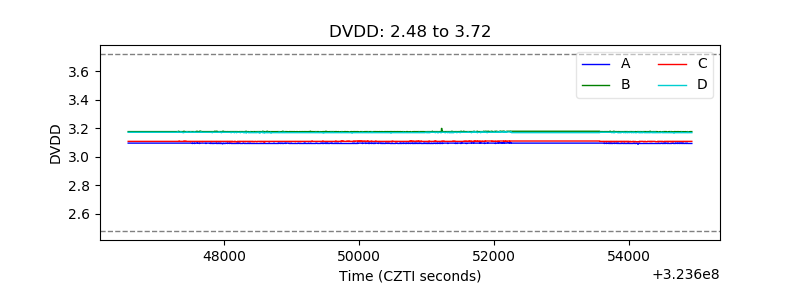 |
| Temperature 1 | 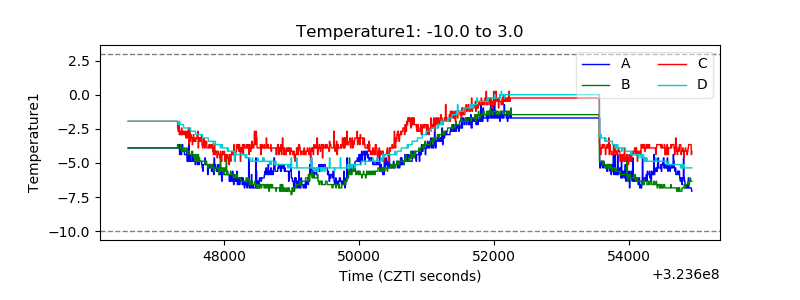 |
| Veto HV Monitor |  |
| Veto LLD | 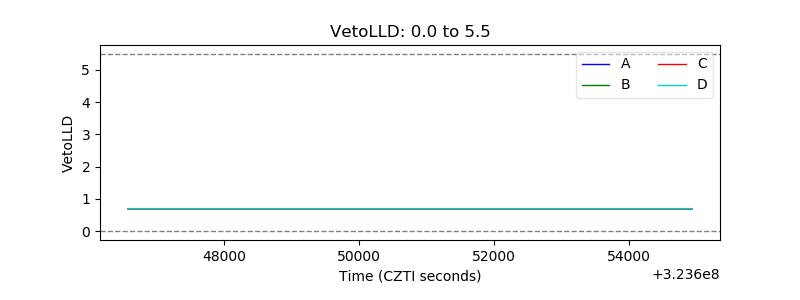 |
| Alpha Counter | 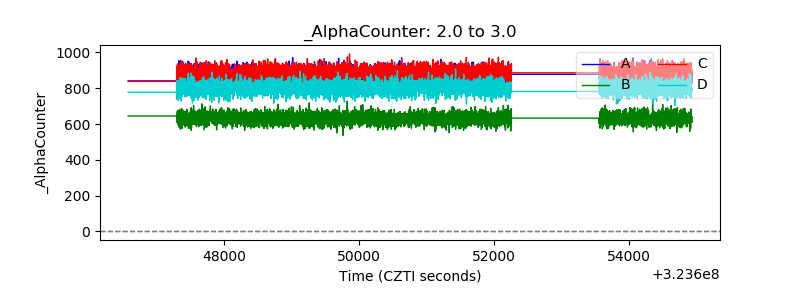 |
| _CPM_Rate | 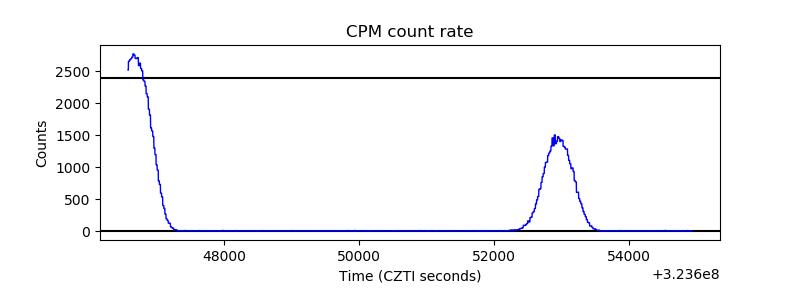 |
| CZT Counter | 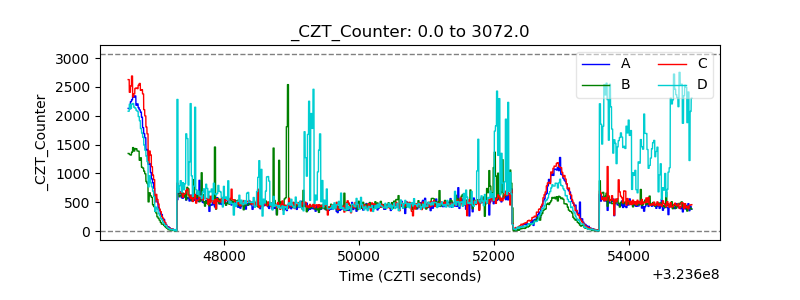 |
| +2.5 Volts monitor |  |
| +5 Volts monitor | 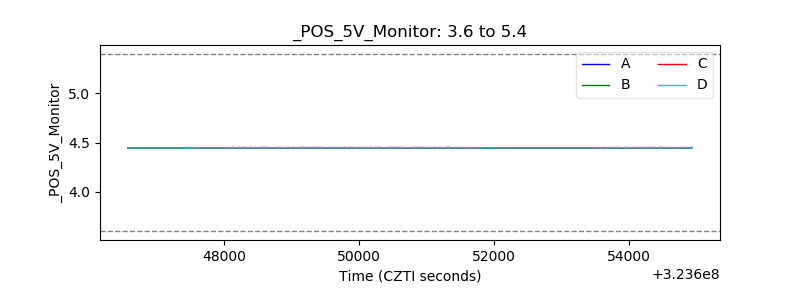 |
| _ROLL_ROT | 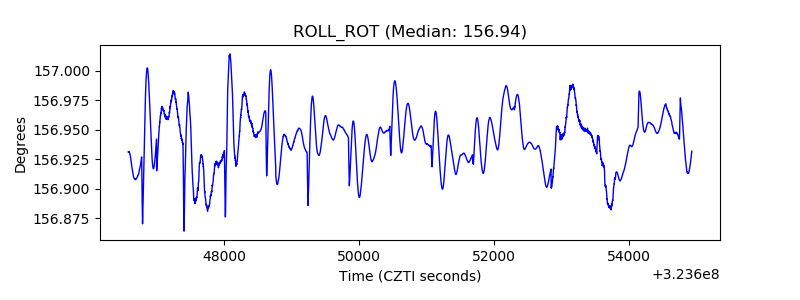 |
| _Roll_DEC | 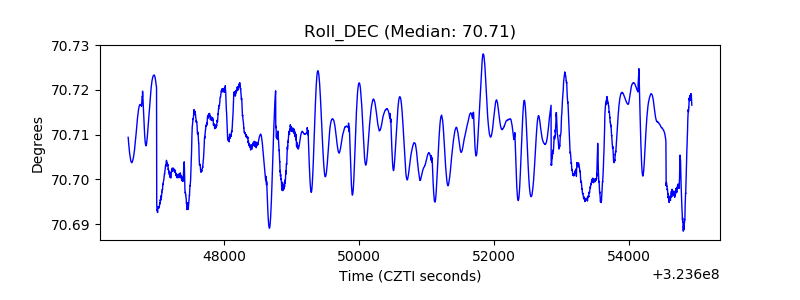 |
| _Roll_RA |  |
| Veto Counter | 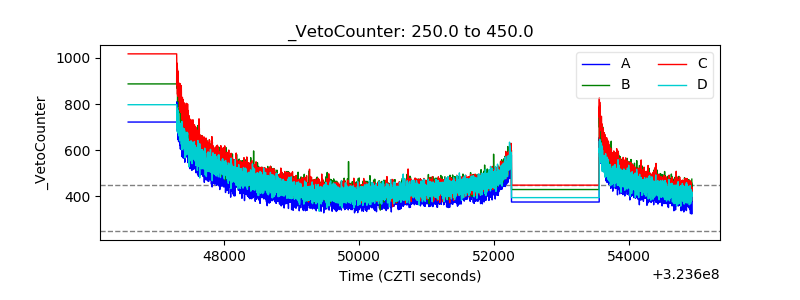 |