| Param | Original file | Final file |
|---|---|---|
| Filename | modeM0/AS1A07_054T01_9000003604_24421cztM0_level2.evt | modeM0/AS1A07_054T01_9000003604_24421cztM0_level2_quad_clean.evt |
| Size (bytes) | 565,418,880 | 128,407,680 |
| Size | 539.2 MB | 122.5 MB |
| Events in quadrant A | 3,010,256 | 877,008 |
| Events in quadrant B | 3,117,607 | 902,583 |
| Events in quadrant C | 3,119,700 | 869,315 |
| Events in quadrant D | 7,426,970 | 777,788 |
| Mode M0 | |||
|---|---|---|---|
| Quadrant | BADHDUFLAG | Total packets | Discarded packets |
| A | 0 | 13495 | 2 |
| B | 0 | 13613 | 2 |
| C | 0 | 13627 | 2 |
| D | 0 | 26700 | 2 |
| Mode M9 | |||
|---|---|---|---|
| Quadrant | BADHDUFLAG | Total packets | Discarded packets |
| A | 0 | 20 | 0 |
| B | 0 | 21 | 0 |
| C | 0 | 21 | 0 |
| D | 0 | 21 | 0 |
| Mode SS | |||
|---|---|---|---|
| Quadrant | BADHDUFLAG | Total packets | Discarded packets |
| A | 0 | 136 | 0 |
| B | 0 | 136 | 0 |
| C | 0 | 136 | 0 |
| D | 0 | 136 | 0 |
| Quadrant | Total seconds | Saturated seconds | Saturation percentage |
|---|---|---|---|
| A | 6623 | 20 | 0.301978% |
| B | 6623 | 46 | 0.694549% |
| C | 6623 | 66 | 0.996527% |
| D | 6623 | 903 | 13.634305% |
Noise dominated data is calculated using 1-second bins in cleaned event files. If a bin has >2000 counts, and if more than 50% of those come from <1% of pixels, then it is considered to be noise-dominated and hence unusable.
| Quadrant | # 1 sec bins | Bins with >0 counts | Bins with >2000 counts | High rate bins dominated by noise | Noise dominated (total time) | Noise dominated (detector-on time) | Marked lightcurve |
|---|---|---|---|---|---|---|---|
| A | 7623 | 6624 | 0 | 0 | 0.00% | 0.00% | 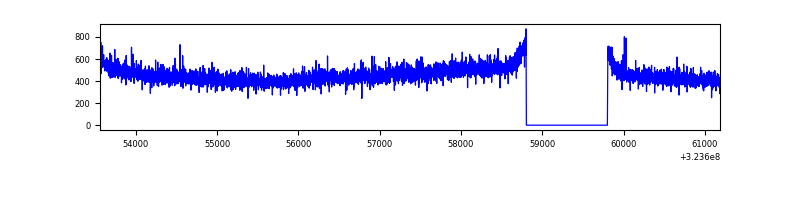 |
| B | 7623 | 6624 | 0 | 0 | 0.00% | 0.00% | 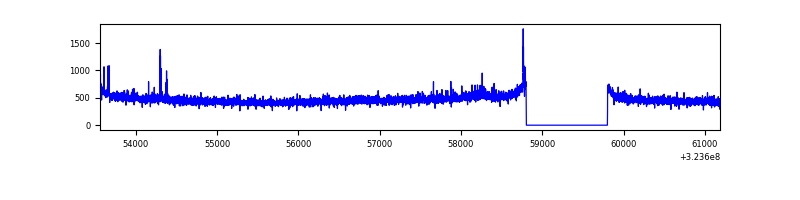 |
| C | 7623 | 6624 | 0 | 0 | 0.00% | 0.00% | 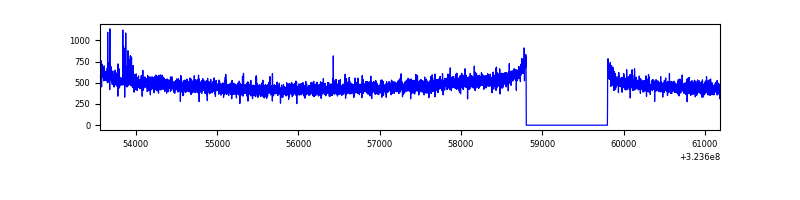 |
| D | 7623 | 6624 | 569 | 569 | 7.46% | 8.59% | 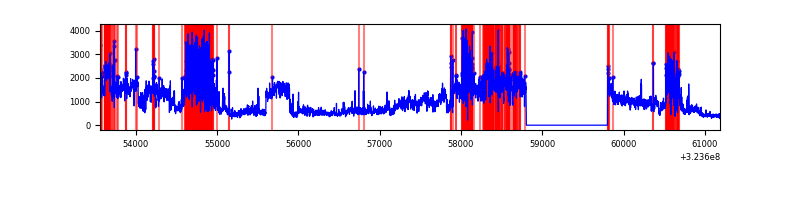 |
Top three noisy pixels from each quadrant. If the there are fewer than three noisy pixels in the level2.evt file, extra rows are filled as -1
| Pixel properties | Quadrant properties | ||||||
|---|---|---|---|---|---|---|---|
| Quadrant | DetID | PixID | Counts | Sigma | Mean | Median | Sigma |
| A | 13 | 254 | 10613 | 63.94 | 780 | 764 | 154.0 |
| A | 3 | 137 | 6959 | 40.22 | 780 | 764 | 154.0 |
| A | 0 | 226 | 6503 | 37.26 | 780 | 764 | 154.0 |
| B | 12 | 111 | 17623 | 114.67 | 788 | 767 | 147.0 |
| B | 11 | 111 | 15562 | 100.65 | 788 | 767 | 147.0 |
| B | 12 | 17 | 13931 | 89.55 | 788 | 767 | 147.0 |
| C | 14 | 238 | 123235 | 689.83 | 762 | 766 | 177.5 |
| C | 2 | 16 | 15074 | 80.59 | 762 | 766 | 177.5 |
| C | 3 | 233 | 9473 | 49.04 | 762 | 766 | 177.5 |
| D | 7 | 238 | 3419213 | 19532.34 | 722 | 699 | 175.0 |
| D | 12 | 218 | 854533 | 4878.54 | 722 | 699 | 175.0 |
| D | 1 | 52 | 274889 | 1566.63 | 722 | 699 | 175.0 |
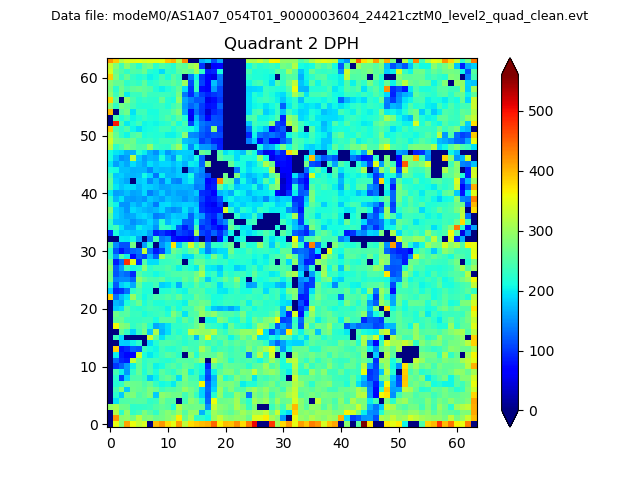
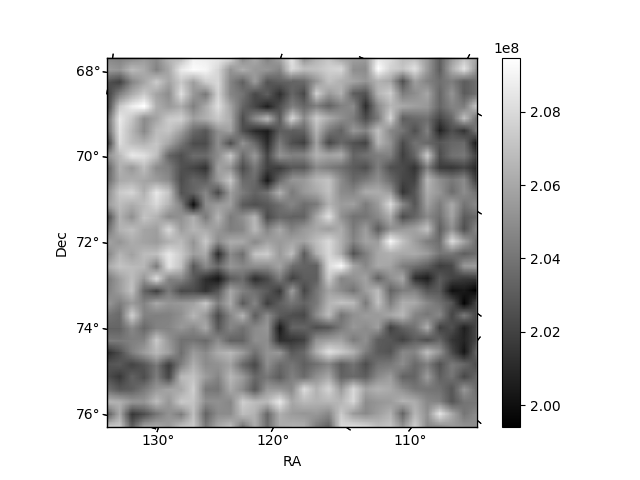
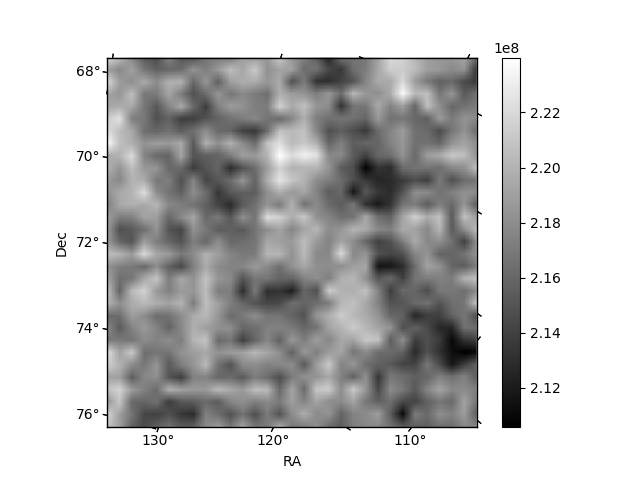
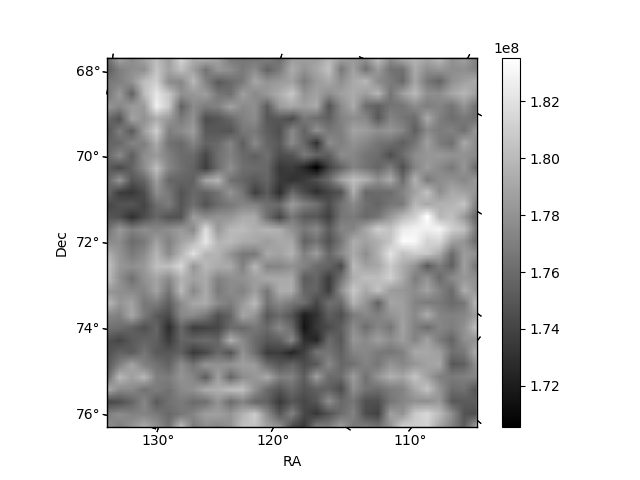
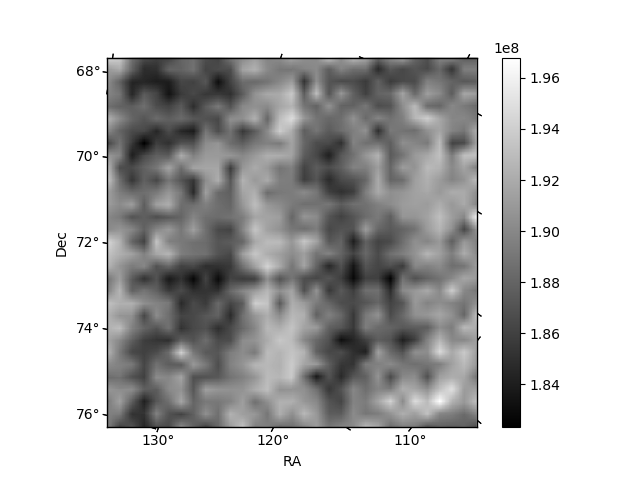
Histogram calculated using DETX and DETY for each event in the final _common_clean file
| Quadrant A | 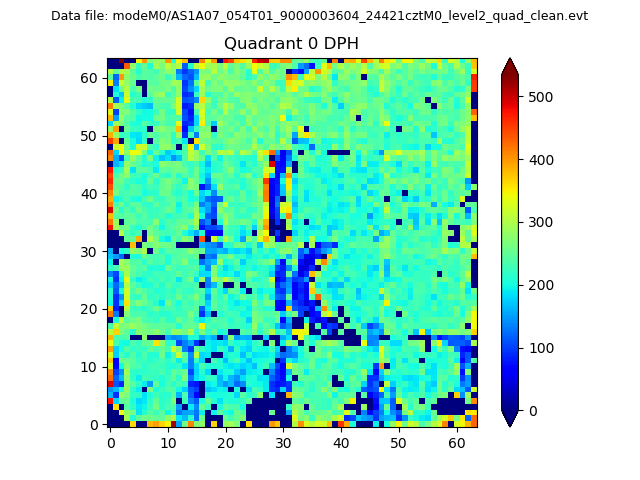 |
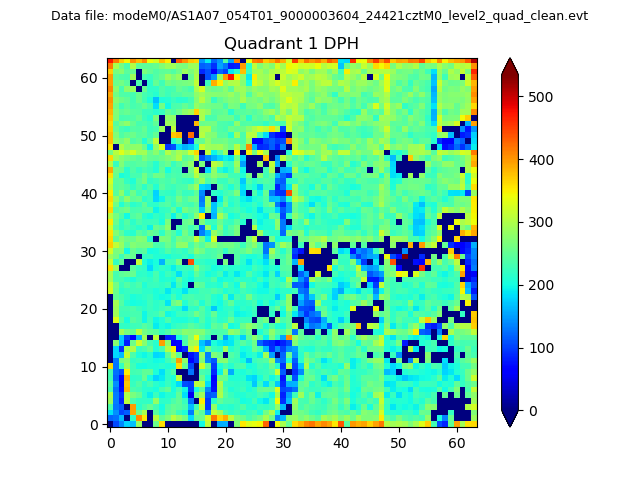 |
Quadrant B |
|---|---|---|---|
| Quadrant D | 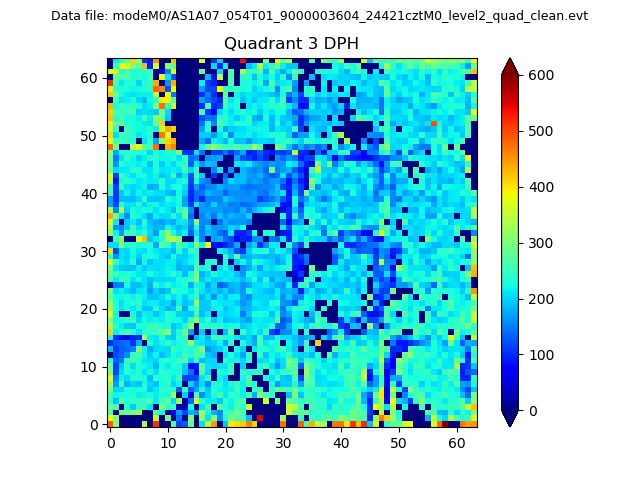 |
 |
Quadrant C |
| Plot type | Count rate plots | Images |
|---|---|---|
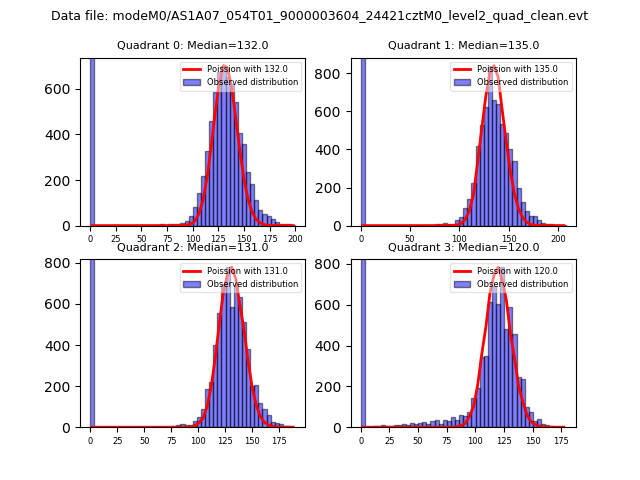
| Comparison with Poisson distribution Blue bars denote a histogram of data divided into 1 sec bins. Red curve is a Poisson curve with rate = median count rate of data. |
 |
 |
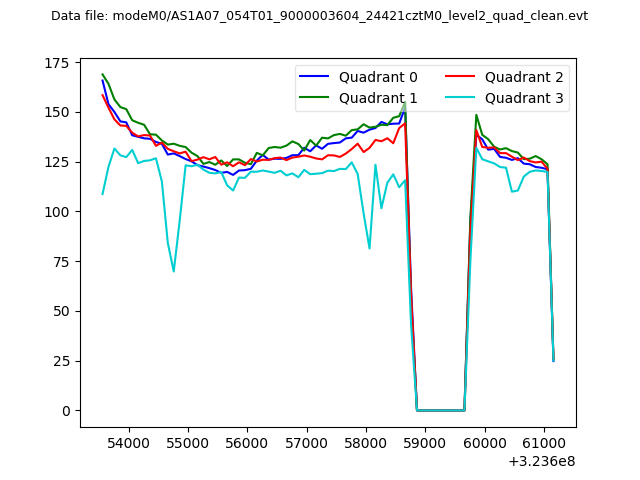
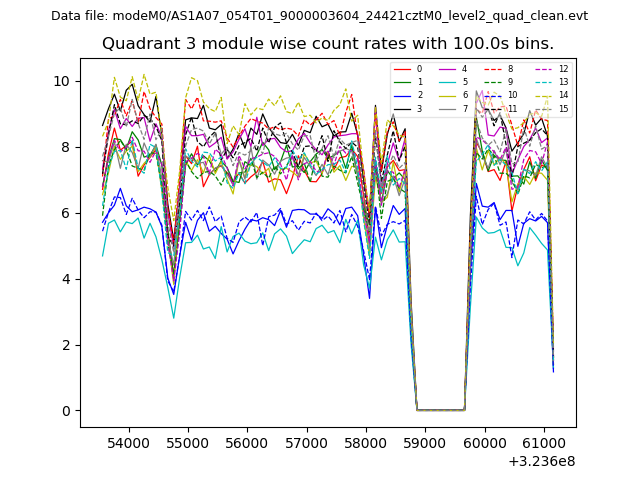
| Quadrant-wise count rates Data is divided into 100 sec bins |
 |
|
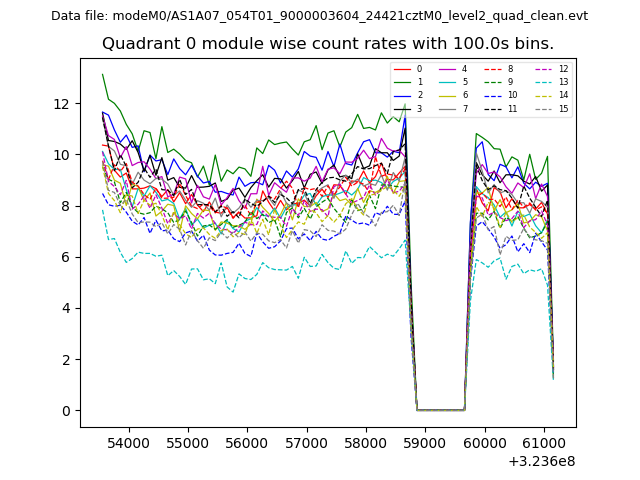
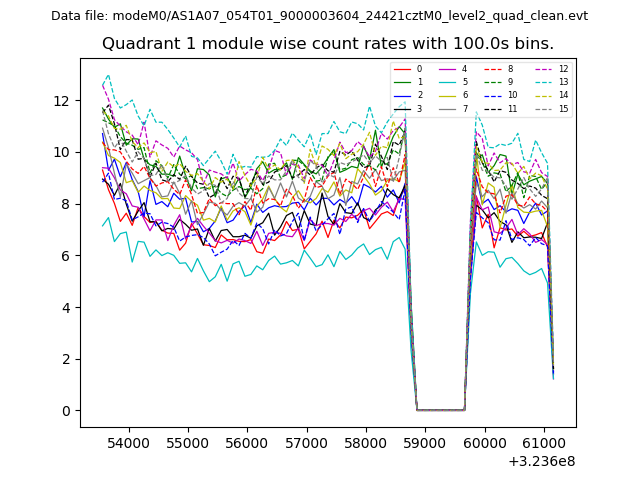
| Module-wise count rates for Quadrant A Data is divided into 100 sec bins |
 |
 |
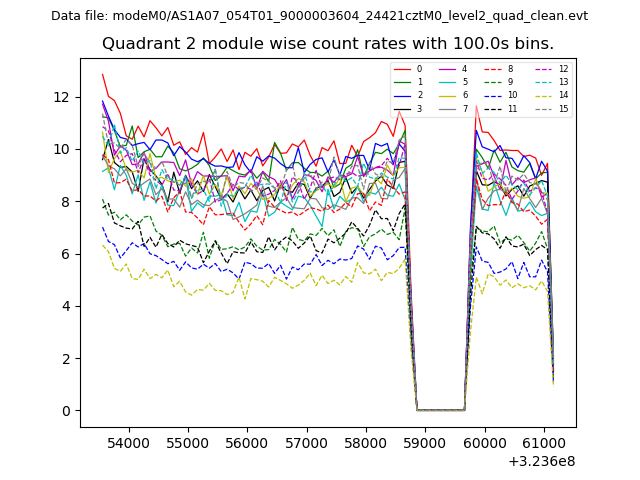
| Module-wise count rates for Quadrant B Data is divided into 100 sec bins |
 |
 |
| Module-wise count rates for Quadrant C Data is divided into 100 sec bins |
 |
 |
| Module-wise count rates for Quadrant D Data is divided into 100 sec bins |
 |
 |
| Parameter | Plot |
|---|---|
| CZT HV Monitor | 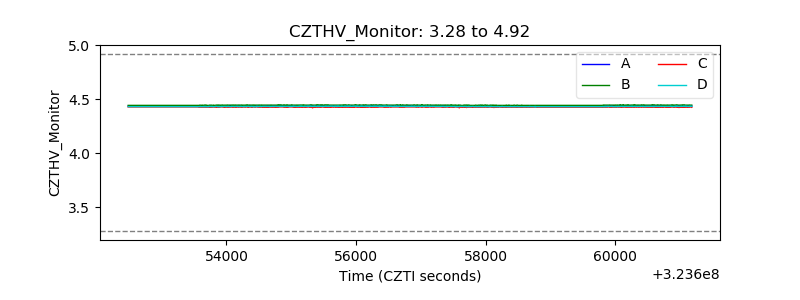 |
| D_VDD | 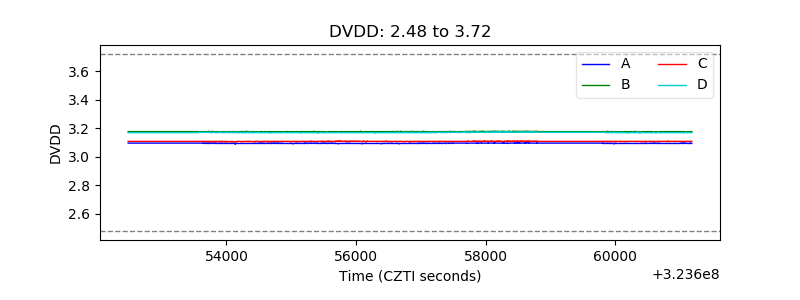 |
| Temperature 1 | 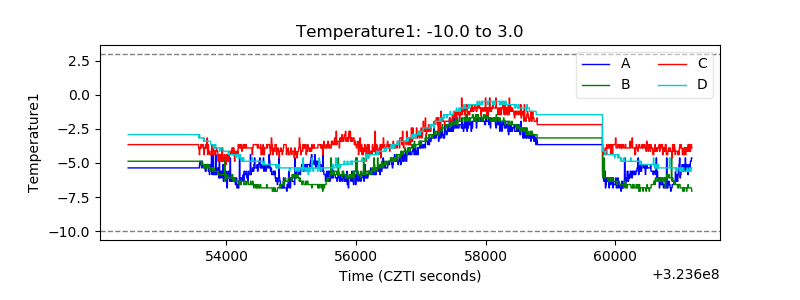 |
| Veto HV Monitor | 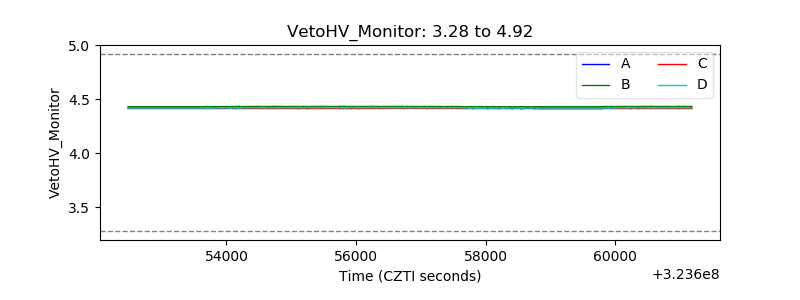 |
| Veto LLD | 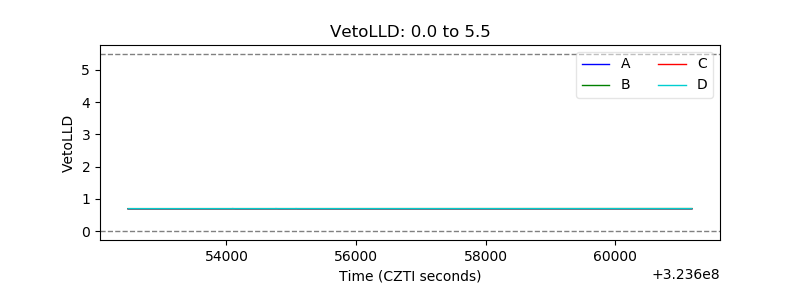 |
| Alpha Counter | 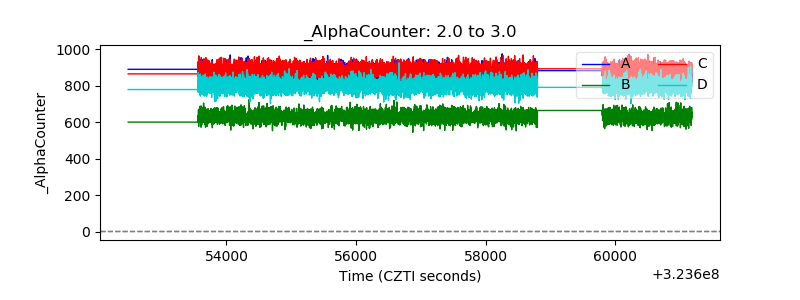 |
| _CPM_Rate | 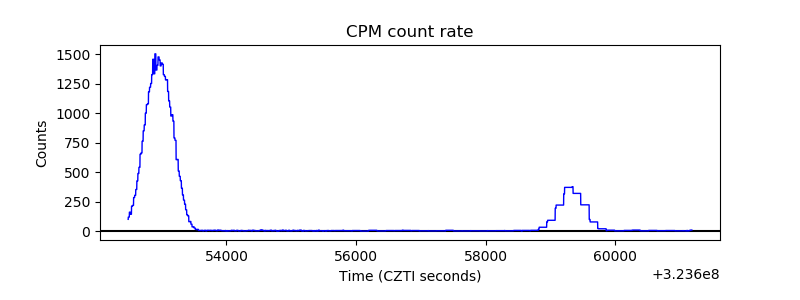 |
| CZT Counter | 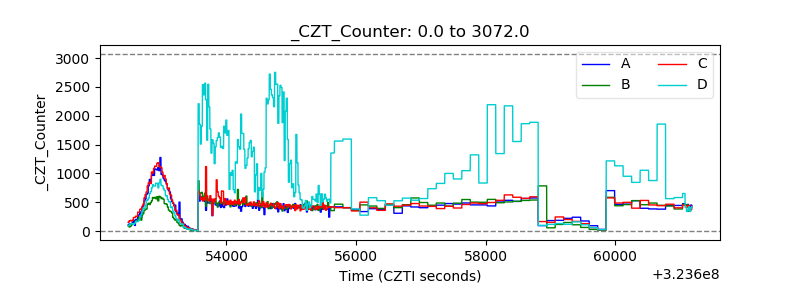 |
| +2.5 Volts monitor |  |
| +5 Volts monitor |  |
| _ROLL_ROT | 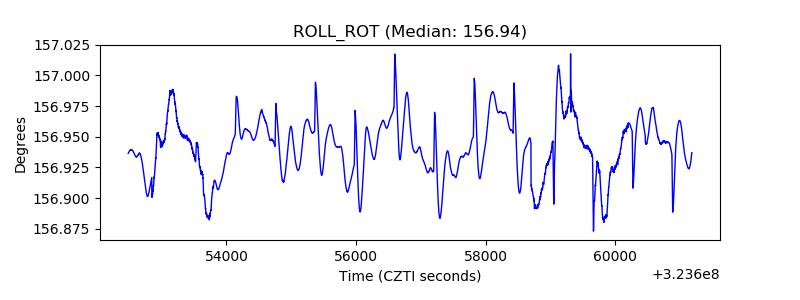 |
| _Roll_DEC | 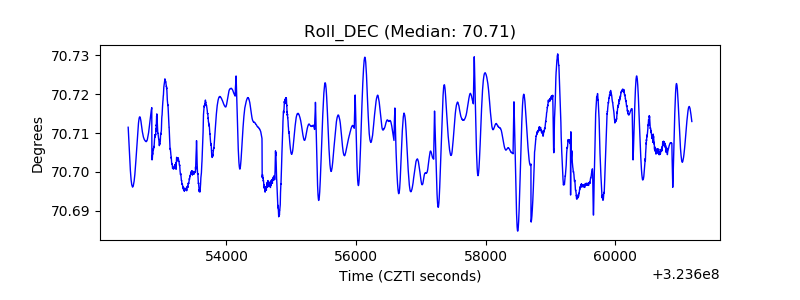 |
| _Roll_RA |  |
| Veto Counter | 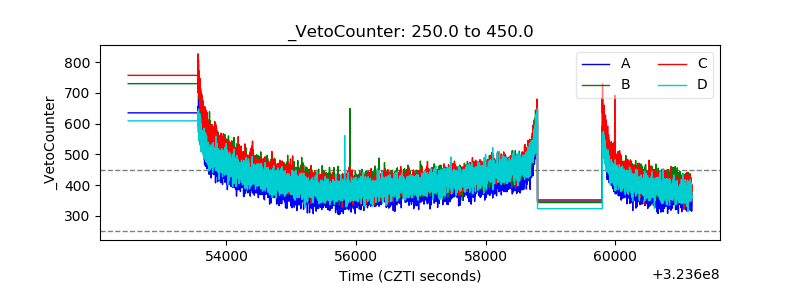 |