| Param | Original file | Final file |
|---|---|---|
| Filename | modeM0/AS1A07_054T01_9000003604_24422cztM0_level2.evt | modeM0/AS1A07_054T01_9000003604_24422cztM0_level2_quad_clean.evt |
| Size (bytes) | 495,345,600 | 138,072,960 |
| Size | 472.4 MB | 131.7 MB |
| Events in quadrant A | 3,348,056 | 928,538 |
| Events in quadrant B | 3,396,577 | 948,597 |
| Events in quadrant C | 3,381,104 | 918,006 |
| Events in quadrant D | 4,379,615 | 878,591 |
| Mode M0 | |||
|---|---|---|---|
| Quadrant | BADHDUFLAG | Total packets | Discarded packets |
| A | 0 | 15003 | 3 |
| B | 0 | 15055 | 2 |
| C | 0 | 14981 | 2 |
| D | 0 | 18175 | 2 |
| Mode M9 | |||
|---|---|---|---|
| Quadrant | BADHDUFLAG | Total packets | Discarded packets |
| A | 0 | 7 | 0 |
| B | 0 | 8 | 0 |
| C | 0 | 8 | 0 |
| D | 0 | 8 | 0 |
| Mode SS | |||
|---|---|---|---|
| Quadrant | BADHDUFLAG | Total packets | Discarded packets |
| A | 0 | 148 | 0 |
| B | 0 | 148 | 0 |
| C | 0 | 148 | 0 |
| D | 0 | 148 | 0 |
| Quadrant | Total seconds | Saturated seconds | Saturation percentage |
|---|---|---|---|
| A | 7302 | 68 | 0.931252% |
| B | 7302 | 130 | 1.780334% |
| C | 7302 | 107 | 1.465352% |
| D | 7302 | 237 | 3.245686% |
Noise dominated data is calculated using 1-second bins in cleaned event files. If a bin has >2000 counts, and if more than 50% of those come from <1% of pixels, then it is considered to be noise-dominated and hence unusable.
| Quadrant | # 1 sec bins | Bins with >0 counts | Bins with >2000 counts | High rate bins dominated by noise | Noise dominated (total time) | Noise dominated (detector-on time) | Marked lightcurve |
|---|---|---|---|---|---|---|---|
| A | 7847 | 7304 | 0 | 0 | 0.00% | 0.00% | 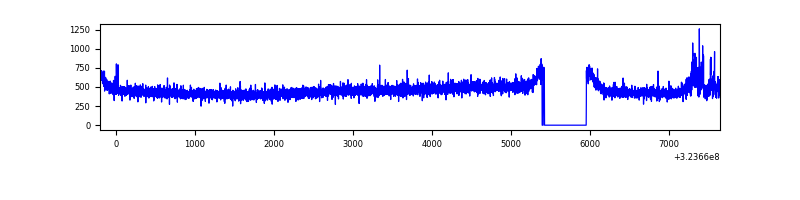 |
| B | 7847 | 7304 | 11 | 11 | 0.14% | 0.15% | 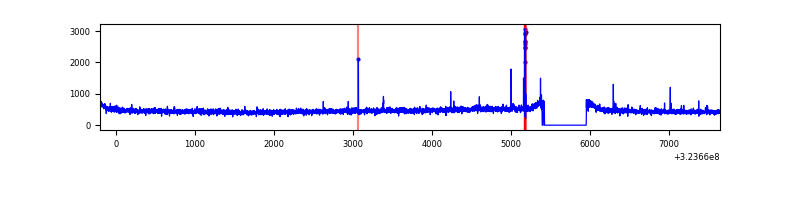 |
| C | 7847 | 7304 | 0 | 0 | 0.00% | 0.00% | 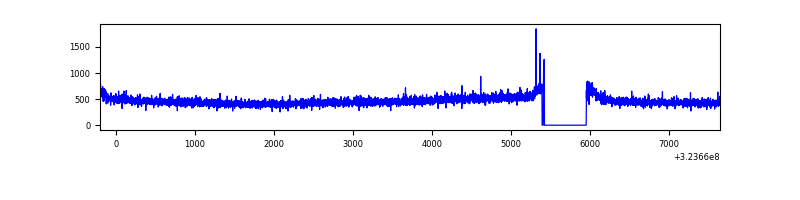 |
| D | 7847 | 7304 | 138 | 138 | 1.76% | 1.89% | 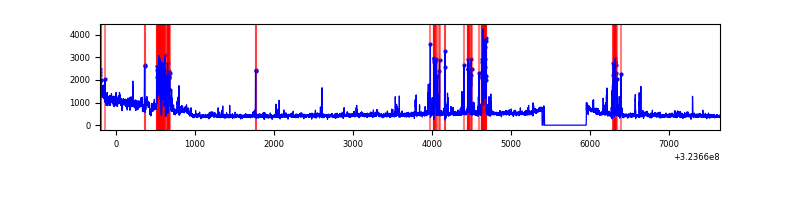 |
Top three noisy pixels from each quadrant. If the there are fewer than three noisy pixels in the level2.evt file, extra rows are filled as -1
| Pixel properties | Quadrant properties | ||||||
|---|---|---|---|---|---|---|---|
| Quadrant | DetID | PixID | Counts | Sigma | Mean | Median | Sigma |
| A | 15 | 174 | 63668 | 368.49 | 852 | 833 | 170.5 |
| A | 13 | 254 | 11775 | 64.17 | 852 | 833 | 170.5 |
| A | 3 | 137 | 7699 | 40.26 | 852 | 833 | 170.5 |
| B | 3 | 64 | 37237 | 224.45 | 855 | 832 | 162.2 |
| B | 12 | 111 | 19710 | 116.39 | 855 | 832 | 162.2 |
| B | 11 | 111 | 17624 | 103.53 | 855 | 832 | 162.2 |
| C | 14 | 238 | 132682 | 682.79 | 828 | 834 | 193.1 |
| C | 3 | 233 | 15674 | 76.85 | 828 | 834 | 193.1 |
| C | 2 | 16 | 6167 | 27.62 | 828 | 834 | 193.1 |
| D | 7 | 238 | 589674 | 2948.27 | 820 | 793 | 199.7 |
| D | 12 | 218 | 425107 | 2124.36 | 820 | 793 | 199.7 |
| D | 1 | 52 | 132030 | 657.05 | 820 | 793 | 199.7 |
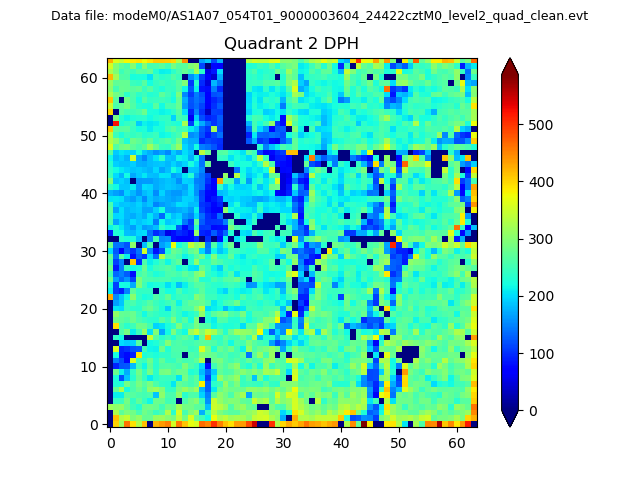
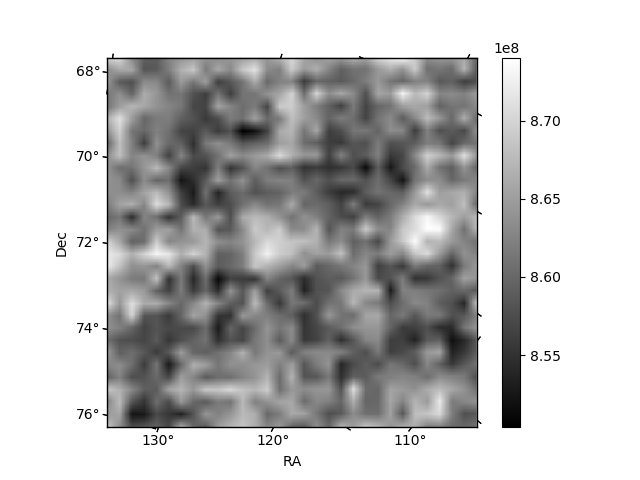
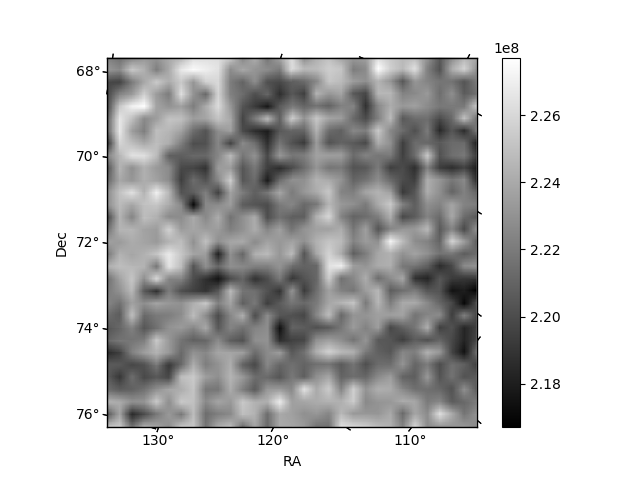
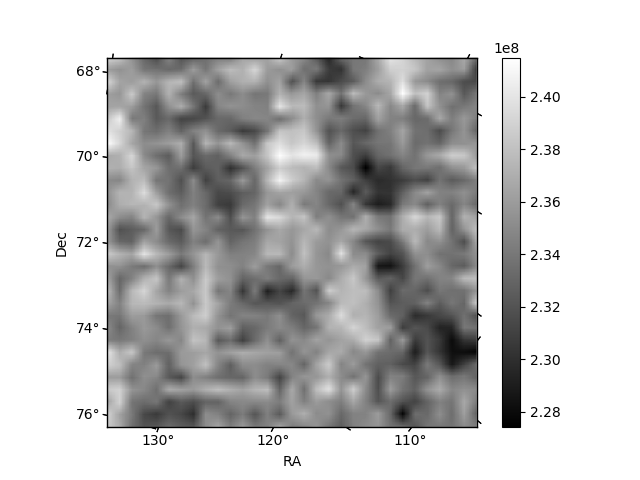
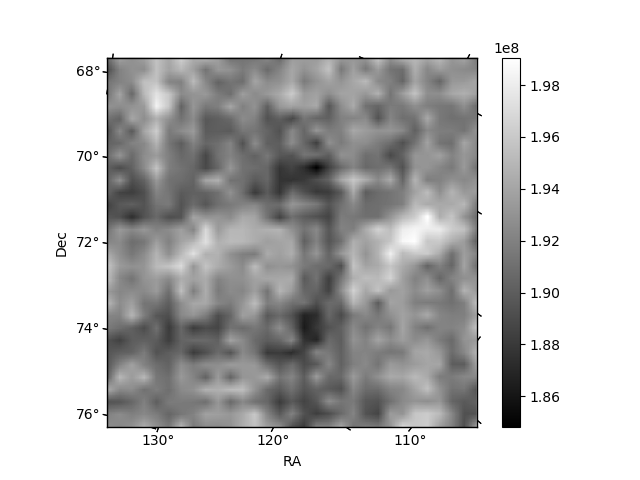
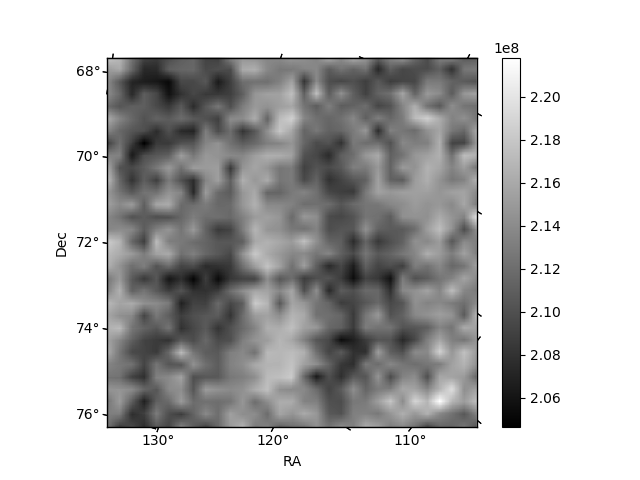
Histogram calculated using DETX and DETY for each event in the final _common_clean file
| Quadrant A | 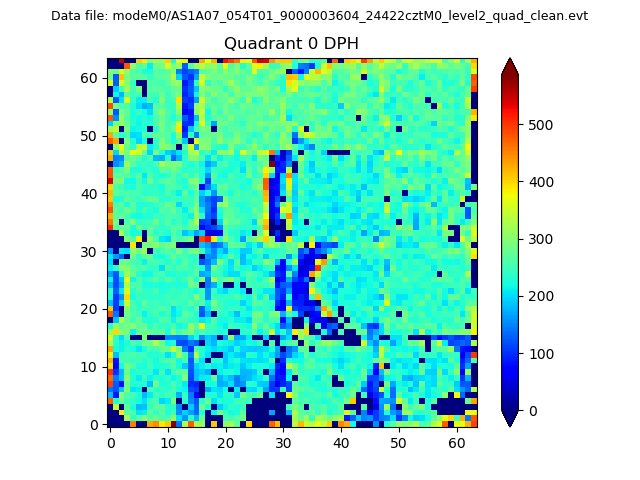 |
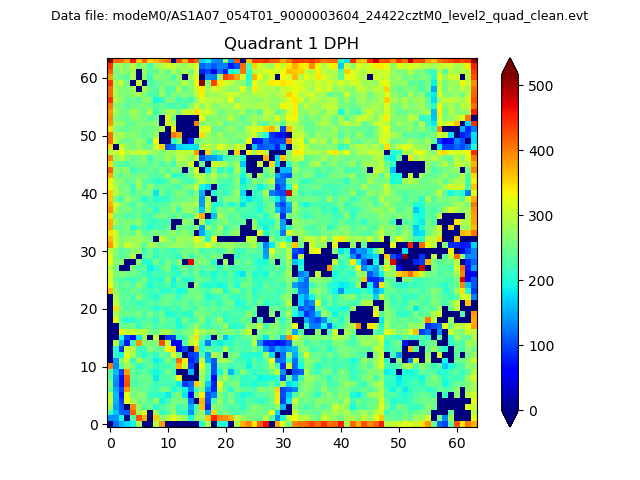 |
Quadrant B |
|---|---|---|---|
| Quadrant D | 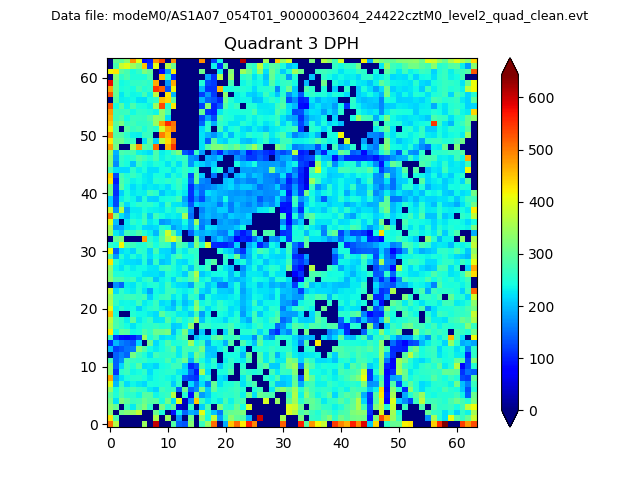 |
 |
Quadrant C |
| Plot type | Count rate plots | Images |
|---|---|---|
| Comparison with Poisson distribution Blue bars denote a histogram of data divided into 1 sec bins. Red curve is a Poisson curve with rate = median count rate of data. |
 |
 |
| Quadrant-wise count rates Data is divided into 100 sec bins |
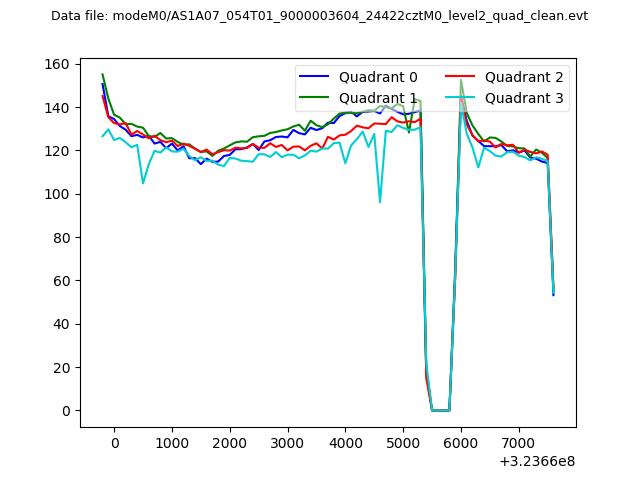 |
|
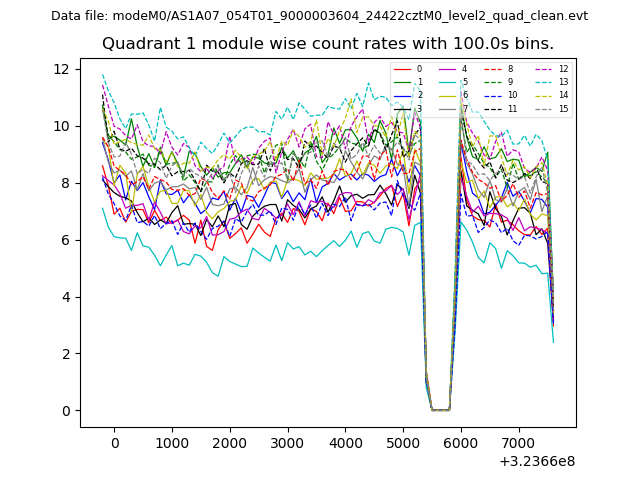
| Module-wise count rates for Quadrant A Data is divided into 100 sec bins |
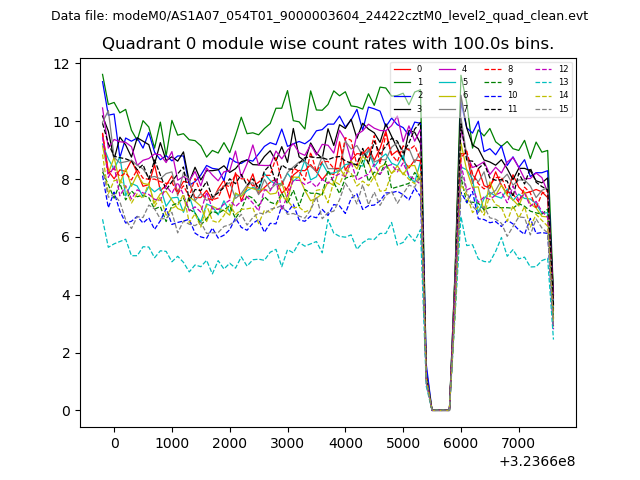 |
 |
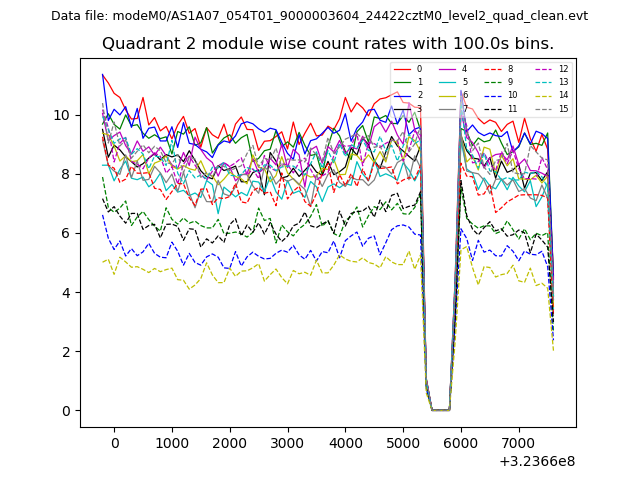
| Module-wise count rates for Quadrant B Data is divided into 100 sec bins |
 |
 |
| Module-wise count rates for Quadrant C Data is divided into 100 sec bins |
 |
 |
| Module-wise count rates for Quadrant D Data is divided into 100 sec bins |
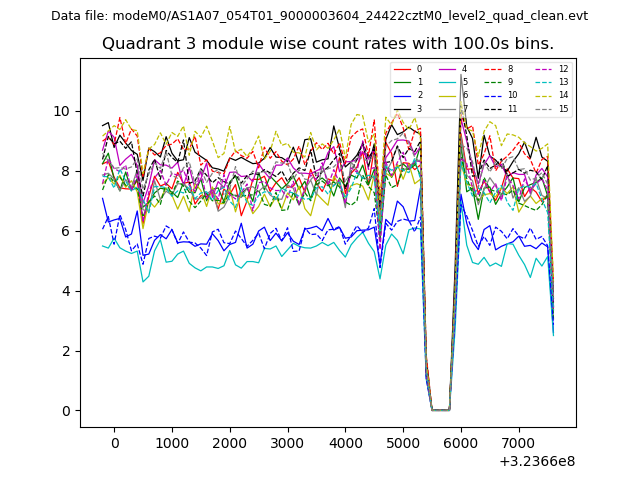 |
 |
| Parameter | Plot |
|---|---|
| CZT HV Monitor | 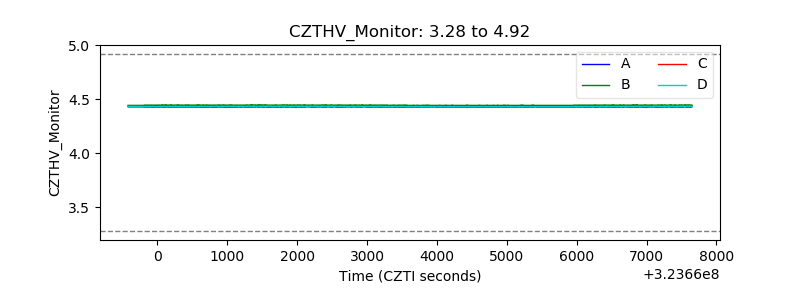 |
| D_VDD | 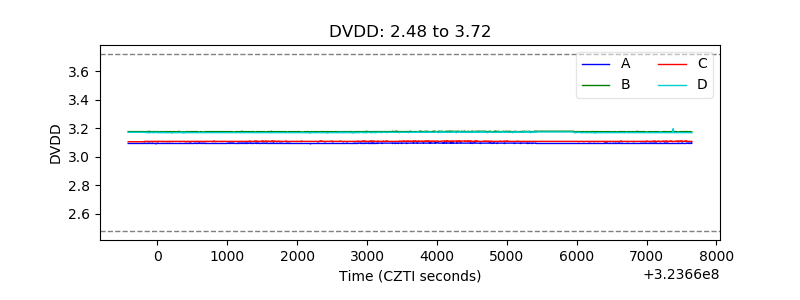 |
| Temperature 1 | 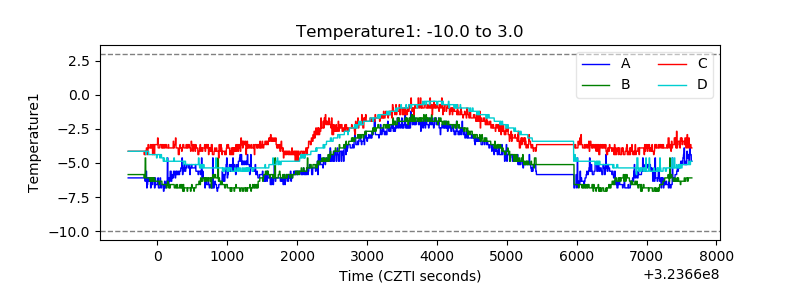 |
| Veto HV Monitor | 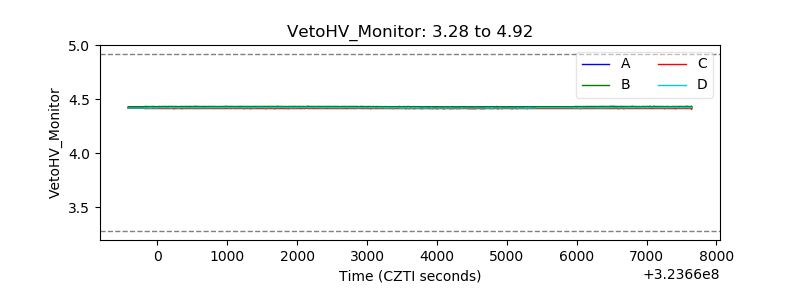 |
| Veto LLD | 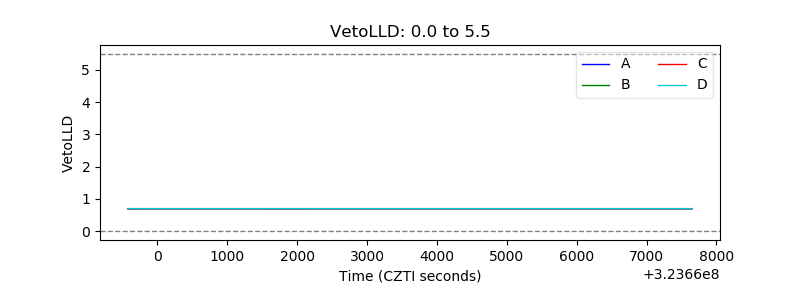 |
| Alpha Counter | 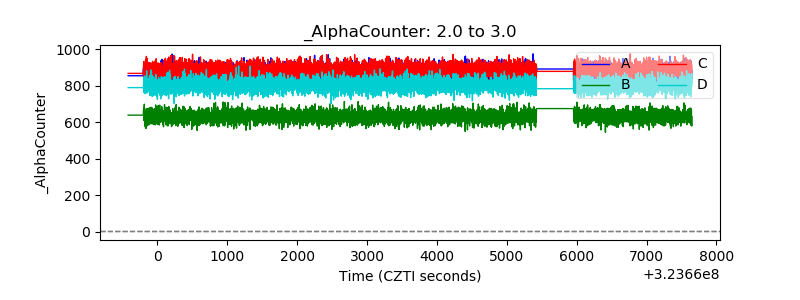 |
| _CPM_Rate | 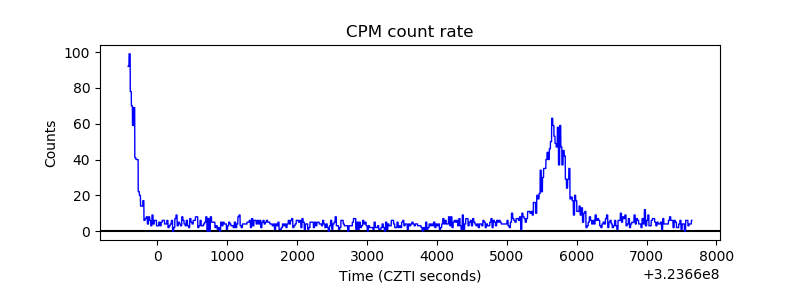 |
| CZT Counter | 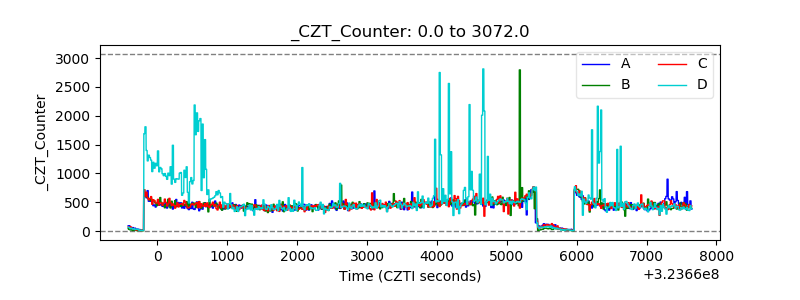 |
| +2.5 Volts monitor |  |
| +5 Volts monitor |  |
| _ROLL_ROT | 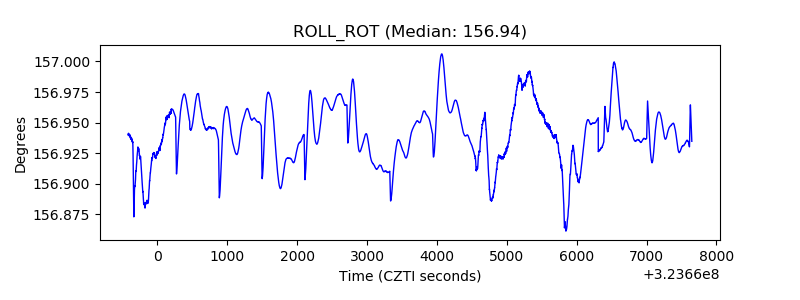 |
| _Roll_DEC | 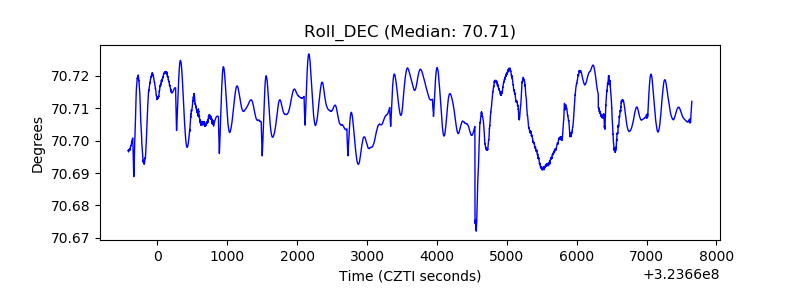 |
| _Roll_RA | 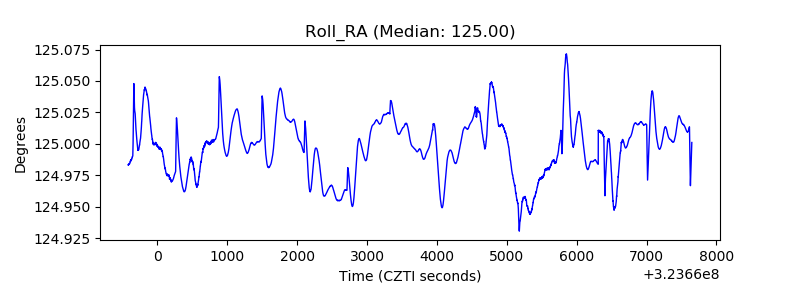 |
| Veto Counter | 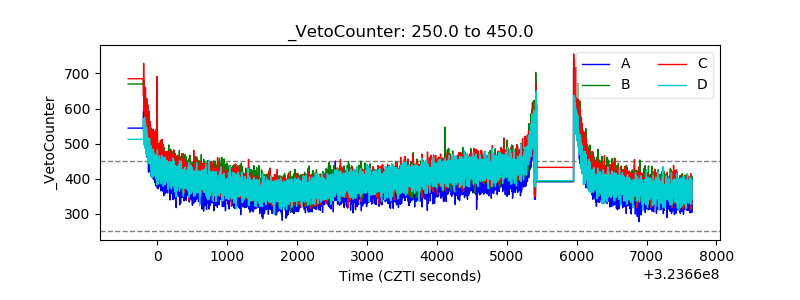 |