| Param | Original file | Final file |
|---|---|---|
| Filename | modeM0/AS1A07_054T01_9000003604_24424cztM0_level2.evt | modeM0/AS1A07_054T01_9000003604_24424cztM0_level2_quad_clean.evt |
| Size (bytes) | 577,748,160 | 127,123,200 |
| Size | 551.0 MB | 121.2 MB |
| Events in quadrant A | 3,182,026 | 865,826 |
| Events in quadrant B | 3,483,601 | 875,751 |
| Events in quadrant C | 3,181,662 | 851,032 |
| Events in quadrant D | 7,176,111 | 770,644 |
| Mode M0 | |||
|---|---|---|---|
| Quadrant | BADHDUFLAG | Total packets | Discarded packets |
| A | 0 | 14288 | 1 |
| B | 0 | 15026 | 1 |
| C | 0 | 14169 | 2 |
| D | 0 | 26223 | 1 |
| Mode M9 | |||
|---|---|---|---|
| Quadrant | BADHDUFLAG | Total packets | Discarded packets |
| A | 0 | 3 | 0 |
| B | 0 | 3 | 0 |
| C | 0 | 3 | 0 |
| D | 0 | 3 | 0 |
| Mode SS | |||
|---|---|---|---|
| Quadrant | BADHDUFLAG | Total packets | Discarded packets |
| A | 0 | 142 | 0 |
| B | 0 | 142 | 0 |
| C | 0 | 142 | 0 |
| D | 0 | 142 | 0 |
| Quadrant | Total seconds | Saturated seconds | Saturation percentage |
|---|---|---|---|
| A | 6986 | 88 | 1.259662% |
| B | 6987 | 208 | 2.976957% |
| C | 6986 | 82 | 1.173776% |
| D | 6986 | 911 | 13.040366% |
Noise dominated data is calculated using 1-second bins in cleaned event files. If a bin has >2000 counts, and if more than 50% of those come from <1% of pixels, then it is considered to be noise-dominated and hence unusable.
| Quadrant | # 1 sec bins | Bins with >0 counts | Bins with >2000 counts | High rate bins dominated by noise | Noise dominated (total time) | Noise dominated (detector-on time) | Marked lightcurve |
|---|---|---|---|---|---|---|---|
| A | 7251 | 6987 | 6 | 6 | 0.08% | 0.09% | 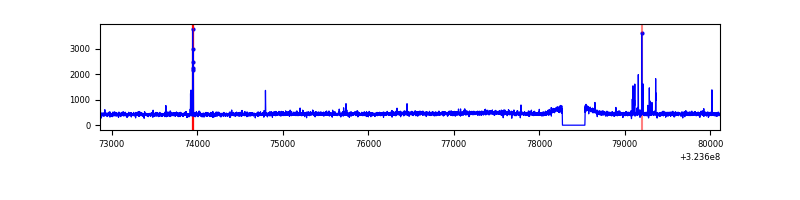 |
| B | 7252 | 6988 | 71 | 71 | 0.98% | 1.02% | 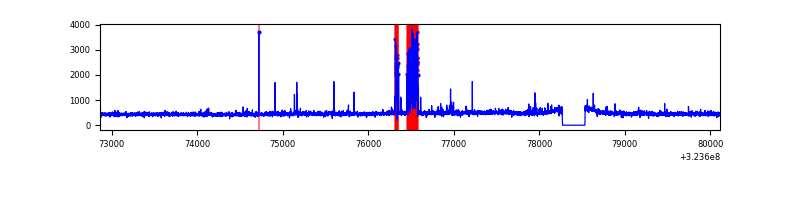 |
| C | 7251 | 6987 | 0 | 0 | 0.00% | 0.00% | 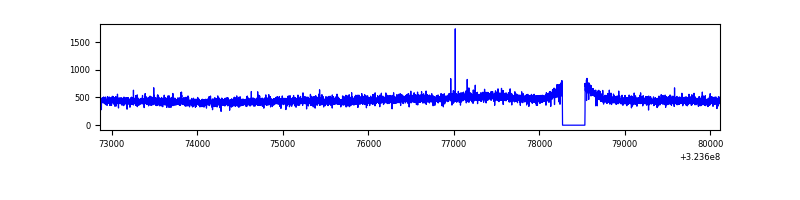 |
| D | 7251 | 6987 | 811 | 811 | 11.18% | 11.61% | 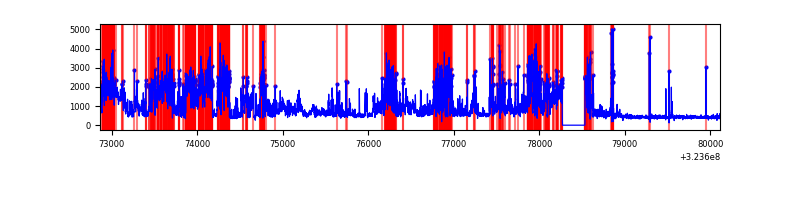 |
Top three noisy pixels from each quadrant. If the there are fewer than three noisy pixels in the level2.evt file, extra rows are filled as -1
| Pixel properties | Quadrant properties | ||||||
|---|---|---|---|---|---|---|---|
| Quadrant | DetID | PixID | Counts | Sigma | Mean | Median | Sigma |
| A | 4 | 2 | 54997 | 330.82 | 811 | 794 | 163.8 |
| A | 13 | 254 | 11030 | 62.47 | 811 | 794 | 163.8 |
| A | 3 | 137 | 7279 | 39.58 | 811 | 794 | 163.8 |
| B | 3 | 64 | 301280 | 1945.93 | 808 | 785 | 154.4 |
| B | 12 | 111 | 18964 | 117.72 | 808 | 785 | 154.4 |
| B | 11 | 111 | 16842 | 103.98 | 808 | 785 | 154.4 |
| C | 14 | 238 | 125135 | 683.06 | 780 | 783 | 182.1 |
| C | 3 | 233 | 10358 | 52.59 | 780 | 783 | 182.1 |
| C | 2 | 16 | 6968 | 33.97 | 780 | 783 | 182.1 |
| D | 9 | 35 | 3600208 | 19651.94 | 750 | 727 | 183.2 |
| D | 12 | 218 | 455879 | 2484.98 | 750 | 727 | 183.2 |
| D | 1 | 52 | 194006 | 1055.24 | 750 | 727 | 183.2 |
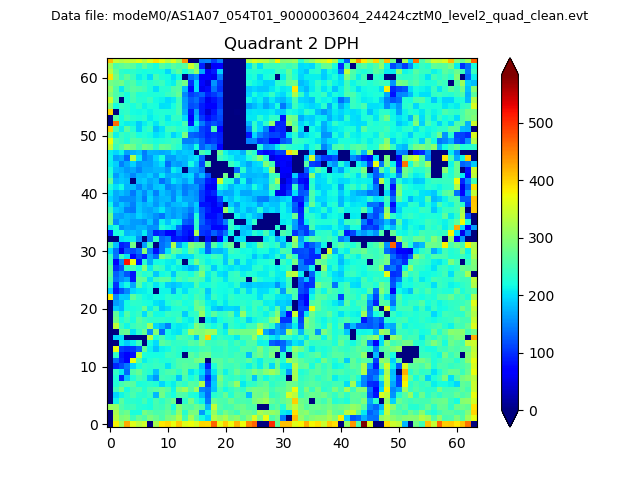
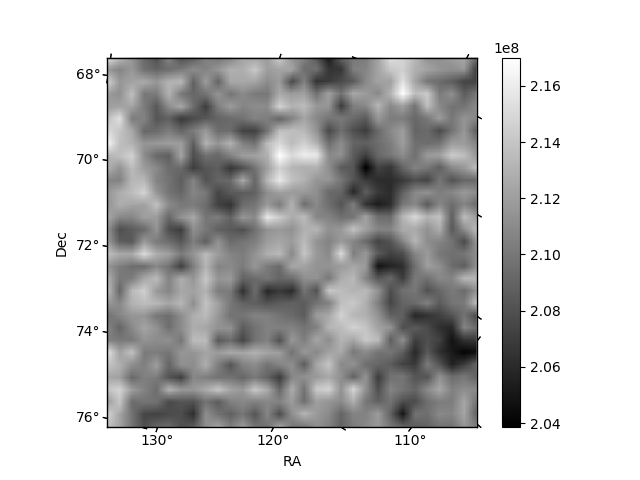
Histogram calculated using DETX and DETY for each event in the final _common_clean file
| Quadrant A | 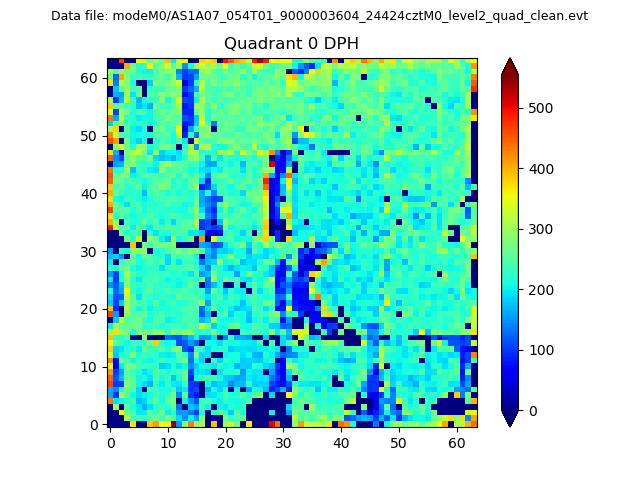 |
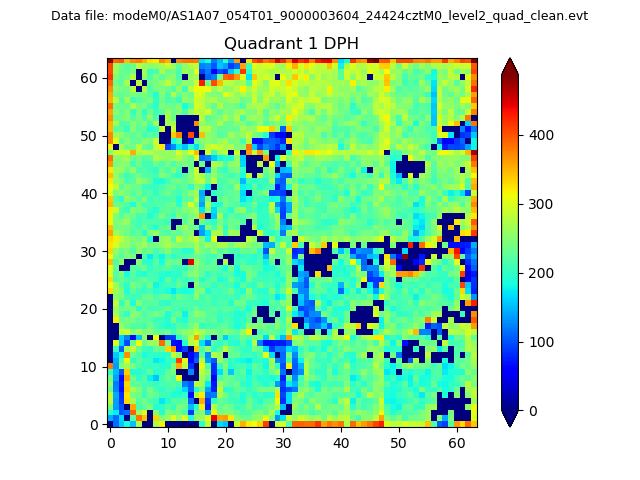 |
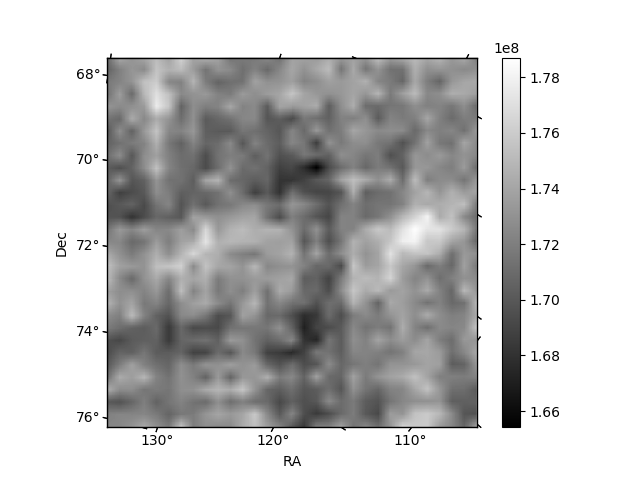
Quadrant B |
|---|---|---|---|
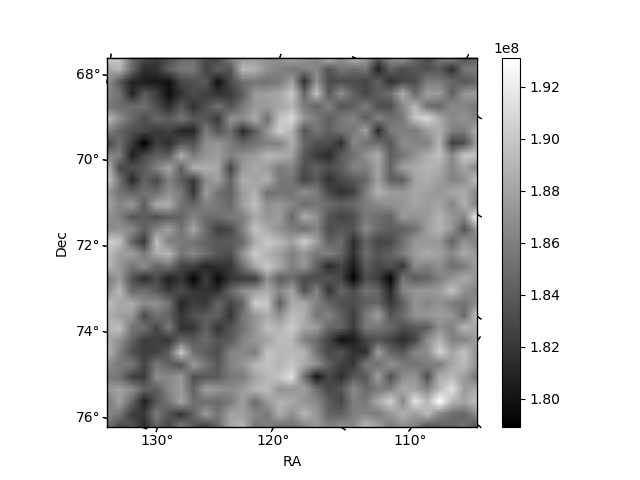
| Quadrant D | 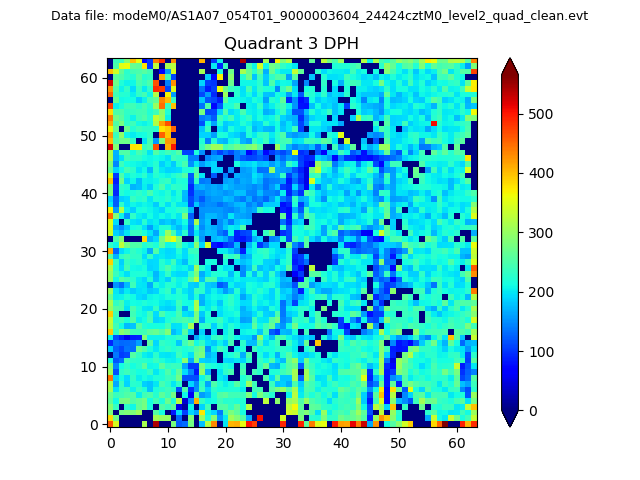 |
 |
Quadrant C |
| Plot type | Count rate plots | Images |
|---|---|---|
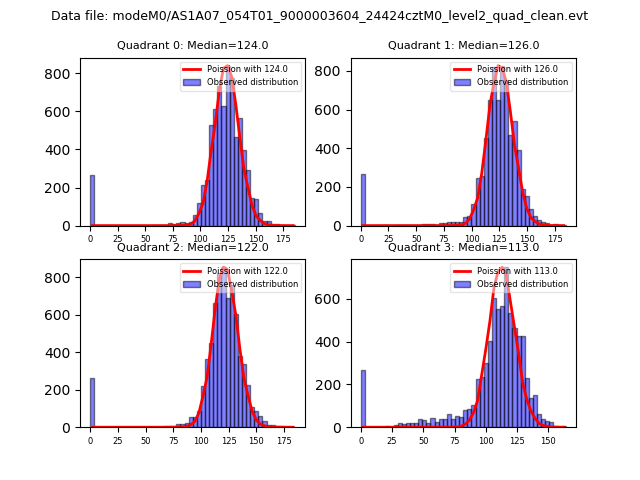
| Comparison with Poisson distribution Blue bars denote a histogram of data divided into 1 sec bins. Red curve is a Poisson curve with rate = median count rate of data. |
 |
 |
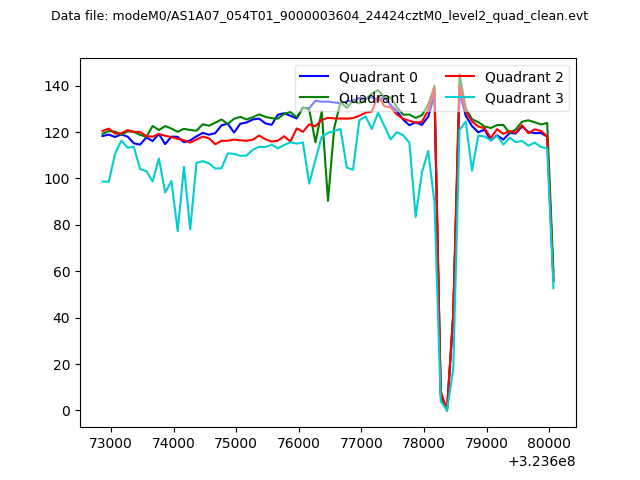
| Quadrant-wise count rates Data is divided into 100 sec bins |
 |
|
| Module-wise count rates for Quadrant A Data is divided into 100 sec bins |
 |
 |
| Module-wise count rates for Quadrant B Data is divided into 100 sec bins |
 |
 |
| Module-wise count rates for Quadrant C Data is divided into 100 sec bins |
 |
 |
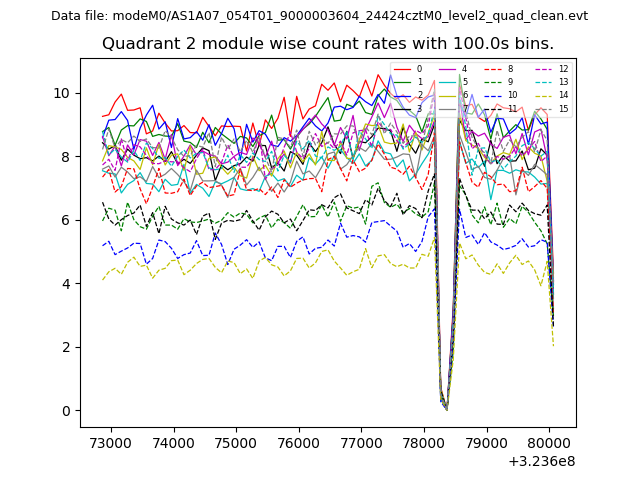
| Module-wise count rates for Quadrant D Data is divided into 100 sec bins |
 |
 |
| Parameter | Plot |
|---|---|
| CZT HV Monitor |  |
| D_VDD |  |
| Temperature 1 | 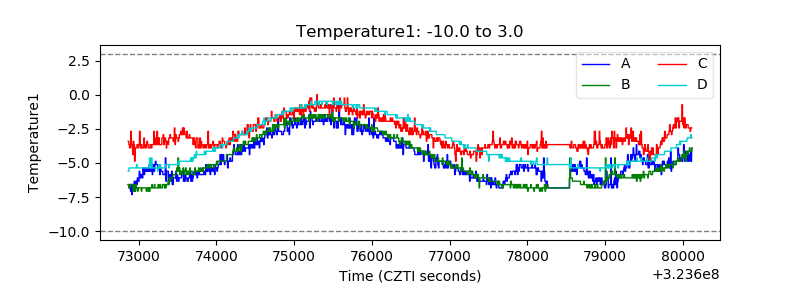 |
| Veto HV Monitor | 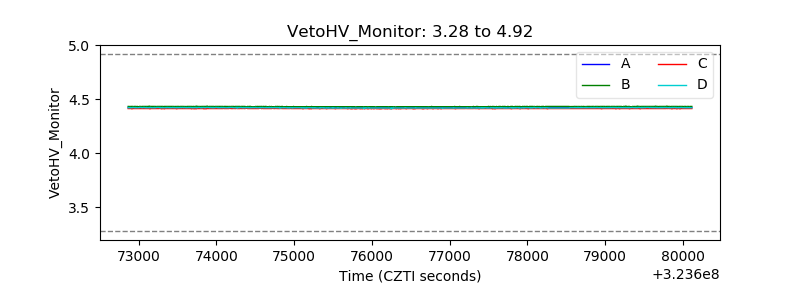 |
| Veto LLD |  |
| Alpha Counter | 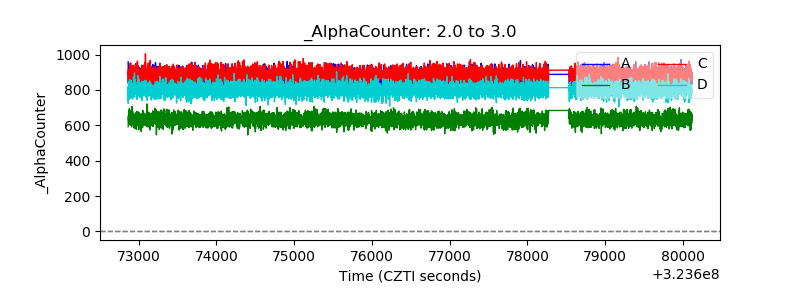 |
| _CPM_Rate | 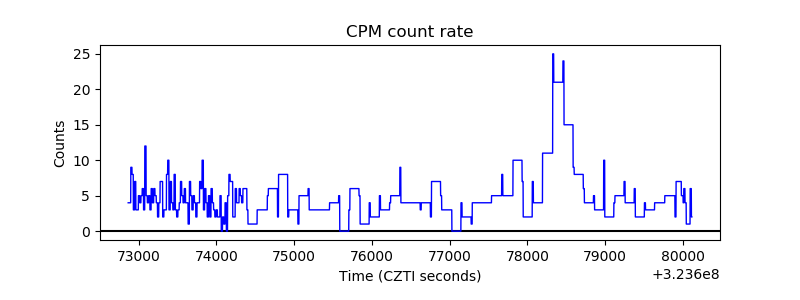 |
| CZT Counter | 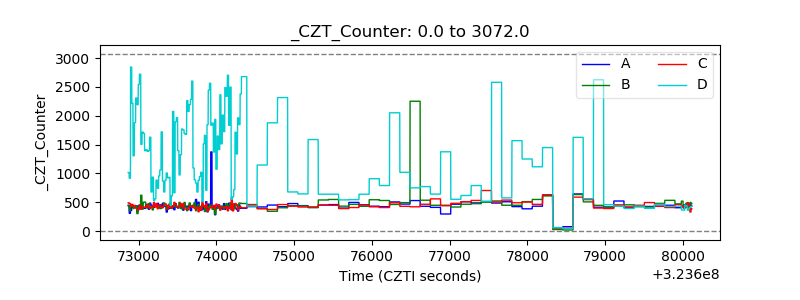 |
| +2.5 Volts monitor |  |
| +5 Volts monitor |  |
| _ROLL_ROT |  |
| _Roll_DEC | 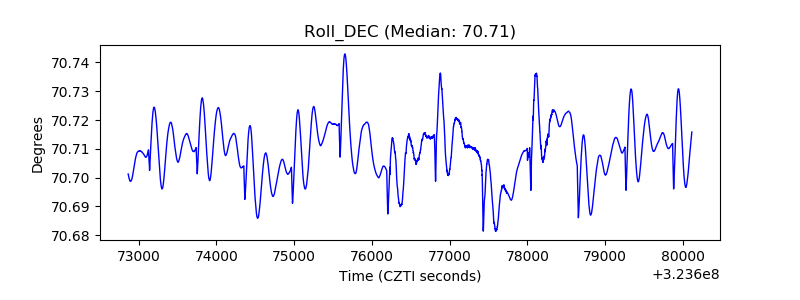 |
| _Roll_RA | 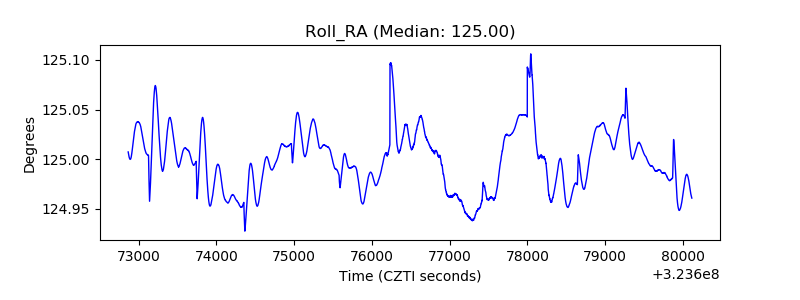 |
| Veto Counter |  |