| Param | Original file | Final file |
|---|---|---|
| Filename | modeM0/AS1A07_054T01_9000003604_24428cztM0_level2.evt | modeM0/AS1A07_054T01_9000003604_24428cztM0_level2_quad_clean.evt |
| Size (bytes) | 1,585,765,440 | 258,471,360 |
| Size | 1.5 GB | 246.5 MB |
| Events in quadrant A | 6,985,587 | 1,923,090 |
| Events in quadrant B | 7,253,248 | 1,952,713 |
| Events in quadrant C | 7,261,169 | 1,865,308 |
| Events in quadrant D | 25,478,810 | 1,015,230 |
| Mode M0 | |||
|---|---|---|---|
| Quadrant | BADHDUFLAG | Total packets | Discarded packets |
| A | 0 | 31465 | 0 |
| B | 0 | 31852 | 0 |
| C | 0 | 31857 | 0 |
| D | 0 | 86230 | 0 |
| Mode M9 | |||
|---|---|---|---|
| Quadrant | BADHDUFLAG | Total packets | Discarded packets |
| A | 0 | 10 | 0 |
| B | 0 | 10 | 0 |
| C | 0 | 10 | 0 |
| D | 0 | 10 | 0 |
| Mode SS | |||
|---|---|---|---|
| Quadrant | BADHDUFLAG | Total packets | Discarded packets |
| A | 0 | 316 | 0 |
| B | 0 | 316 | 0 |
| C | 0 | 316 | 0 |
| D | 0 | 316 | 0 |
| Quadrant | Total seconds | Saturated seconds | Saturation percentage |
|---|---|---|---|
| A | 15486 | 151 | 0.975074% |
| B | 15487 | 141 | 0.910441% |
| C | 15487 | 172 | 1.110609% |
| D | 15487 | 8067 | 52.088849% |
Noise dominated data is calculated using 1-second bins in cleaned event files. If a bin has >2000 counts, and if more than 50% of those come from <1% of pixels, then it is considered to be noise-dominated and hence unusable.
| Quadrant | # 1 sec bins | Bins with >0 counts | Bins with >2000 counts | High rate bins dominated by noise | Noise dominated (total time) | Noise dominated (detector-on time) | Marked lightcurve |
|---|---|---|---|---|---|---|---|
| A | 16521 | 15489 | 10 | 10 | 0.06% | 0.06% | 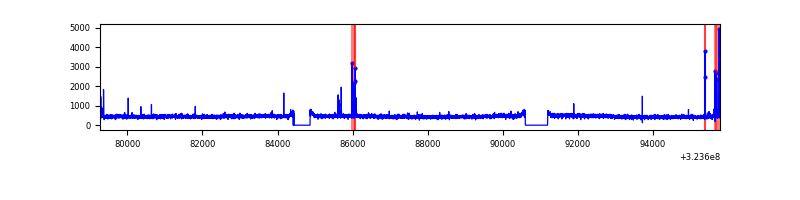 |
| B | 16522 | 15490 | 3 | 3 | 0.02% | 0.02% | 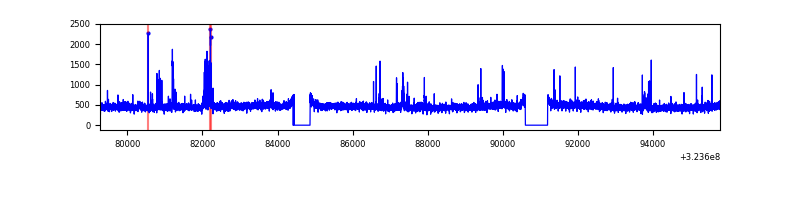 |
| C | 16522 | 15490 | 13 | 13 | 0.08% | 0.08% | 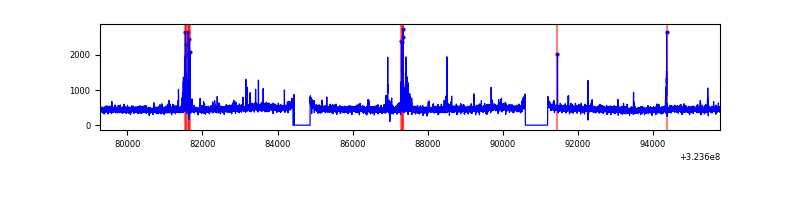 |
| D | 16521 | 15488 | 7606 | 7606 | 46.04% | 49.11% | 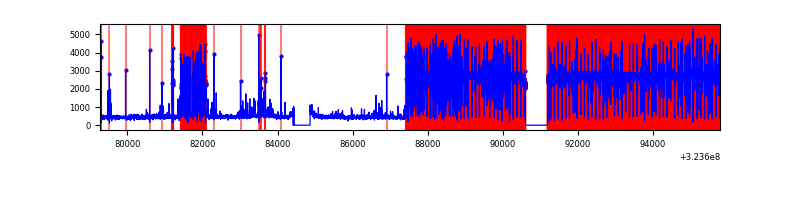 |
Top three noisy pixels from each quadrant. If the there are fewer than three noisy pixels in the level2.evt file, extra rows are filled as -1
| Pixel properties | Quadrant properties | ||||||
|---|---|---|---|---|---|---|---|
| Quadrant | DetID | PixID | Counts | Sigma | Mean | Median | Sigma |
| A | 4 | 2 | 90543 | 247.72 | 1788 | 1749 | 358.4 |
| A | 13 | 254 | 24934 | 64.68 | 1788 | 1749 | 358.4 |
| A | 3 | 137 | 16062 | 39.93 | 1788 | 1749 | 358.4 |
| B | 0 | 190 | 96186 | 279.07 | 1787 | 1740 | 338.4 |
| B | 3 | 64 | 86508 | 250.48 | 1787 | 1740 | 338.4 |
| B | 12 | 17 | 66929 | 192.62 | 1787 | 1740 | 338.4 |
| C | 14 | 238 | 272118 | 676.52 | 1725 | 1732 | 399.7 |
| C | 2 | 16 | 232286 | 576.86 | 1725 | 1732 | 399.7 |
| C | 3 | 233 | 33854 | 80.37 | 1725 | 1732 | 399.7 |
| D | 9 | 35 | 19514686 | 75896.91 | 1052 | 1020 | 257.1 |
| D | 12 | 218 | 1004597 | 3903.34 | 1052 | 1020 | 257.1 |
| D | 1 | 52 | 590063 | 2291.04 | 1052 | 1020 | 257.1 |
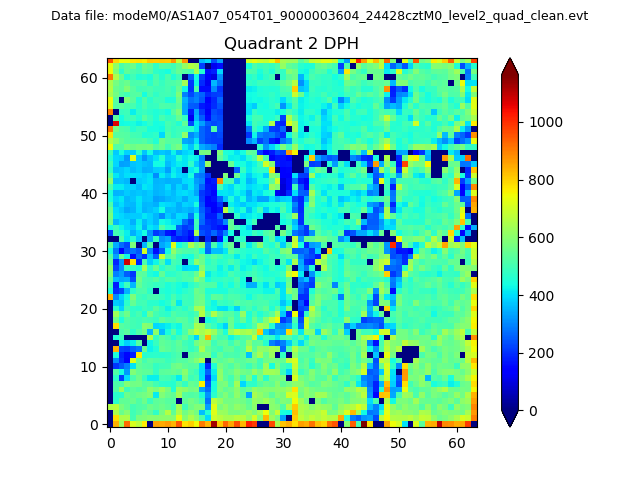
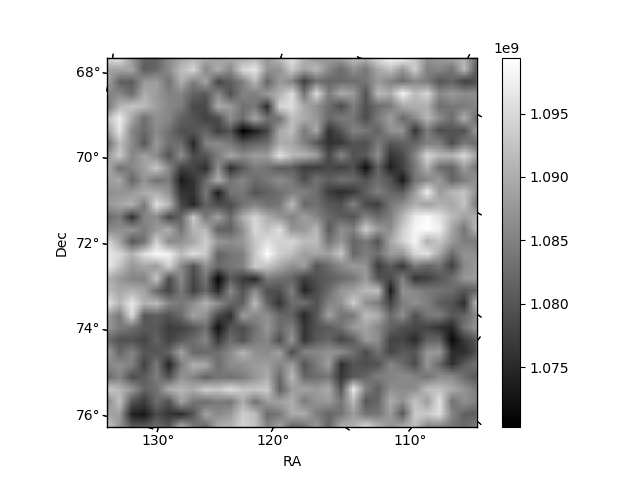
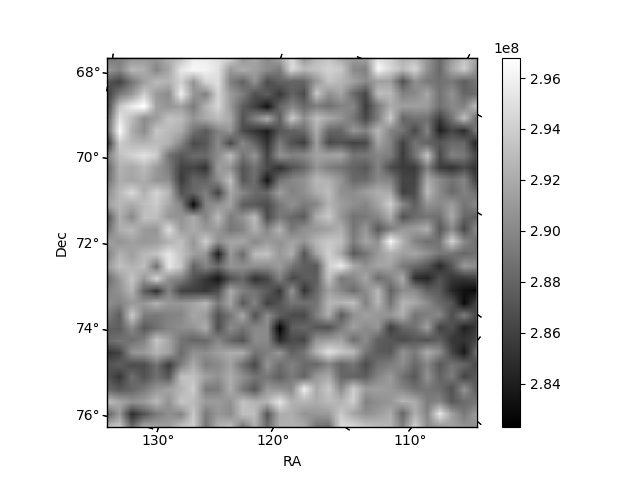
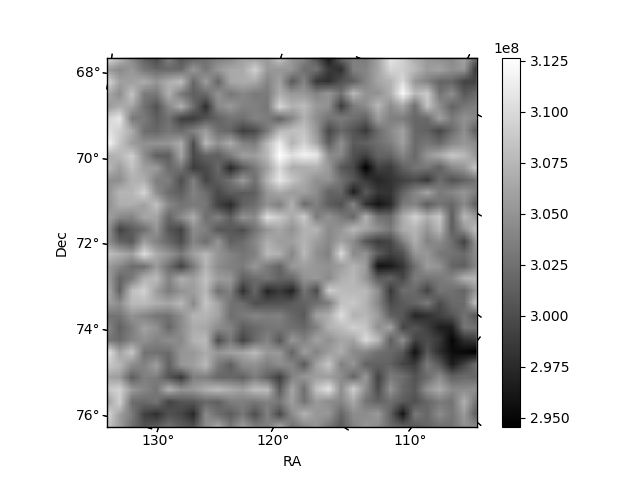
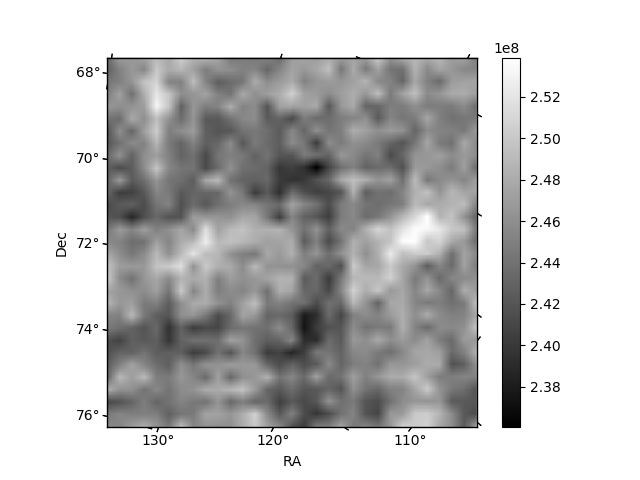
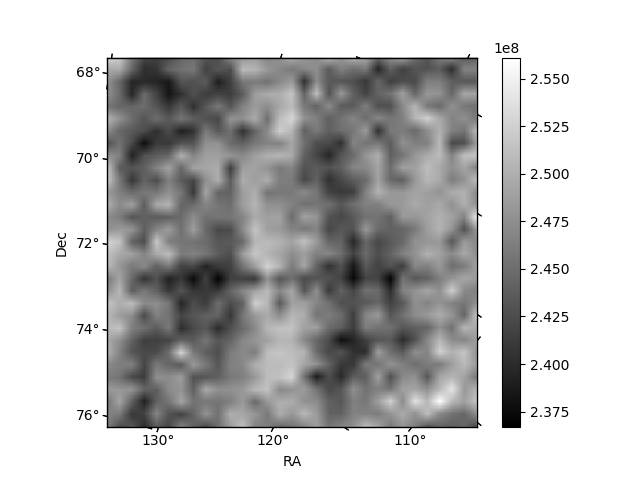
Histogram calculated using DETX and DETY for each event in the final _common_clean file
| Quadrant A | 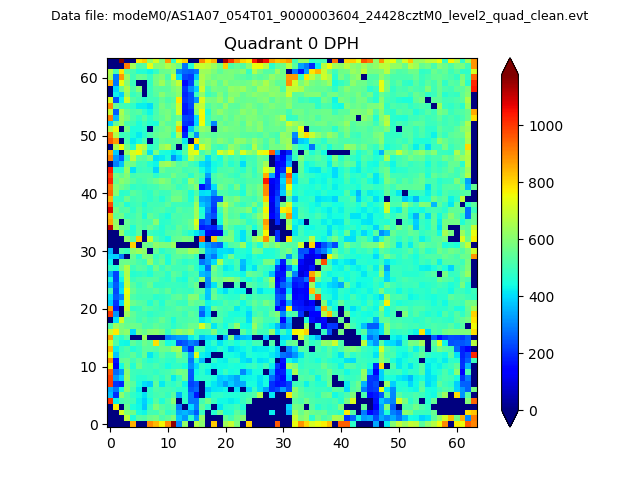 |
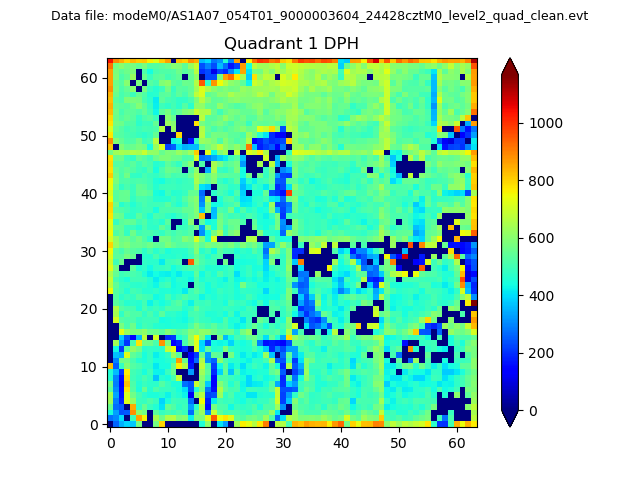 |
Quadrant B |
|---|---|---|---|
| Quadrant D | 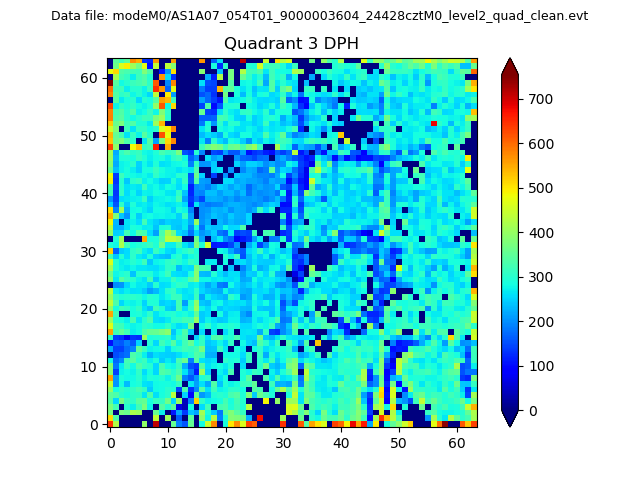 |
 |
Quadrant C |
| Plot type | Count rate plots | Images |
|---|---|---|
| Comparison with Poisson distribution Blue bars denote a histogram of data divided into 1 sec bins. Red curve is a Poisson curve with rate = median count rate of data. |
 |
 |
| Quadrant-wise count rates Data is divided into 100 sec bins |
 |
|
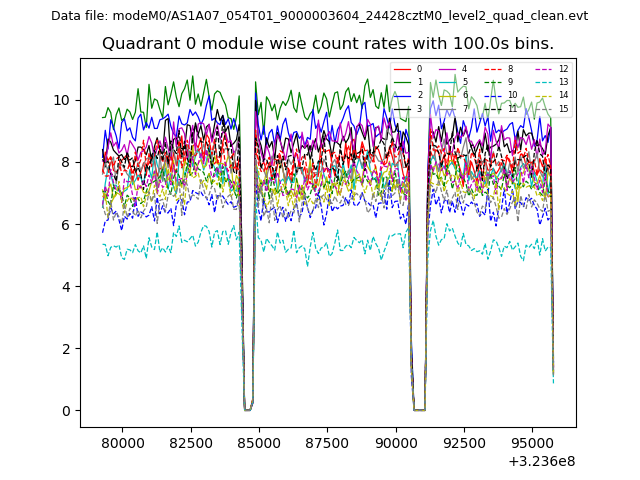
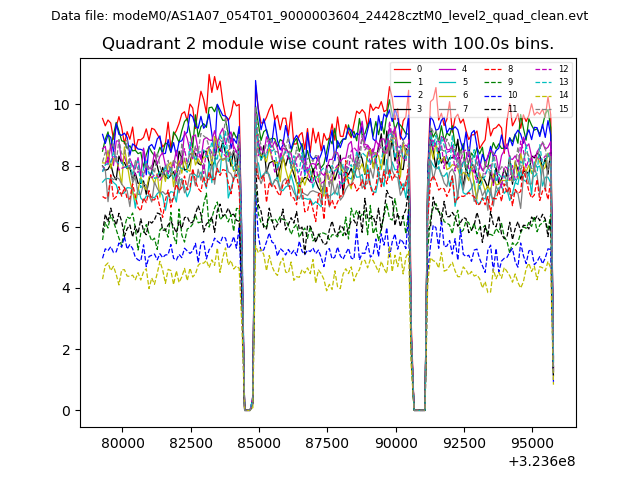
| Module-wise count rates for Quadrant A Data is divided into 100 sec bins |
 |
 |
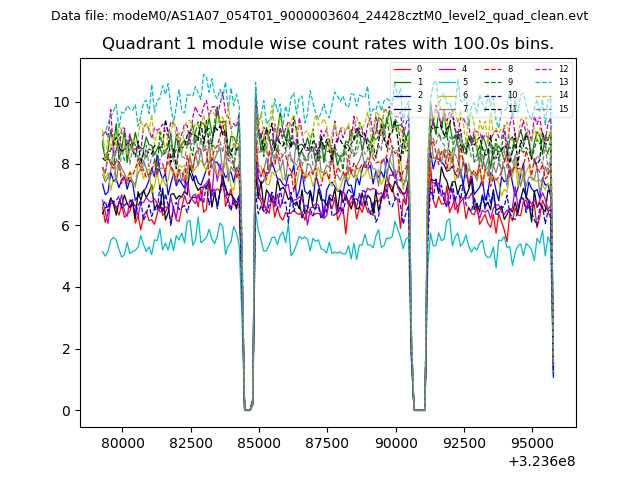
| Module-wise count rates for Quadrant B Data is divided into 100 sec bins |
 |
 |
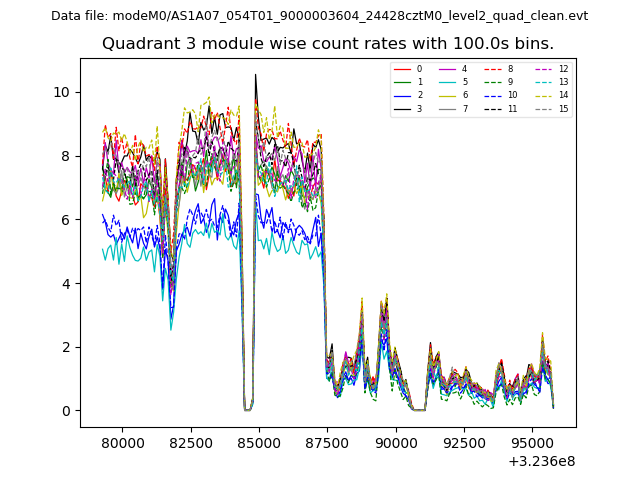
| Module-wise count rates for Quadrant C Data is divided into 100 sec bins |
 |
 |
| Module-wise count rates for Quadrant D Data is divided into 100 sec bins |
 |
 |
| Parameter | Plot |
|---|---|
| CZT HV Monitor | 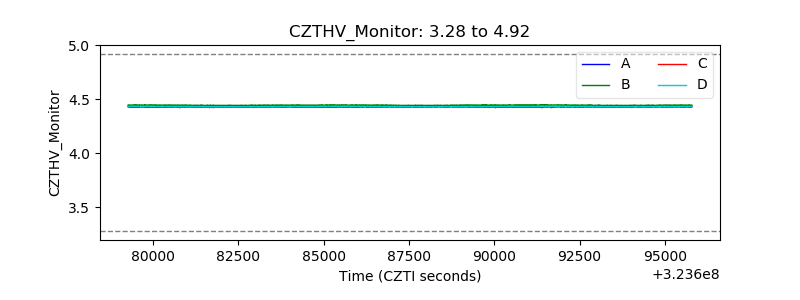 |
| D_VDD | 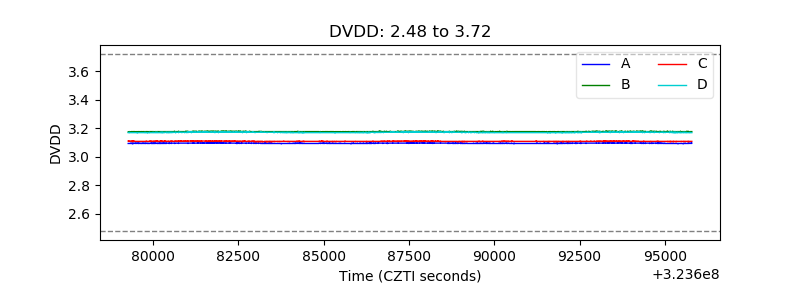 |
| Temperature 1 | 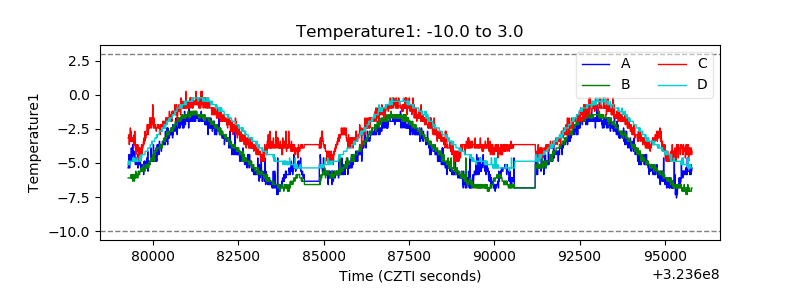 |
| Veto HV Monitor | 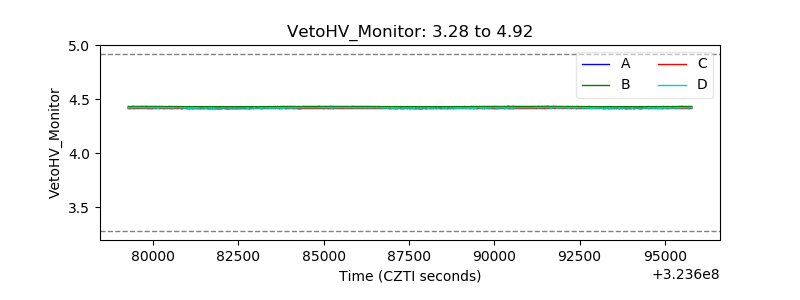 |
| Veto LLD | 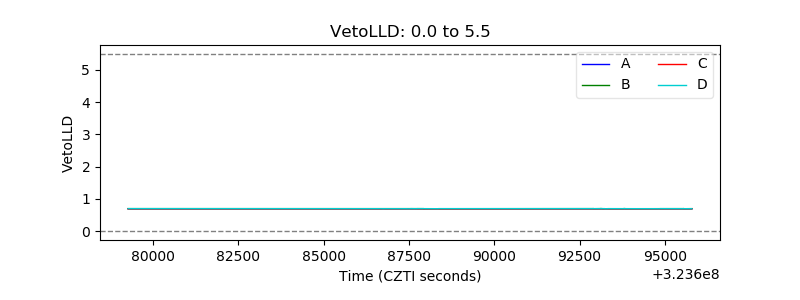 |
| Alpha Counter |  |
| _CPM_Rate |  |
| CZT Counter | 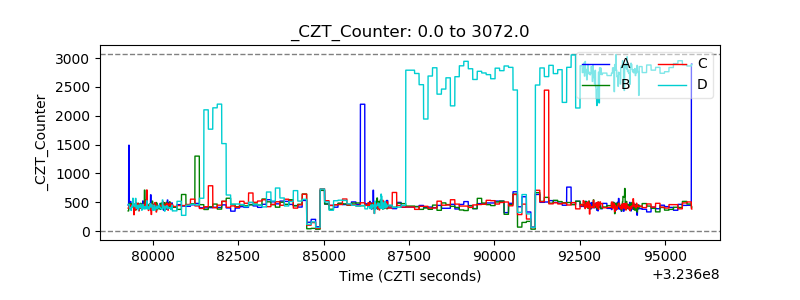 |
| +2.5 Volts monitor |  |
| +5 Volts monitor |  |
| _ROLL_ROT | 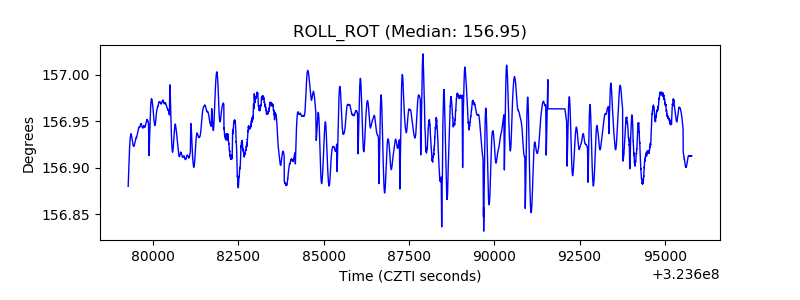 |
| _Roll_DEC | 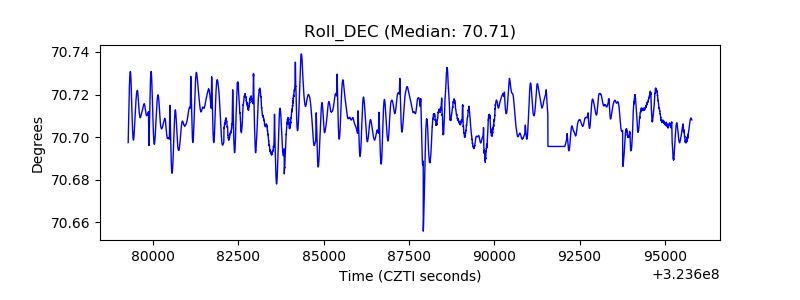 |
| _Roll_RA | 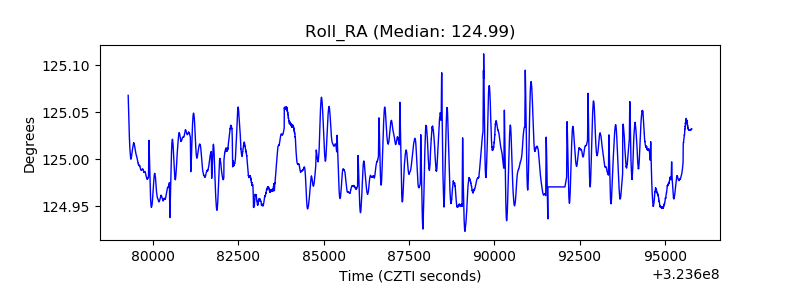 |
| Veto Counter | 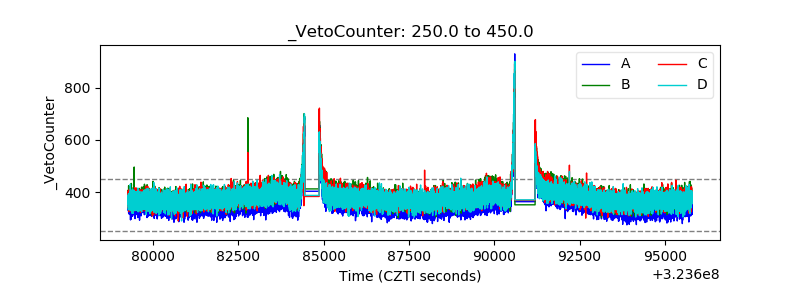 |