| Param | Original file | Final file |
|---|---|---|
| Filename | modeM0/AS1T03_183T01_9000003606cztM0_level2.fits | modeM0/AS1T03_183T01_9000003606cztM0_level2_quad_clean.evt |
| Size (bytes) | 5,723,035,200 | 6,919,519,680 |
| Size | 5.3 GB | 6.4 GB |
| Events in quadrant A | 35,598,922 | 44,980,851 |
| Events in quadrant B | 33,525,582 | 44,020,740 |
| Events in quadrant C | 34,302,730 | 42,224,671 |
| Events in quadrant D | 29,452,020 | 37,939,648 |
| Mode M0 | |||
|---|---|---|---|
| Quadrant | BADHDUFLAG | Total packets | Discarded packets |
| A | 0 | 1312994 | 0 |
| B | 0 | 1441051 | 0 |
| C | 0 | 1312083 | 0 |
| D | 0 | 1653227 | 0 |
| Mode SS | |||
|---|---|---|---|
| Quadrant | BADHDUFLAG | Total packets | Discarded packets |
| A | 0 | 12010 | 0 |
| B | 0 | 12010 | 0 |
| C | 0 | 12010 | 0 |
| D | 0 | 12010 | 0 |
| Mode M9 | |||
|---|---|---|---|
| Quadrant | BADHDUFLAG | Total packets | Discarded packets |
| A | 0 | 966 | 0 |
| B | 0 | 967 | 0 |
| C | 0 | 967 | 0 |
| D | 0 | 967 | 0 |
| Quadrant | Total seconds | Saturated seconds | Saturation percentage |
|---|---|---|---|
| A | 590338 | 11911 | 2.017658% |
| B | 590338 | 29931 | 5.070146% |
| C | 590338 | 16693 | 2.827702% |
| D | 590337 | 28315 | 4.796413% |
Noise dominated data is calculated using 1-second bins in cleaned event files. If a bin has >2000 counts, and if more than 50% of those come from <1% of pixels, then it is considered to be noise-dominated and hence unusable.
| Quadrant | # 1 sec bins | Bins with >0 counts | Bins with >2000 counts | High rate bins dominated by noise | Noise dominated (total time) | Noise dominated (detector-on time) | Marked lightcurve |
|---|---|---|---|---|---|---|---|
| A | 691051 | 590309 | 0 | 0 | 0.00% | 0.00% |  |
| B | 691049 | 589802 | 0 | 0 | 0.00% | 0.00% |  |
| C | 691049 | 590271 | 0 | 0 | 0.00% | 0.00% |  |
| D | 691049 | 589735 | 0 | 0 | 0.00% | 0.00% |  |
Top three noisy pixels from each quadrant. If the there are fewer than three noisy pixels in the level2.evt file, extra rows are filled as -1
| Pixel properties | Quadrant properties | ||||||
|---|---|---|---|---|---|---|---|
| Quadrant | DetID | PixID | Counts | Sigma | Mean | Median | Sigma |
| A | 0 | 29 | 34294 | 11.19 | 9281 | 8744 | 2282.7 |
| A | 7 | 110 | 28727 | 8.75 | 9281 | 8744 | 2282.7 |
| A | 9 | 19 | 26571 | 7.81 | 9281 | 8744 | 2282.7 |
| B | 2 | 9 | 26893 | 10.87 | 8888 | 8529 | 1689.5 |
| B | 2 | 8 | 22712 | 8.39 | 8888 | 8529 | 1689.5 |
| B | 14 | 254 | 21863 | 7.89 | 8888 | 8529 | 1689.5 |
| C | 12 | 241 | 24389 | 6.95 | 9062 | 8500 | 2285.4 |
| C | 3 | 126 | 22962 | 6.33 | 9062 | 8500 | 2285.4 |
| C | 9 | 209 | 22926 | 6.31 | 9062 | 8500 | 2285.4 |
| D | 3 | 14 | 21939 | 6.43 | 8404 | 7658 | 2221.3 |
| D | 15 | 46 | 21007 | 6.01 | 8404 | 7658 | 2221.3 |
| D | 6 | 231 | 20723 | 5.88 | 8404 | 7658 | 2221.3 |
Histogram calculated using DETX and DETY for each event in the final _common_clean file
| Quadrant A |  |
 |
Quadrant B |
|---|---|---|---|
| Quadrant D | 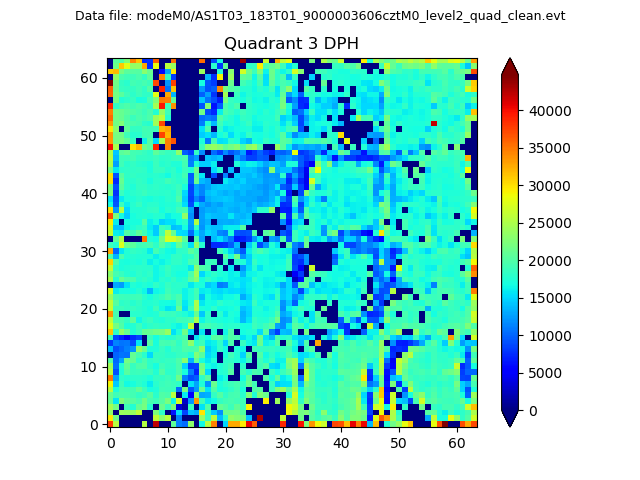 |
 |
Quadrant C |
| Plot type | Count rate plots | Images |
|---|---|---|
| Comparison with Poisson distribution Blue bars denote a histogram of data divided into 1 sec bins. Red curve is a Poisson curve with rate = median count rate of data. |
 |
 |
| Quadrant-wise count rates Data is divided into 100 sec bins |
 |
|
| Module-wise count rates for Quadrant A Data is divided into 100 sec bins |
 |
 |
| Module-wise count rates for Quadrant B Data is divided into 100 sec bins |
 |
 |
| Module-wise count rates for Quadrant C Data is divided into 100 sec bins |
 |
 |
| Module-wise count rates for Quadrant D Data is divided into 100 sec bins |
 |
 |
| Parameter | Plot |
|---|---|
| CZT HV Monitor |  |
| D_VDD |  |
| Temperature 1 |  |
| Veto HV Monitor |  |
| Veto LLD |  |
| Alpha Counter |  |
| _CPM_Rate |  |
| CZT Counter |  |
| +2.5 Volts monitor |  |
| +5 Volts monitor |  |
| _ROLL_ROT |  |
| _Roll_DEC |  |
| _Roll_RA |  |
| Veto Counter |  |