| Param | Original file | Final file |
|---|---|---|
| Filename | modeM0/AS1T03_183T01_9000003606_24430cztM0_level2.evt | modeM0/AS1T03_183T01_9000003606_24430cztM0_level2_quad_clean.evt |
| Size (bytes) | 946,609,920 | 215,951,040 |
| Size | 902.8 MB | 205.9 MB |
| Events in quadrant A | 5,920,455 | 1,465,807 |
| Events in quadrant B | 5,793,967 | 1,494,358 |
| Events in quadrant C | 5,857,620 | 1,419,830 |
| Events in quadrant D | 10,282,593 | 1,328,697 |
| Mode M0 | |||
|---|---|---|---|
| Quadrant | BADHDUFLAG | Total packets | Discarded packets |
| A | 0 | 25799 | 3 |
| B | 0 | 25194 | 3 |
| C | 0 | 25409 | 3 |
| D | 0 | 38920 | 3 |
| Mode SS | |||
|---|---|---|---|
| Quadrant | BADHDUFLAG | Total packets | Discarded packets |
| A | 0 | 242 | 0 |
| B | 0 | 242 | 0 |
| C | 0 | 242 | 0 |
| D | 0 | 242 | 0 |
| Mode M9 | |||
|---|---|---|---|
| Quadrant | BADHDUFLAG | Total packets | Discarded packets |
| A | 0 | 23 | 0 |
| B | 0 | 24 | 0 |
| C | 0 | 24 | 0 |
| D | 0 | 24 | 0 |
| Quadrant | Total seconds | Saturated seconds | Saturation percentage |
|---|---|---|---|
| A | 12044 | 195 | 1.619063% |
| B | 12044 | 134 | 1.112587% |
| C | 12044 | 209 | 1.735304% |
| D | 12044 | 895 | 7.431086% |
Noise dominated data is calculated using 1-second bins in cleaned event files. If a bin has >2000 counts, and if more than 50% of those come from <1% of pixels, then it is considered to be noise-dominated and hence unusable.
| Quadrant | # 1 sec bins | Bins with >0 counts | Bins with >2000 counts | High rate bins dominated by noise | Noise dominated (total time) | Noise dominated (detector-on time) | Marked lightcurve |
|---|---|---|---|---|---|---|---|
| A | 14054 | 12045 | 31 | 31 | 0.22% | 0.26% | 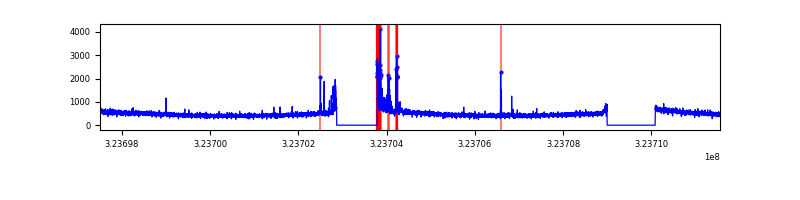 |
| B | 14054 | 12045 | 0 | 0 | 0.00% | 0.00% | 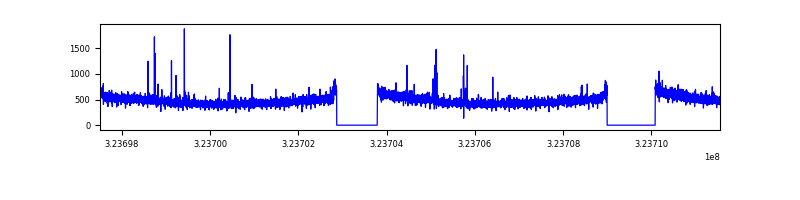 |
| C | 14054 | 12046 | 1 | 1 | 0.01% | 0.01% | 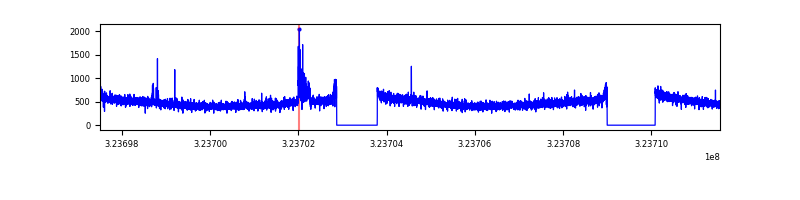 |
| D | 14054 | 12045 | 793 | 793 | 5.64% | 6.58% | 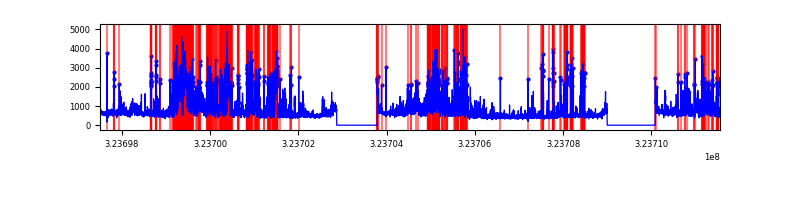 |
Top three noisy pixels from each quadrant. If the there are fewer than three noisy pixels in the level2.evt file, extra rows are filled as -1
| Pixel properties | Quadrant properties | ||||||
|---|---|---|---|---|---|---|---|
| Quadrant | DetID | PixID | Counts | Sigma | Mean | Median | Sigma |
| A | 4 | 2 | 243349 | 825.34 | 1473 | 1447 | 293.1 |
| A | 13 | 254 | 19119 | 60.29 | 1473 | 1447 | 293.1 |
| A | 3 | 137 | 13143 | 39.91 | 1473 | 1447 | 293.1 |
| B | 12 | 111 | 33714 | 115.82 | 1472 | 1436 | 278.7 |
| B | 11 | 111 | 29846 | 101.94 | 1472 | 1436 | 278.7 |
| B | 14 | 111 | 26371 | 89.47 | 1472 | 1436 | 278.7 |
| C | 14 | 238 | 225947 | 689.82 | 1406 | 1417 | 325.5 |
| C | 2 | 16 | 139050 | 422.85 | 1406 | 1417 | 325.5 |
| C | 3 | 233 | 18399 | 52.17 | 1406 | 1417 | 325.5 |
| D | 1 | 52 | 1697827 | 5143.14 | 1387 | 1346 | 329.9 |
| D | 8 | 195 | 1530972 | 4637.29 | 1387 | 1346 | 329.9 |
| D | 12 | 218 | 1274284 | 3859.1 | 1387 | 1346 | 329.9 |
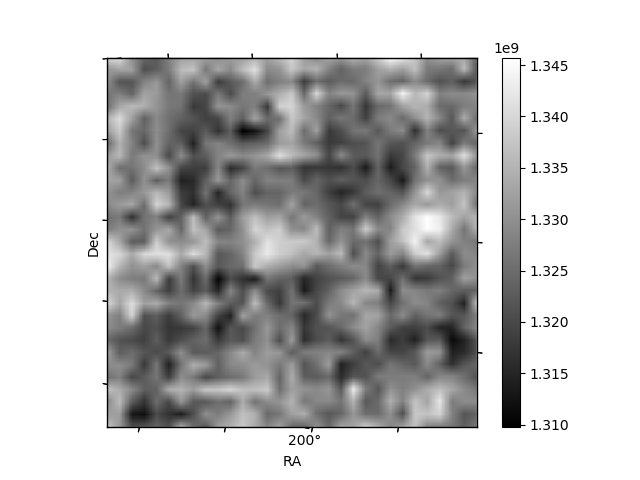
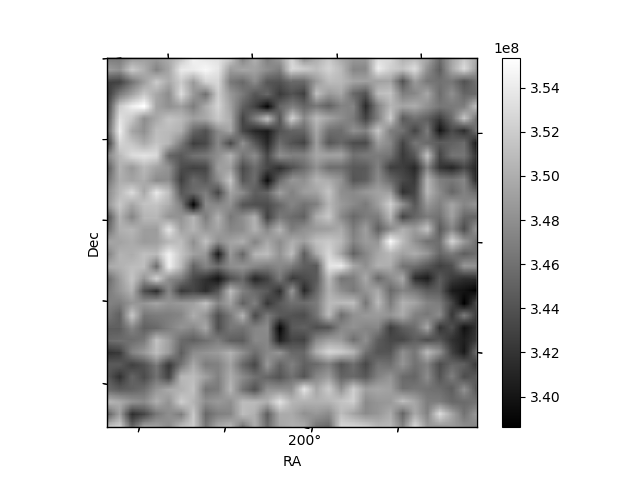
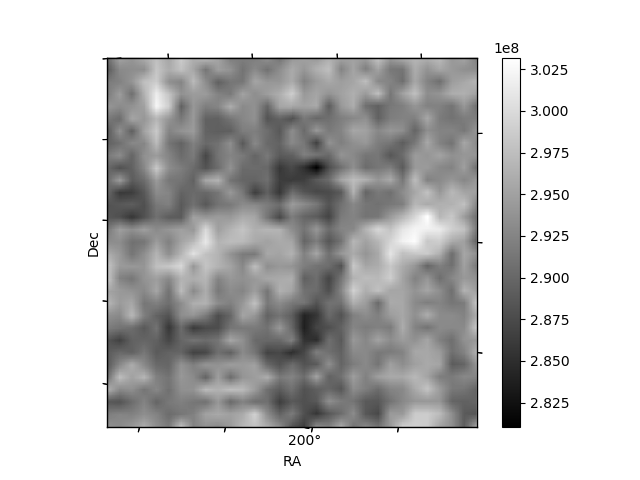
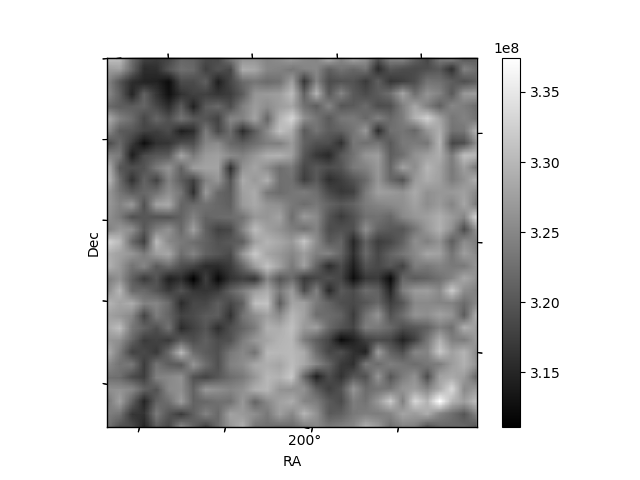
Histogram calculated using DETX and DETY for each event in the final _common_clean file
| Quadrant A | 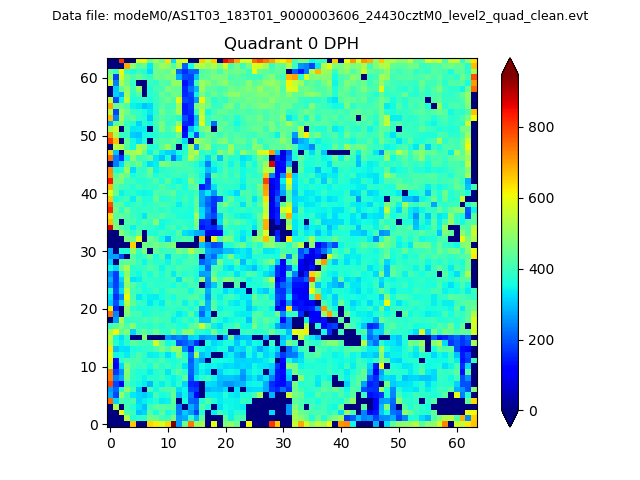 |
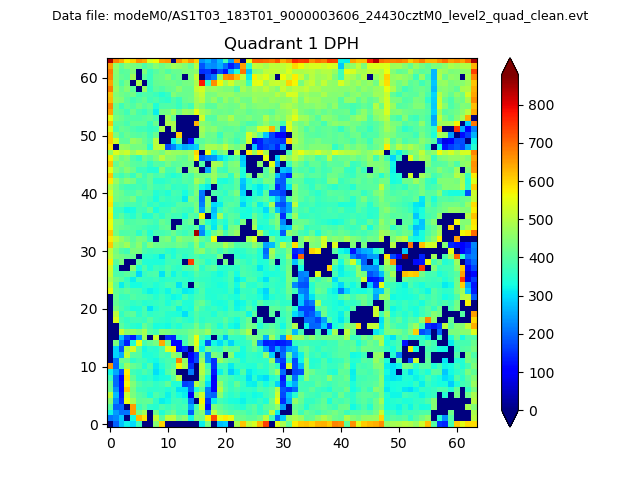 |
Quadrant B |
|---|---|---|---|
| Quadrant D |  |
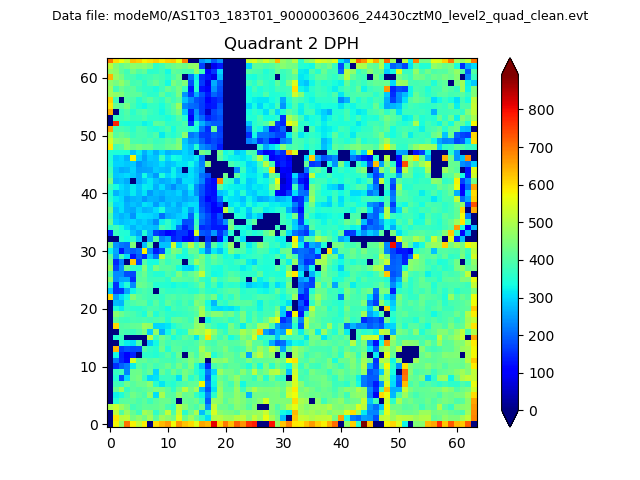 |
Quadrant C |
| Plot type | Count rate plots | Images |
|---|---|---|
| Comparison with Poisson distribution Blue bars denote a histogram of data divided into 1 sec bins. Red curve is a Poisson curve with rate = median count rate of data. |
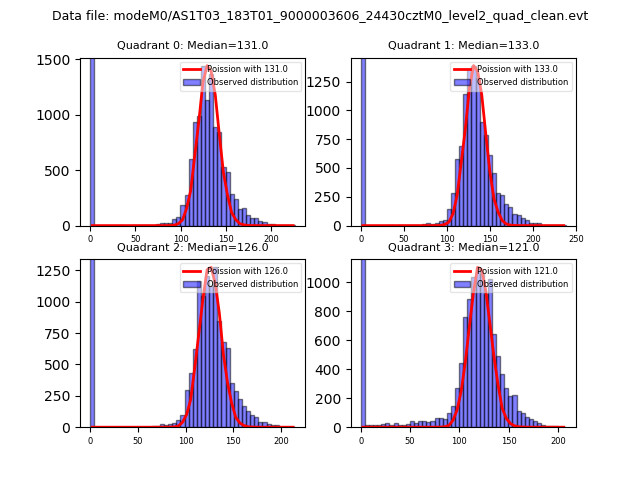 |
 |
| Quadrant-wise count rates Data is divided into 100 sec bins |
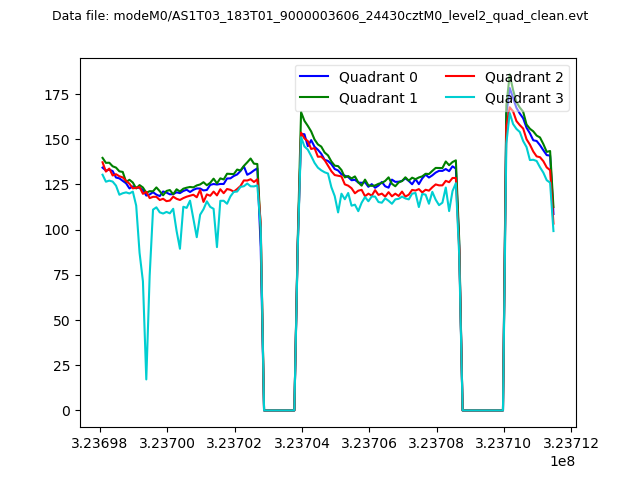 |
|
| Module-wise count rates for Quadrant A Data is divided into 100 sec bins |
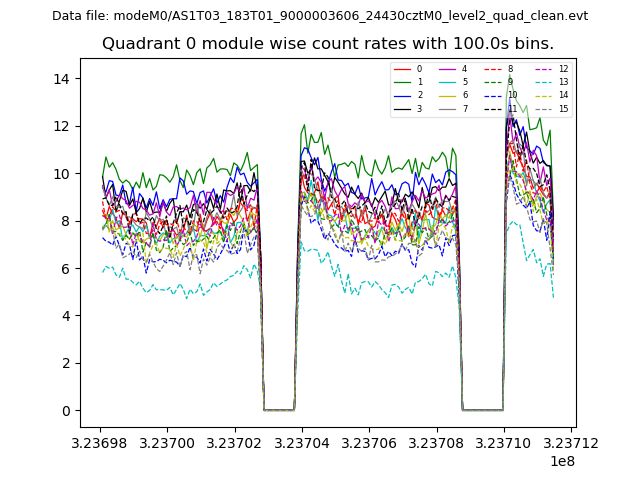 |
 |
| Module-wise count rates for Quadrant B Data is divided into 100 sec bins |
 |
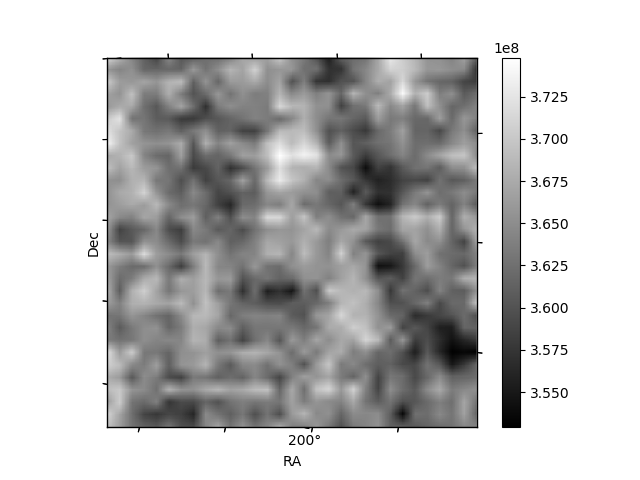 |
| Module-wise count rates for Quadrant C Data is divided into 100 sec bins |
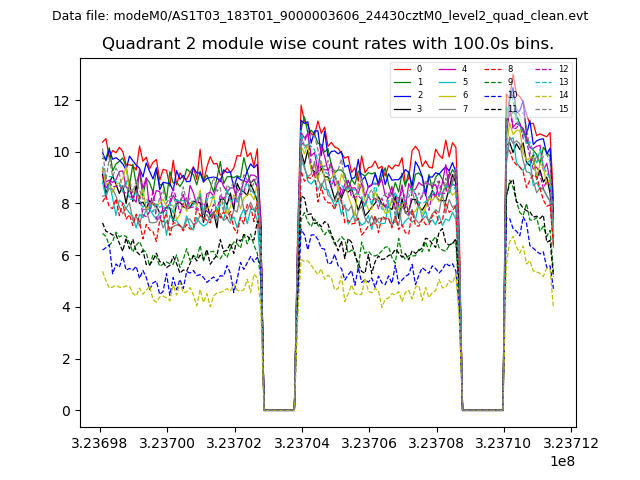 |
 |
| Module-wise count rates for Quadrant D Data is divided into 100 sec bins |
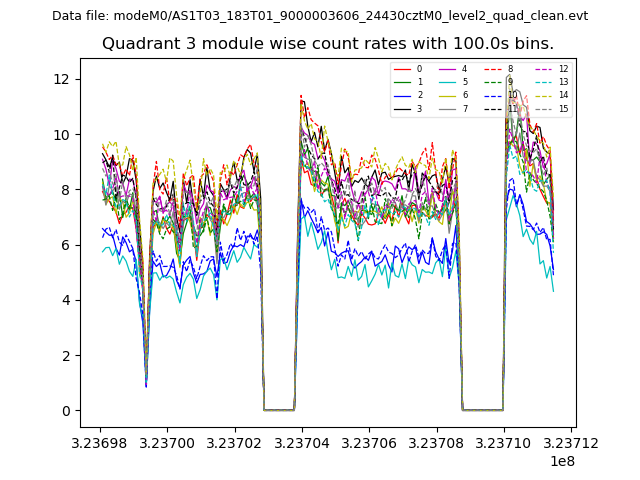 |
 |
| Parameter | Plot |
|---|---|
| CZT HV Monitor |  |
| D_VDD | 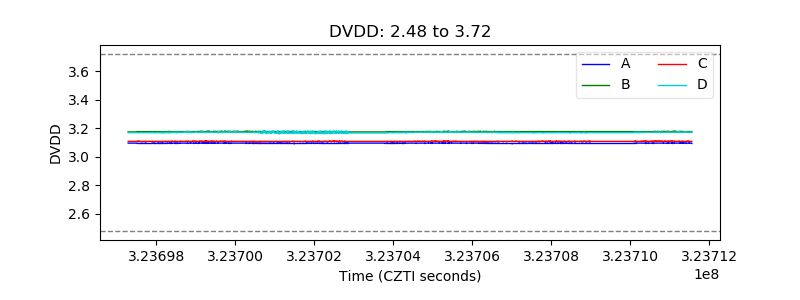 |
| Temperature 1 | 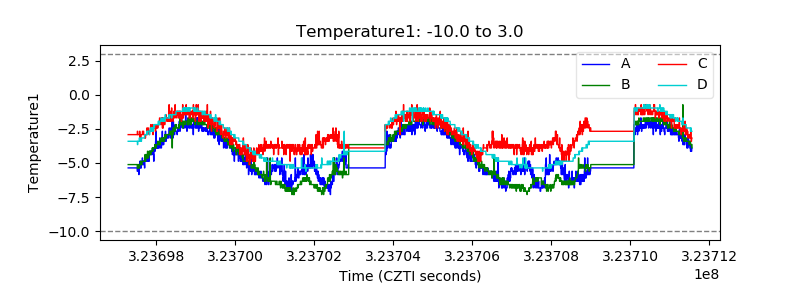 |
| Veto HV Monitor | 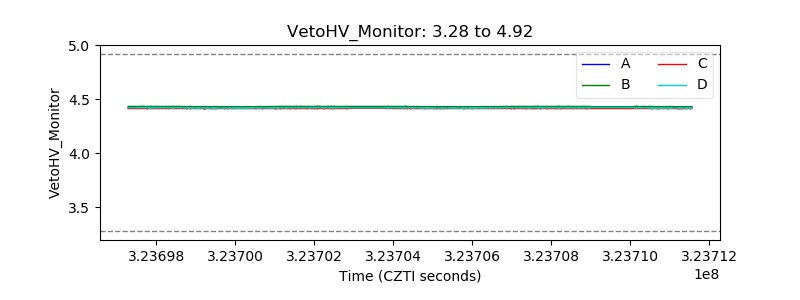 |
| Veto LLD | 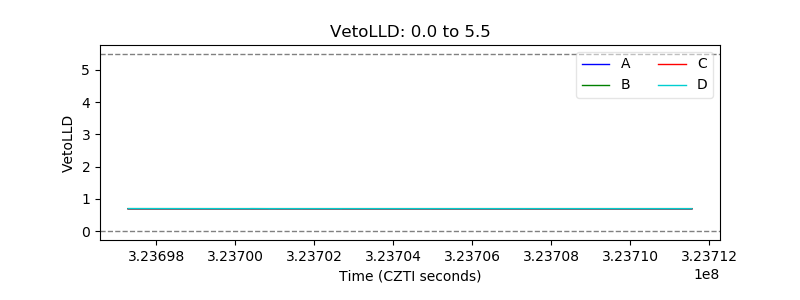 |
| Alpha Counter | 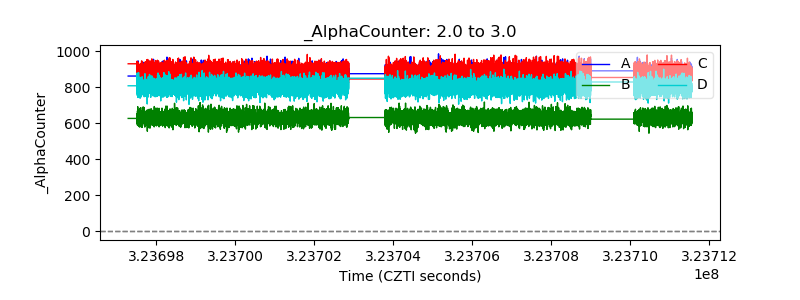 |
| _CPM_Rate | 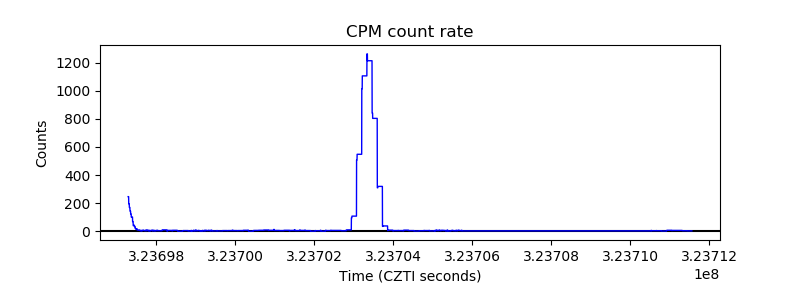 |
| CZT Counter | 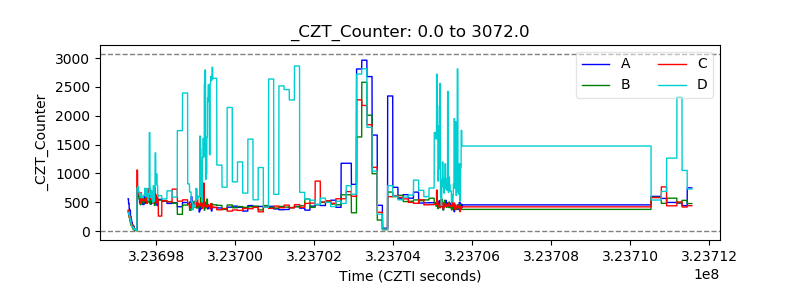 |
| +2.5 Volts monitor |  |
| +5 Volts monitor |  |
| _ROLL_ROT | 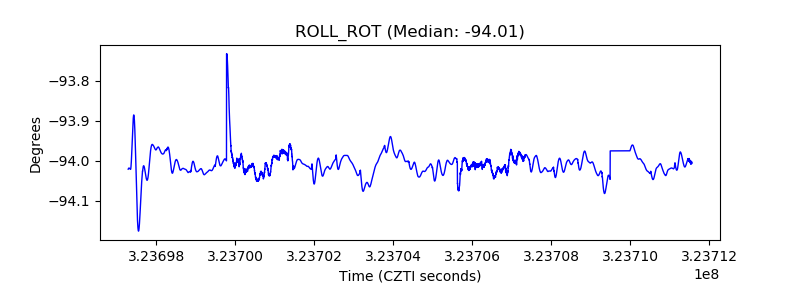 |
| _Roll_DEC | 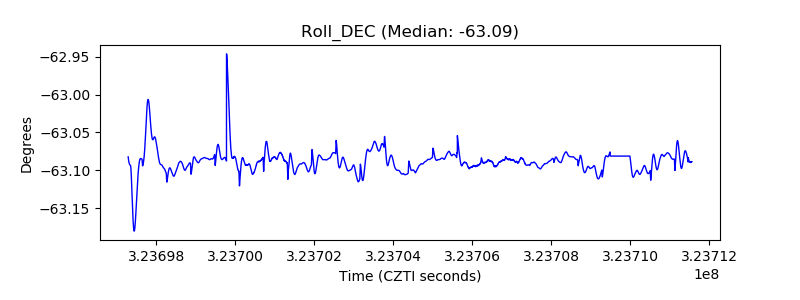 |
| _Roll_RA | 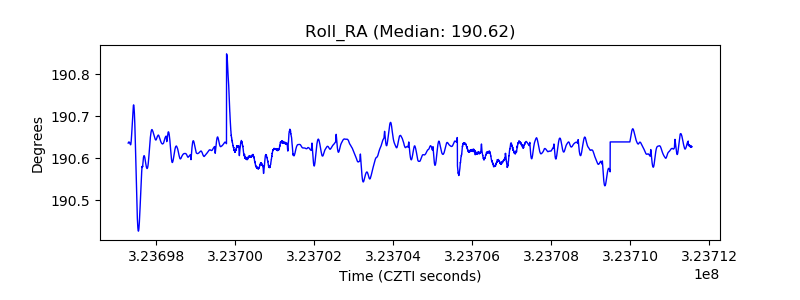 |
| Veto Counter | 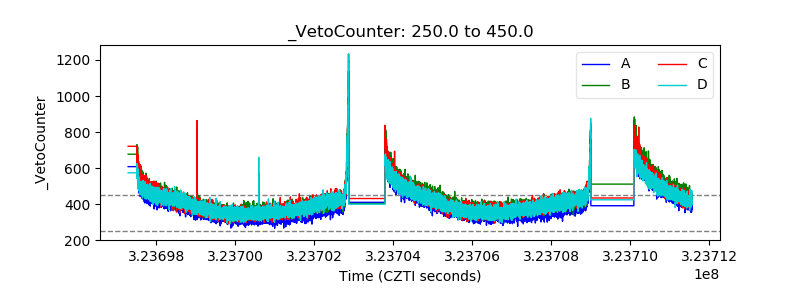 |