| Param | Original file | Final file |
|---|---|---|
| Filename | modeM0/AS1T03_183T01_9000003606_24432cztM0_level2.evt | modeM0/AS1T03_183T01_9000003606_24432cztM0_level2_quad_clean.evt |
| Size (bytes) | 498,919,680 | 113,748,480 |
| Size | 475.8 MB | 108.5 MB |
| Events in quadrant A | 3,102,580 | 777,005 |
| Events in quadrant B | 3,093,834 | 806,386 |
| Events in quadrant C | 3,051,330 | 740,203 |
| Events in quadrant D | 5,447,895 | 695,016 |
| Mode M0 | |||
|---|---|---|---|
| Quadrant | BADHDUFLAG | Total packets | Discarded packets |
| A | 0 | 13261 | 1 |
| B | 0 | 13058 | 1 |
| C | 0 | 12904 | 1 |
| D | 0 | 20441 | 1 |
| Mode SS | |||
|---|---|---|---|
| Quadrant | BADHDUFLAG | Total packets | Discarded packets |
| A | 0 | 124 | 0 |
| B | 0 | 124 | 0 |
| C | 0 | 124 | 0 |
| D | 0 | 124 | 0 |
| Mode M9 | |||
|---|---|---|---|
| Quadrant | BADHDUFLAG | Total packets | Discarded packets |
| A | 0 | 13 | 0 |
| B | 0 | 13 | 0 |
| C | 0 | 13 | 0 |
| D | 0 | 13 | 0 |
| Quadrant | Total seconds | Saturated seconds | Saturation percentage |
|---|---|---|---|
| A | 6109 | 50 | 0.818465% |
| B | 6110 | 52 | 0.851064% |
| C | 6110 | 79 | 1.292962% |
| D | 6110 | 262 | 4.288052% |
Noise dominated data is calculated using 1-second bins in cleaned event files. If a bin has >2000 counts, and if more than 50% of those come from <1% of pixels, then it is considered to be noise-dominated and hence unusable.
| Quadrant | # 1 sec bins | Bins with >0 counts | Bins with >2000 counts | High rate bins dominated by noise | Noise dominated (total time) | Noise dominated (detector-on time) | Marked lightcurve |
|---|---|---|---|---|---|---|---|
| A | 7384 | 6110 | 5 | 5 | 0.07% | 0.08% | 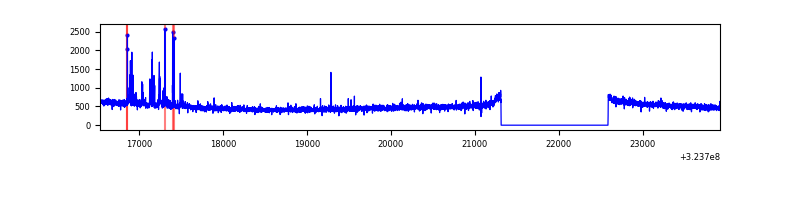 |
| B | 7385 | 6111 | 1 | 1 | 0.01% | 0.02% | 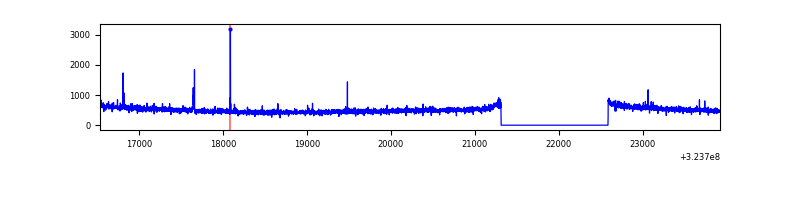 |
| C | 7385 | 6111 | 2 | 2 | 0.03% | 0.03% | 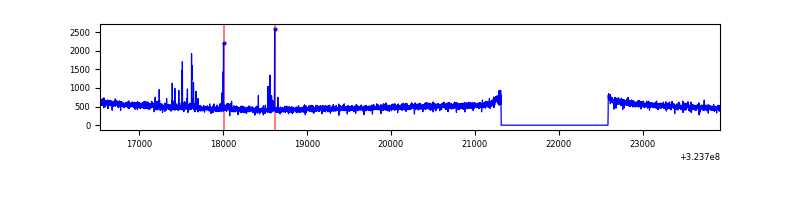 |
| D | 7385 | 6111 | 264 | 264 | 3.57% | 4.32% | 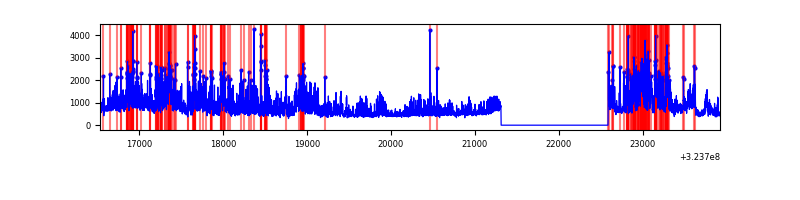 |
Top three noisy pixels from each quadrant. If the there are fewer than three noisy pixels in the level2.evt file, extra rows are filled as -1
| Pixel properties | Quadrant properties | ||||||
|---|---|---|---|---|---|---|---|
| Quadrant | DetID | PixID | Counts | Sigma | Mean | Median | Sigma |
| A | 4 | 2 | 98557 | 630.38 | 779 | 766 | 155.1 |
| A | 13 | 254 | 9491 | 56.24 | 779 | 766 | 155.1 |
| A | 0 | 226 | 6768 | 38.69 | 779 | 766 | 155.1 |
| B | 3 | 64 | 20784 | 137.0 | 784 | 767 | 146.1 |
| B | 12 | 111 | 17154 | 112.15 | 784 | 767 | 146.1 |
| B | 11 | 111 | 14651 | 95.02 | 784 | 767 | 146.1 |
| C | 14 | 238 | 121114 | 705.3 | 738 | 746 | 170.7 |
| C | 2 | 16 | 47623 | 274.68 | 738 | 746 | 170.7 |
| C | 13 | 61 | 5065 | 25.31 | 738 | 746 | 170.7 |
| D | 8 | 195 | 1744597 | 9857.89 | 732 | 710 | 176.9 |
| D | 12 | 218 | 758532 | 4283.84 | 732 | 710 | 176.9 |
| D | 1 | 52 | 76167 | 426.55 | 732 | 710 | 176.9 |
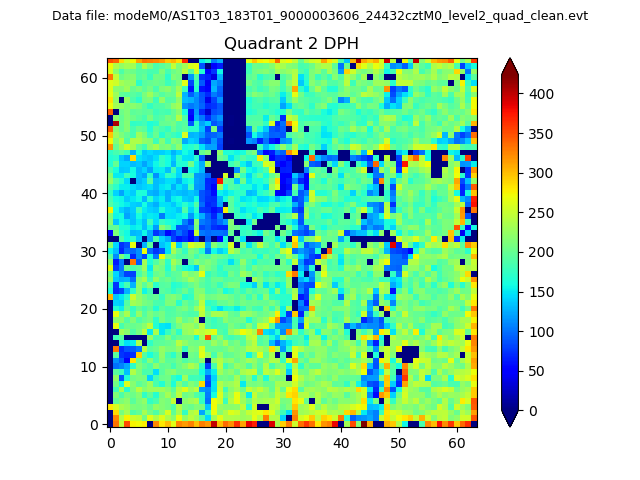
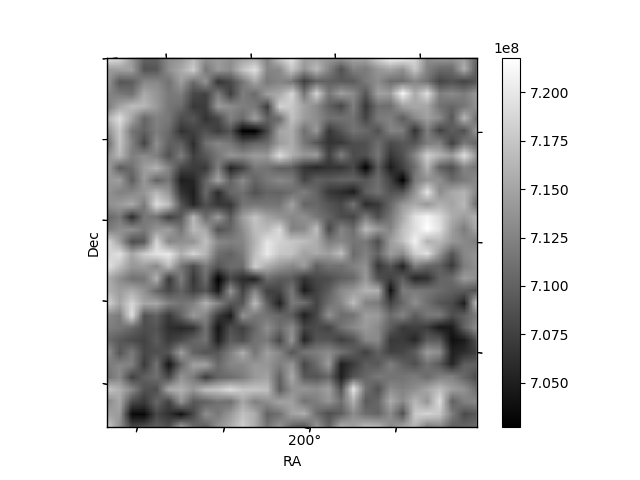
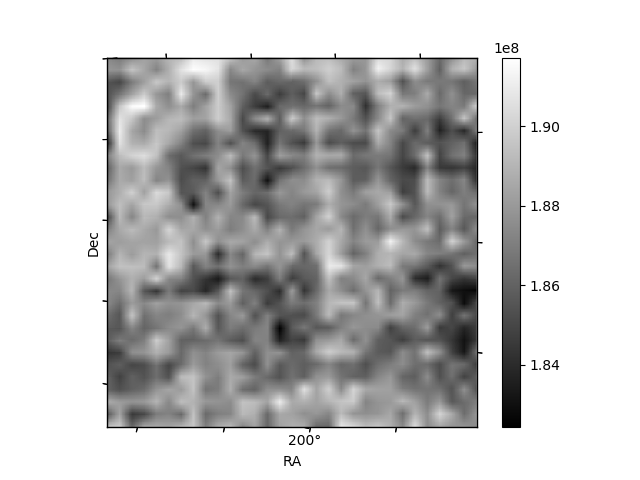
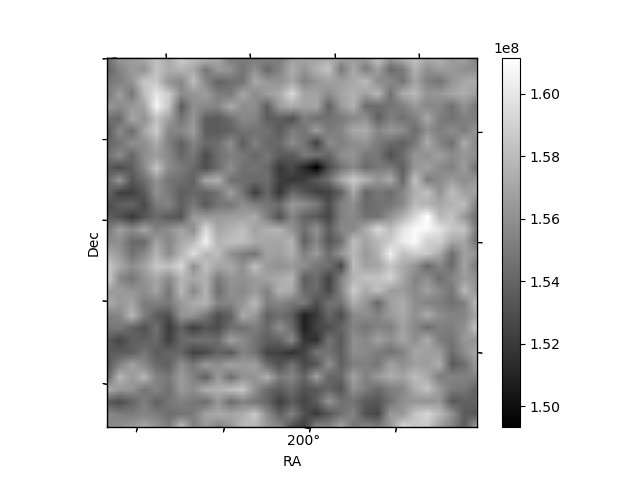
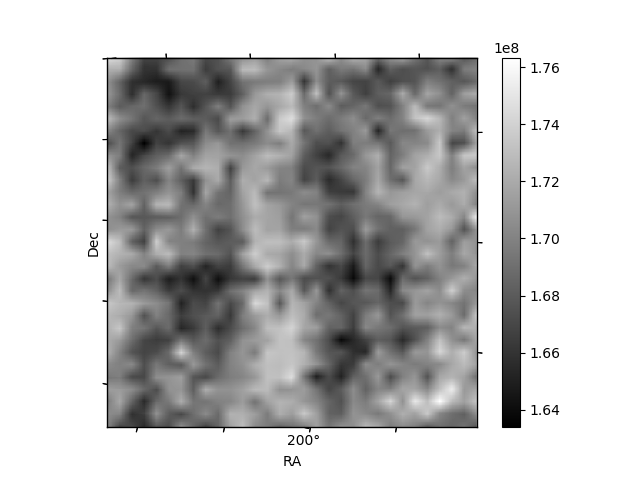
Histogram calculated using DETX and DETY for each event in the final _common_clean file
| Quadrant A | 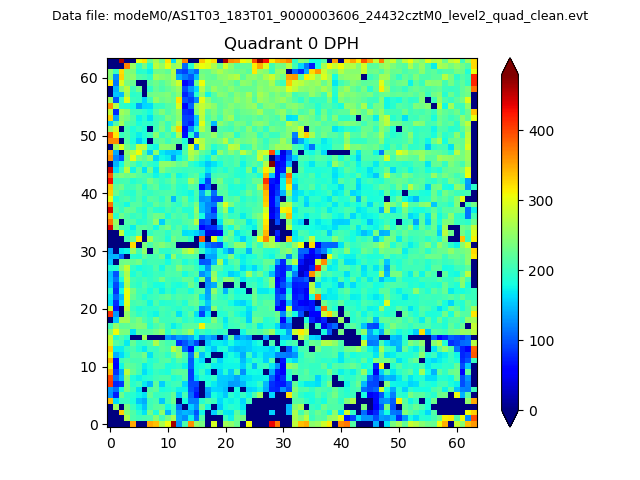 |
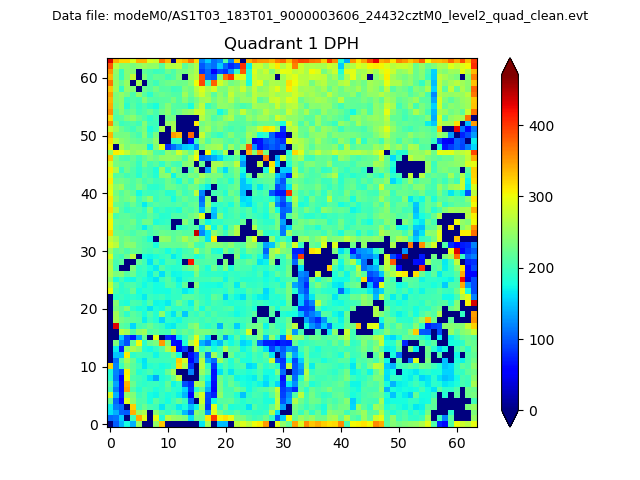 |
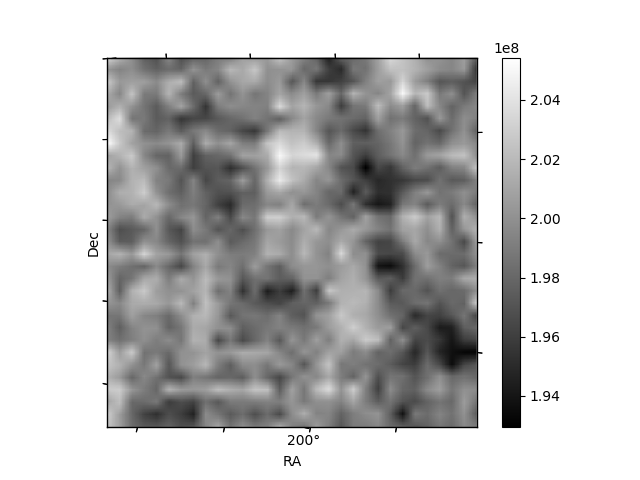
Quadrant B |
|---|---|---|---|
| Quadrant D | 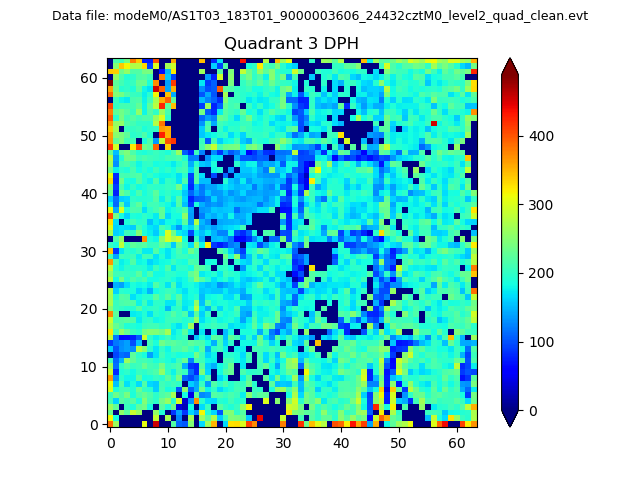 |
 |
Quadrant C |
| Plot type | Count rate plots | Images |
|---|---|---|
| Comparison with Poisson distribution Blue bars denote a histogram of data divided into 1 sec bins. Red curve is a Poisson curve with rate = median count rate of data. |
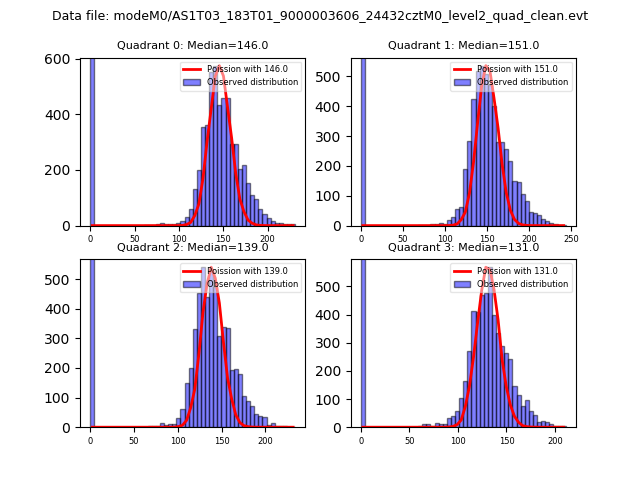 |
 |
| Quadrant-wise count rates Data is divided into 100 sec bins |
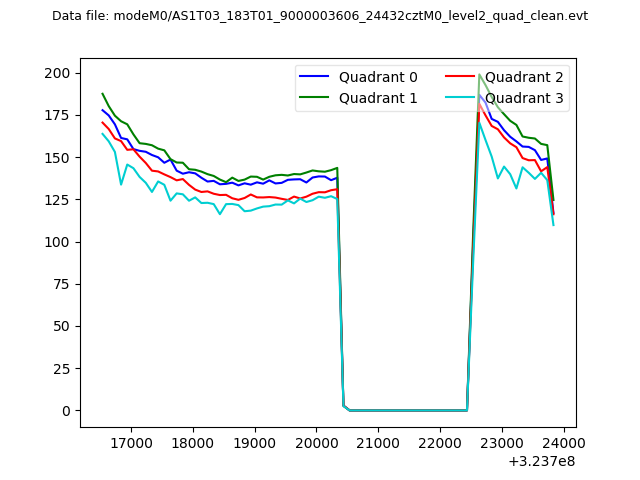 |
|
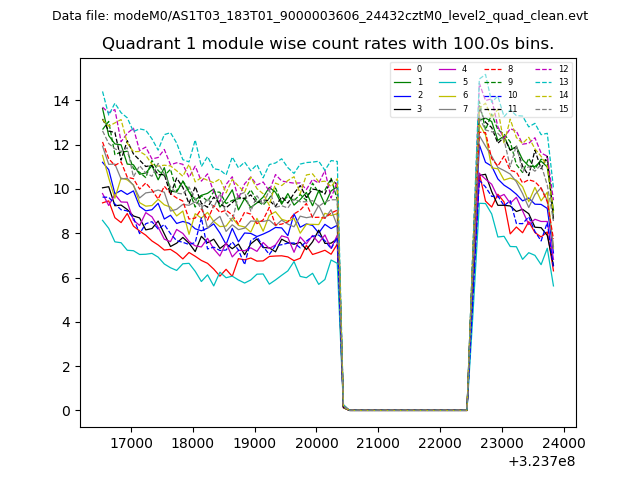
| Module-wise count rates for Quadrant A Data is divided into 100 sec bins |
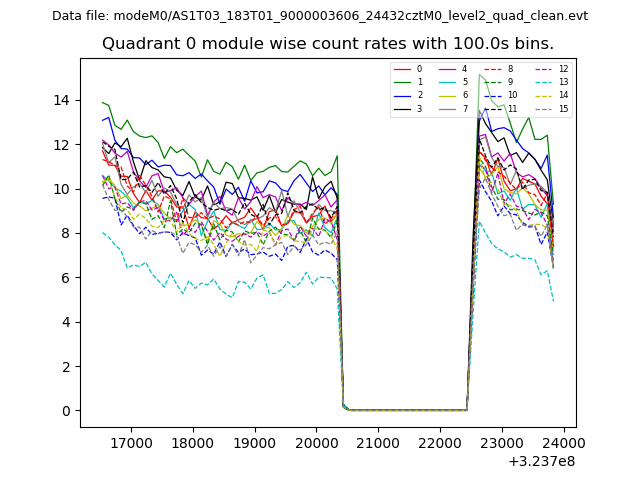 |
 |
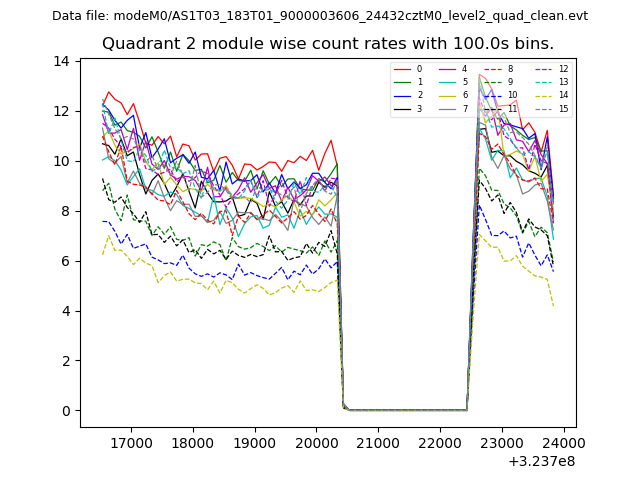
| Module-wise count rates for Quadrant B Data is divided into 100 sec bins |
 |
 |
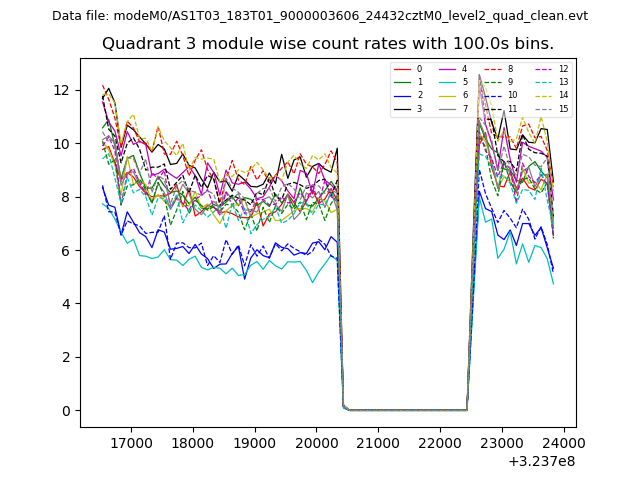
| Module-wise count rates for Quadrant C Data is divided into 100 sec bins |
 |
 |
| Module-wise count rates for Quadrant D Data is divided into 100 sec bins |
 |
 |
| Parameter | Plot |
|---|---|
| CZT HV Monitor | 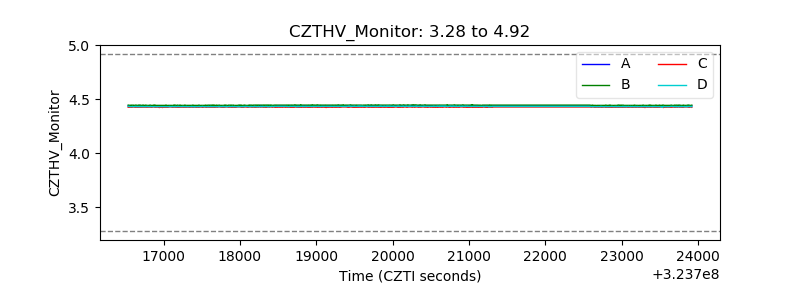 |
| D_VDD | 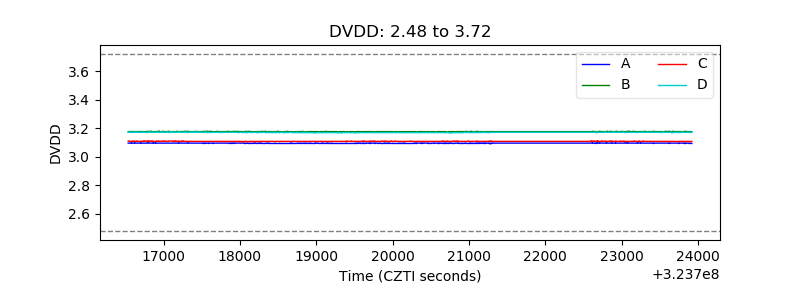 |
| Temperature 1 | 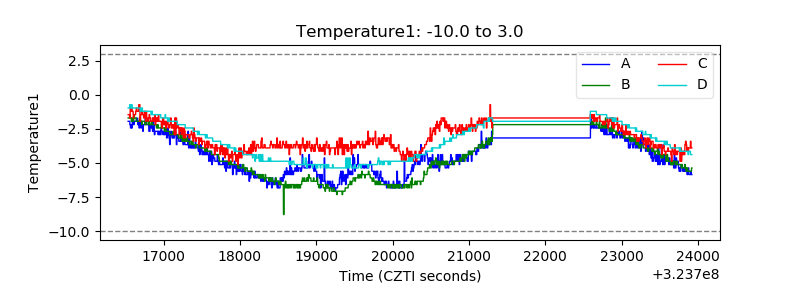 |
| Veto HV Monitor | 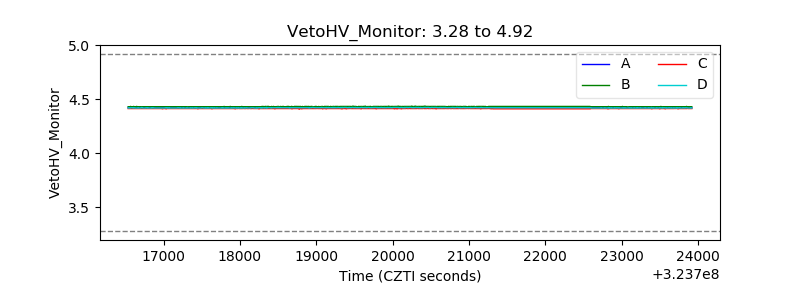 |
| Veto LLD | 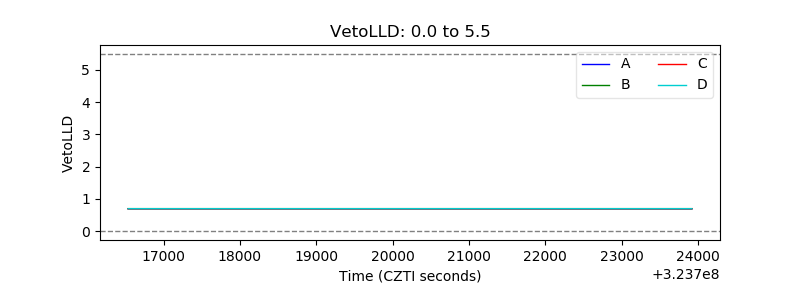 |
| Alpha Counter | 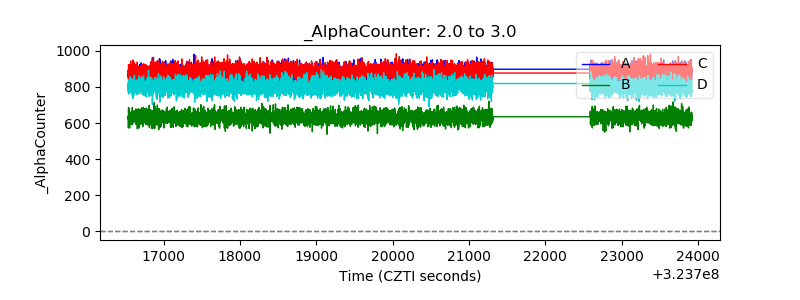 |
| _CPM_Rate | 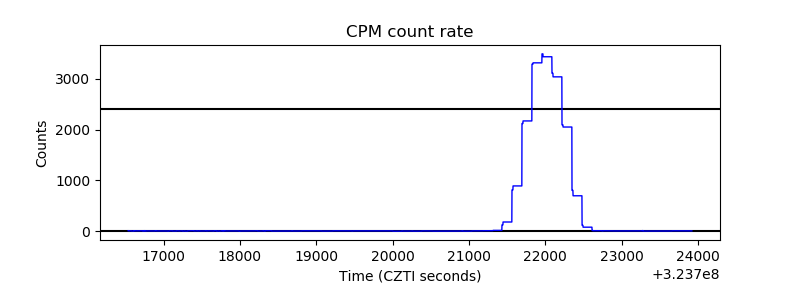 |
| CZT Counter | 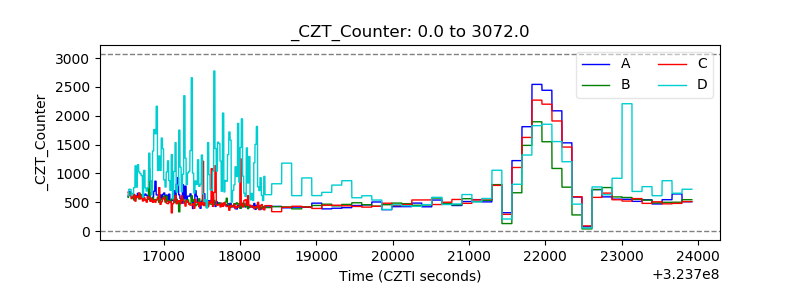 |
| +2.5 Volts monitor | 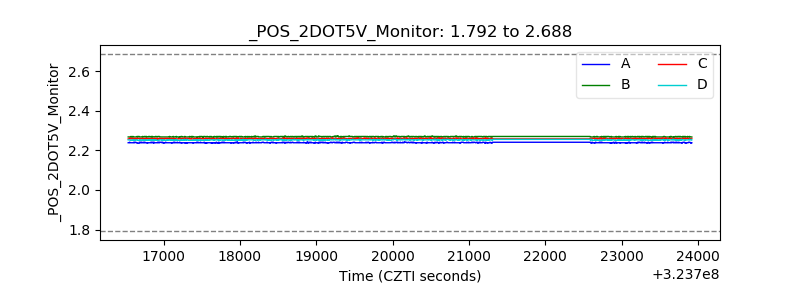 |
| +5 Volts monitor | 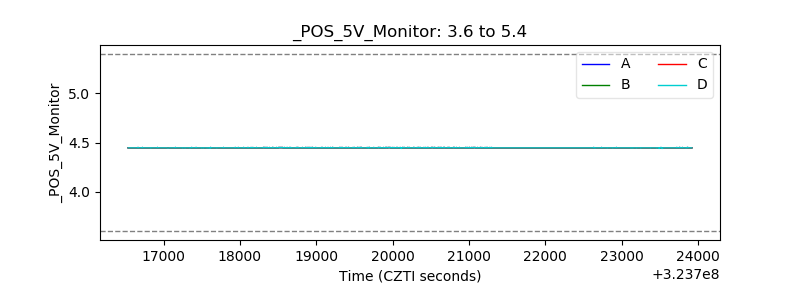 |
| _ROLL_ROT | 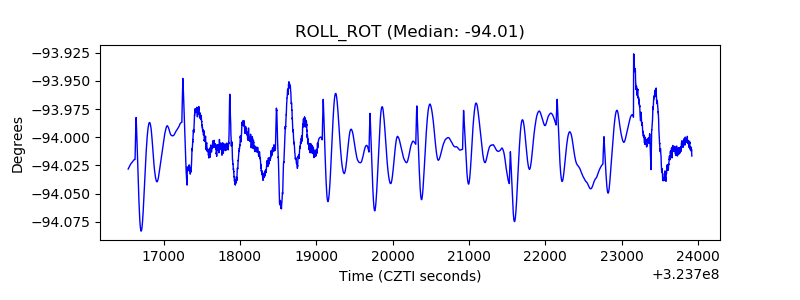 |
| _Roll_DEC | 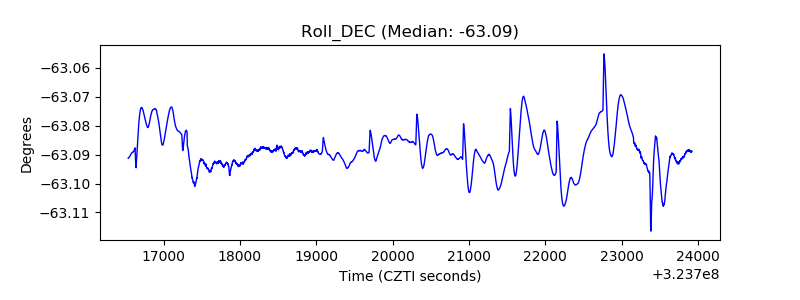 |
| _Roll_RA | 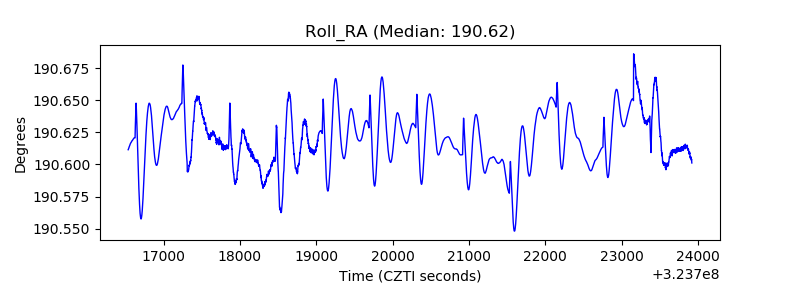 |
| Veto Counter | 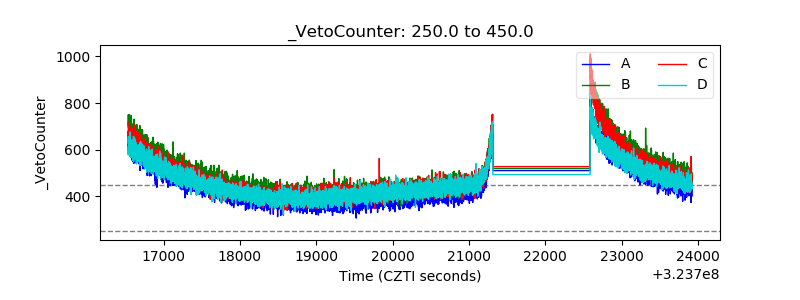 |