| Param | Original file | Final file |
|---|---|---|
| Filename | modeM0/AS1T03_183T01_9000003606_24434cztM0_level2.evt | modeM0/AS1T03_183T01_9000003606_24434cztM0_level2_quad_clean.evt |
| Size (bytes) | 1,130,388,480 | 254,995,200 |
| Size | 1.1 GB | 243.2 MB |
| Events in quadrant A | 7,069,593 | 1,720,809 |
| Events in quadrant B | 7,372,958 | 1,774,119 |
| Events in quadrant C | 7,197,785 | 1,649,095 |
| Events in quadrant D | 11,594,576 | 1,558,882 |
| Mode M0 | |||
|---|---|---|---|
| Quadrant | BADHDUFLAG | Total packets | Discarded packets |
| A | 0 | 30681 | 3 |
| B | 0 | 31283 | 3 |
| C | 0 | 30680 | 3 |
| D | 0 | 44747 | 3 |
| Mode SS | |||
|---|---|---|---|
| Quadrant | BADHDUFLAG | Total packets | Discarded packets |
| A | 0 | 300 | 0 |
| B | 0 | 300 | 0 |
| C | 0 | 302 | 0 |
| D | 0 | 302 | 0 |
| Mode M9 | |||
|---|---|---|---|
| Quadrant | BADHDUFLAG | Total packets | Discarded packets |
| A | 0 | 39 | 0 |
| B | 0 | 39 | 0 |
| C | 0 | 39 | 0 |
| D | 0 | 39 | 0 |
| Quadrant | Total seconds | Saturated seconds | Saturation percentage |
|---|---|---|---|
| A | 14790 | 70 | 0.473293% |
| B | 14790 | 112 | 0.757268% |
| C | 14790 | 151 | 1.020960% |
| D | 14791 | 452 | 3.055912% |
Noise dominated data is calculated using 1-second bins in cleaned event files. If a bin has >2000 counts, and if more than 50% of those come from <1% of pixels, then it is considered to be noise-dominated and hence unusable.
| Quadrant | # 1 sec bins | Bins with >0 counts | Bins with >2000 counts | High rate bins dominated by noise | Noise dominated (total time) | Noise dominated (detector-on time) | Marked lightcurve |
|---|---|---|---|---|---|---|---|
| A | 18760 | 14793 | 1 | 1 | 0.01% | 0.01% | 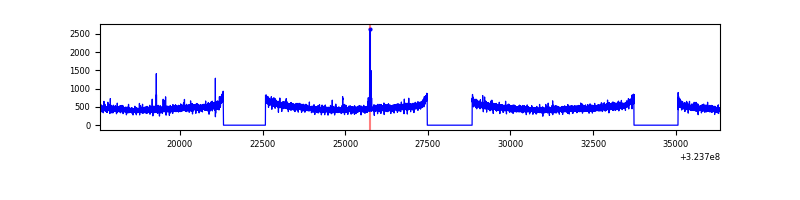 |
| B | 18760 | 14793 | 6 | 6 | 0.03% | 0.04% | 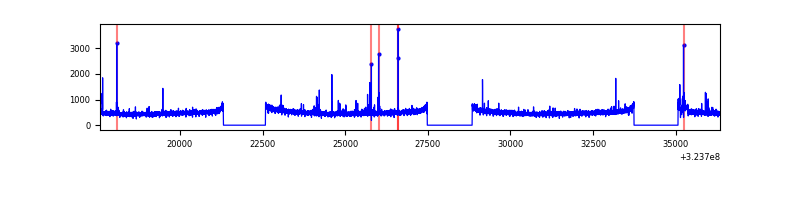 |
| C | 18760 | 14793 | 2 | 2 | 0.01% | 0.01% | 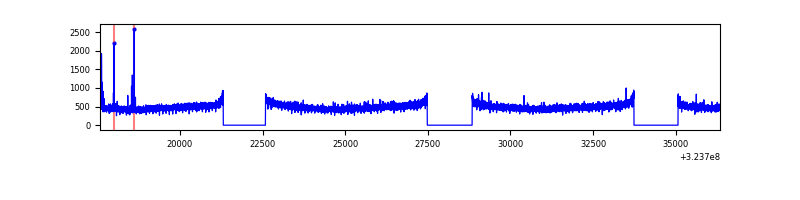 |
| D | 18761 | 14794 | 373 | 373 | 1.99% | 2.52% | 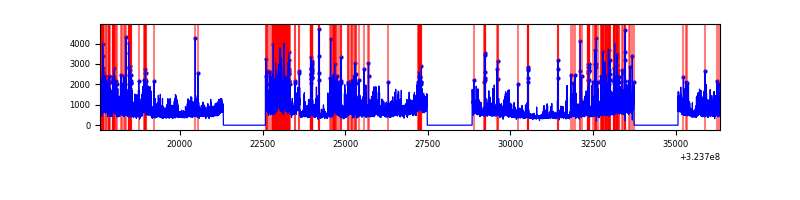 |
Top three noisy pixels from each quadrant. If the there are fewer than three noisy pixels in the level2.evt file, extra rows are filled as -1
| Pixel properties | Quadrant properties | ||||||
|---|---|---|---|---|---|---|---|
| Quadrant | DetID | PixID | Counts | Sigma | Mean | Median | Sigma |
| A | 4 | 2 | 35001 | 91.94 | 1825 | 1788 | 361.2 |
| A | 13 | 254 | 23623 | 60.44 | 1825 | 1788 | 361.2 |
| A | 3 | 137 | 15731 | 38.6 | 1825 | 1788 | 361.2 |
| B | 3 | 64 | 96108 | 275.37 | 1848 | 1804 | 342.5 |
| B | 12 | 111 | 40383 | 112.65 | 1848 | 1804 | 342.5 |
| B | 4 | 200 | 39621 | 110.43 | 1848 | 1804 | 342.5 |
| C | 14 | 238 | 288549 | 709.23 | 1763 | 1777 | 404.3 |
| C | 2 | 16 | 33564 | 78.61 | 1763 | 1777 | 404.3 |
| C | 13 | 61 | 12120 | 25.58 | 1763 | 1777 | 404.3 |
| D | 8 | 195 | 3461495 | 8330.26 | 1738 | 1691 | 415.3 |
| D | 1 | 52 | 722078 | 1734.49 | 1738 | 1691 | 415.3 |
| D | 12 | 218 | 650661 | 1562.54 | 1738 | 1691 | 415.3 |
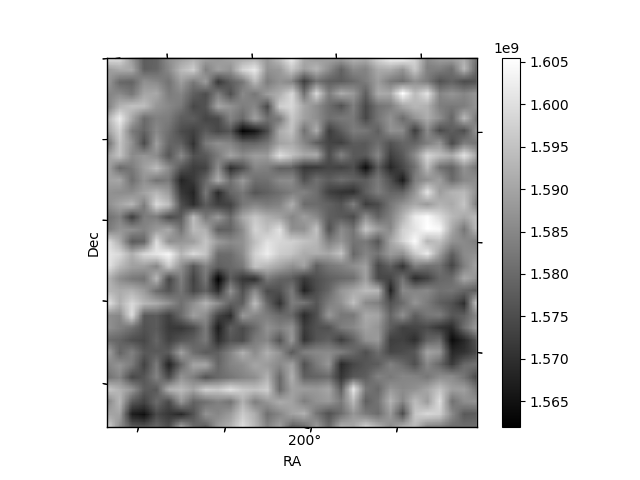
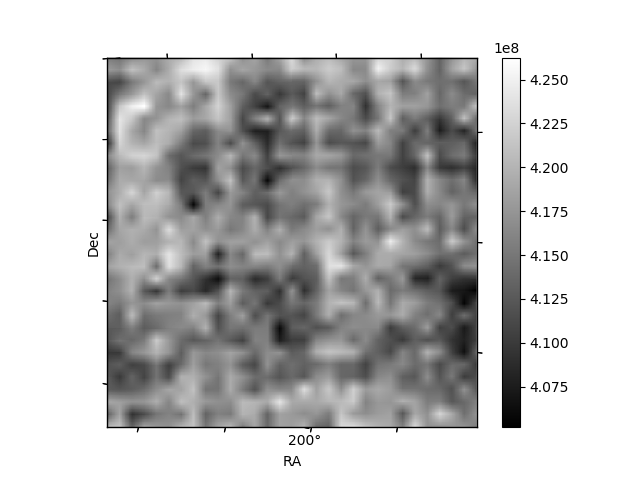
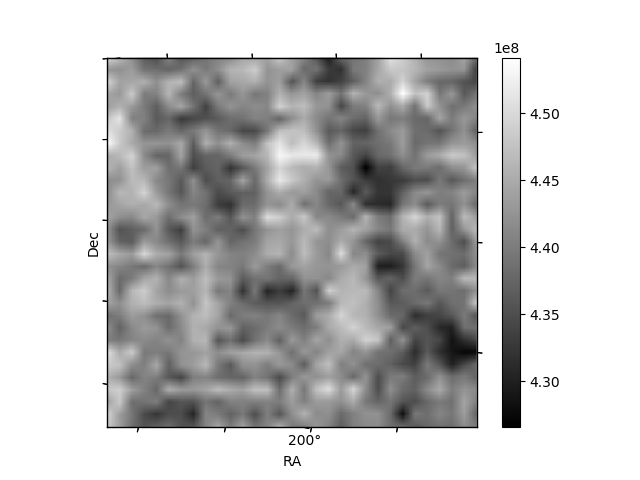
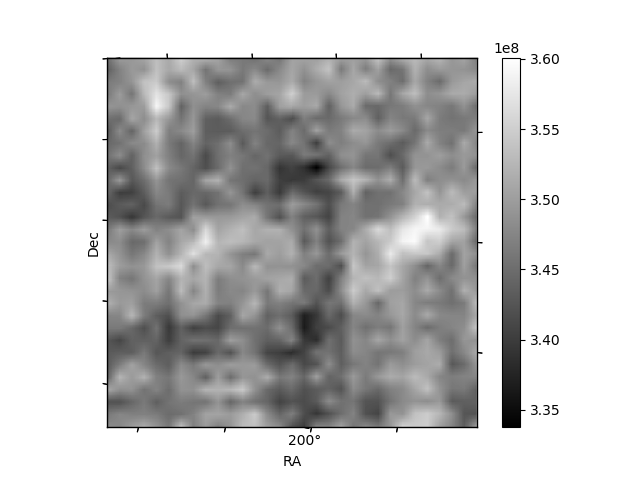
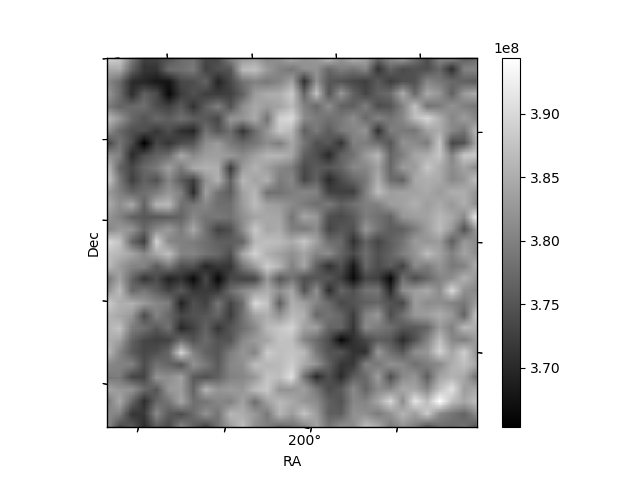
Histogram calculated using DETX and DETY for each event in the final _common_clean file
| Quadrant A | 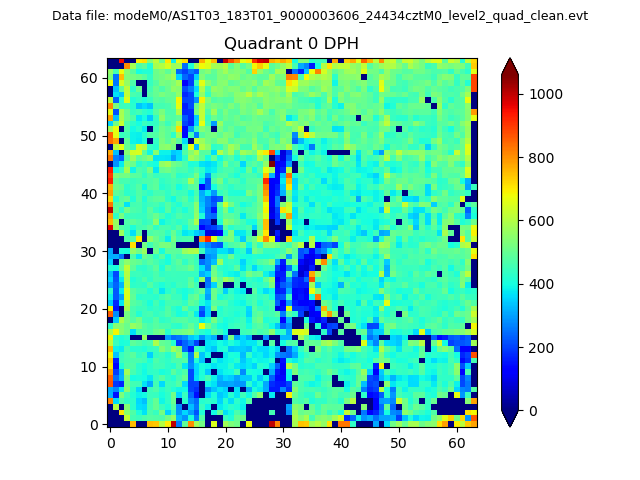 |
 |
Quadrant B |
|---|---|---|---|
| Quadrant D | 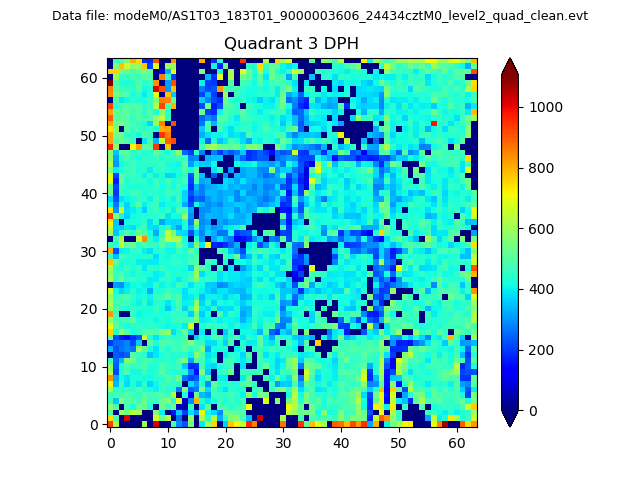 |
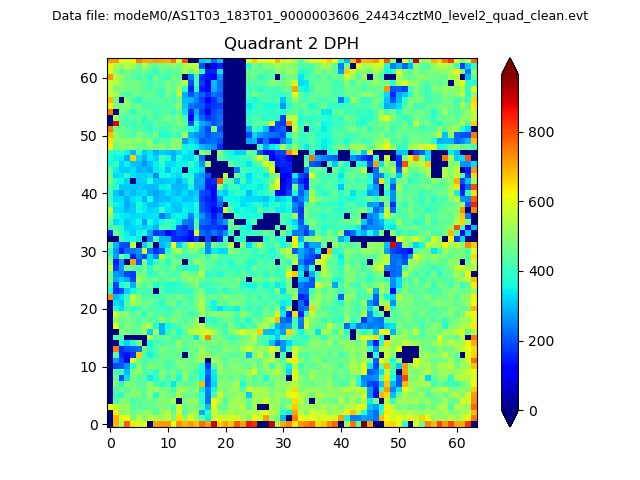 |
Quadrant C |
| Plot type | Count rate plots | Images |
|---|---|---|
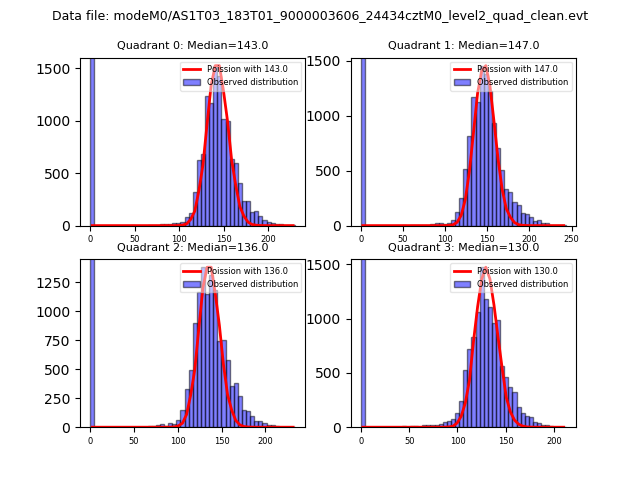
| Comparison with Poisson distribution Blue bars denote a histogram of data divided into 1 sec bins. Red curve is a Poisson curve with rate = median count rate of data. |
 |
 |
| Quadrant-wise count rates Data is divided into 100 sec bins |
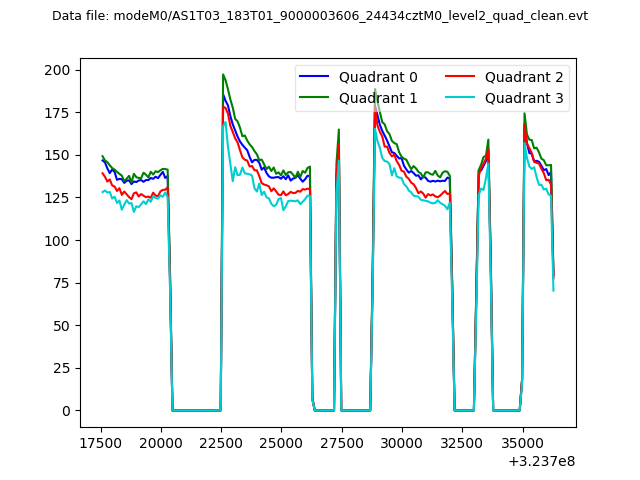 |
|
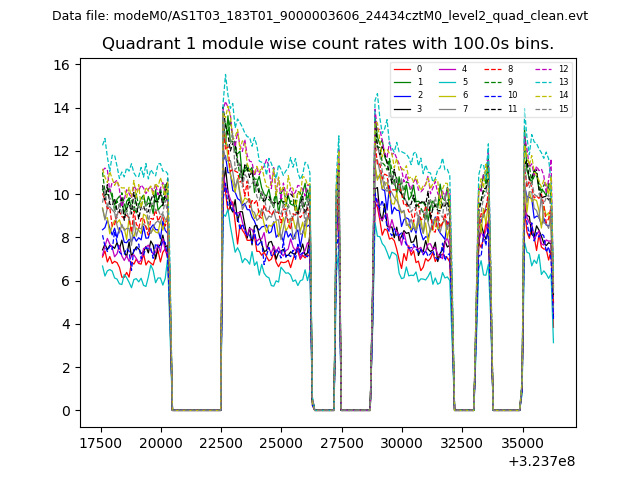
| Module-wise count rates for Quadrant A Data is divided into 100 sec bins |
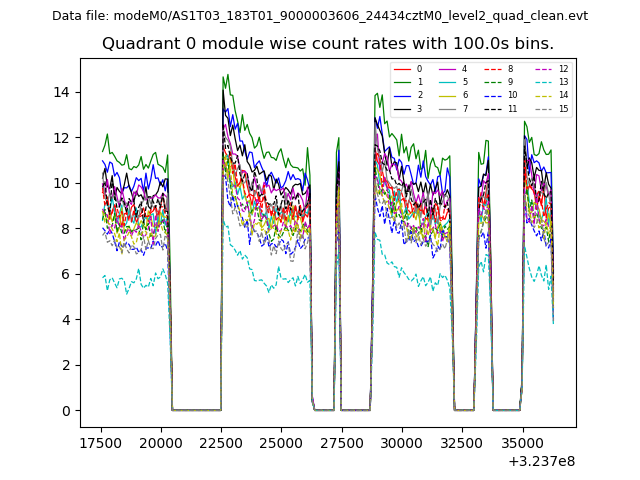 |
 |
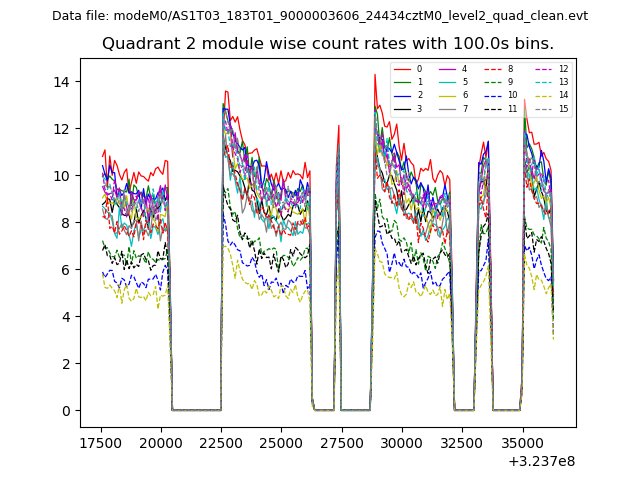
| Module-wise count rates for Quadrant B Data is divided into 100 sec bins |
 |
 |
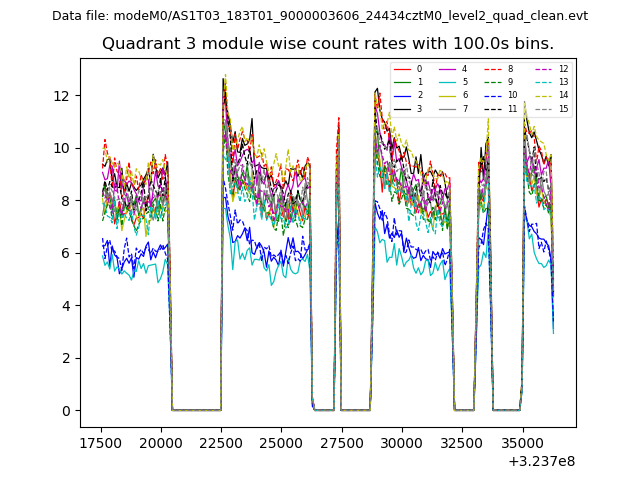
| Module-wise count rates for Quadrant C Data is divided into 100 sec bins |
 |
 |
| Module-wise count rates for Quadrant D Data is divided into 100 sec bins |
 |
 |
| Parameter | Plot |
|---|---|
| CZT HV Monitor | 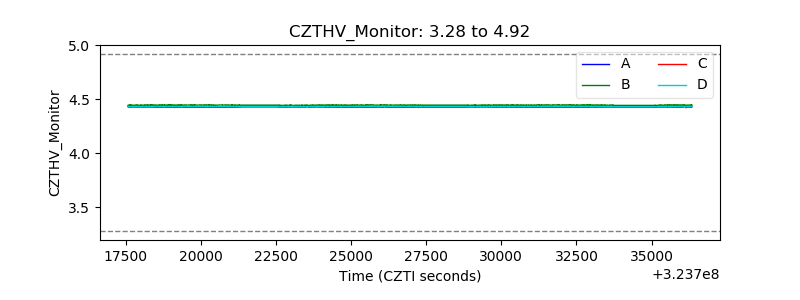 |
| D_VDD | 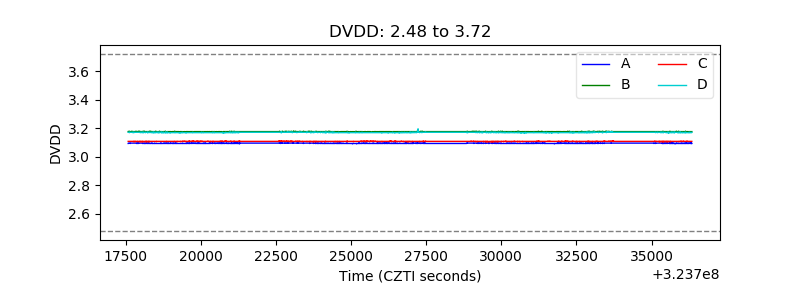 |
| Temperature 1 | 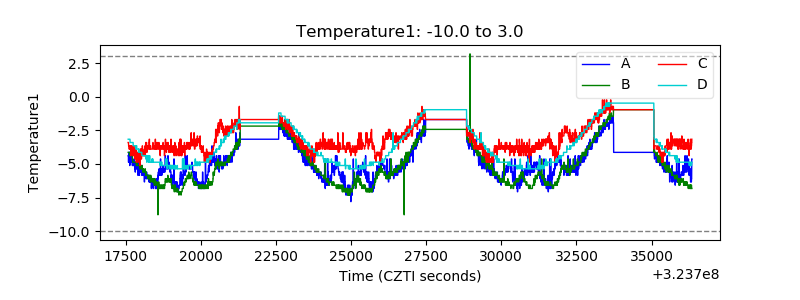 |
| Veto HV Monitor | 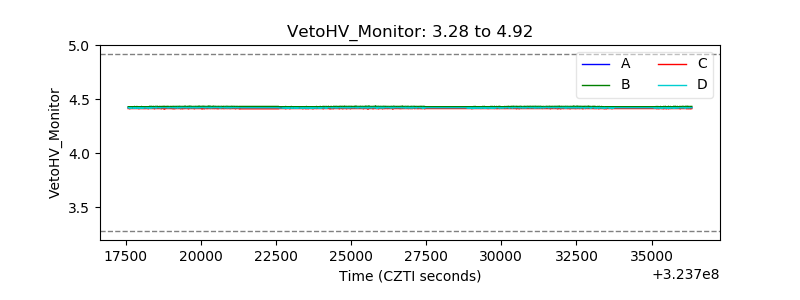 |
| Veto LLD | 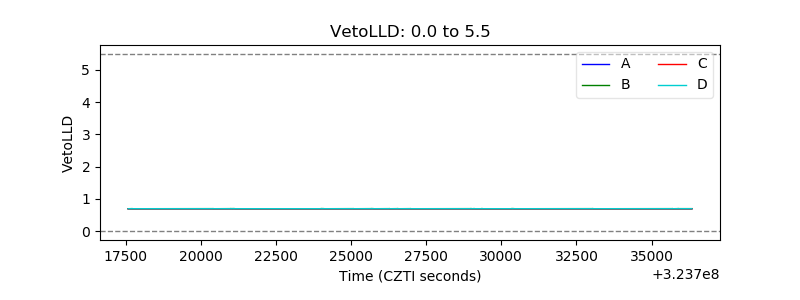 |
| Alpha Counter | 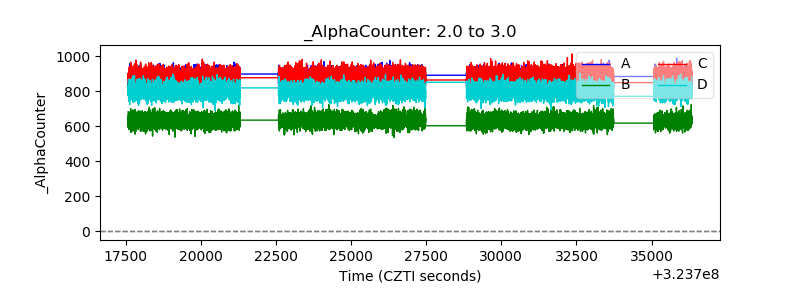 |
| _CPM_Rate | 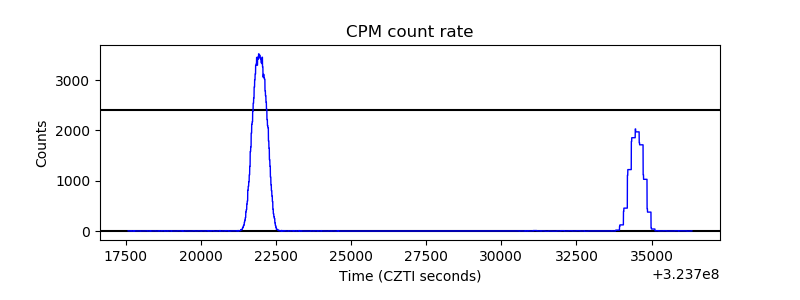 |
| CZT Counter | 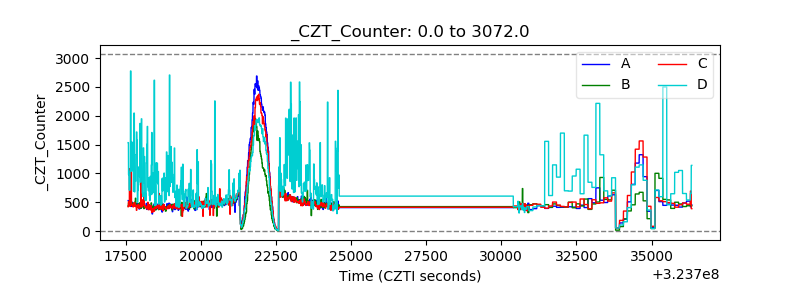 |
| +2.5 Volts monitor |  |
| +5 Volts monitor |  |
| _ROLL_ROT | 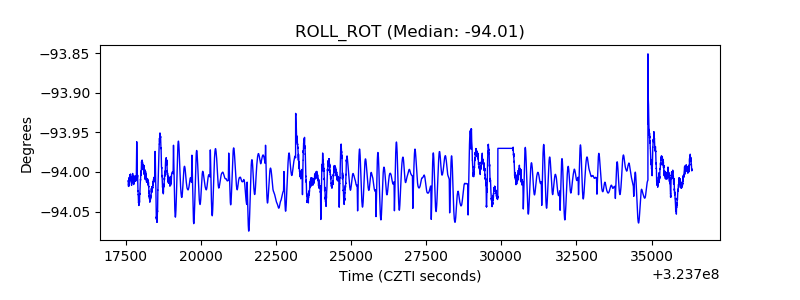 |
| _Roll_DEC | 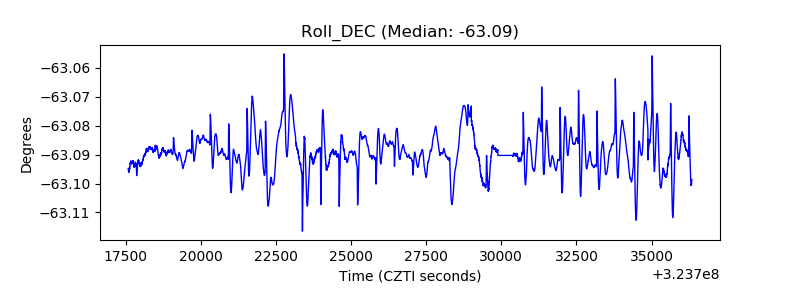 |
| _Roll_RA | 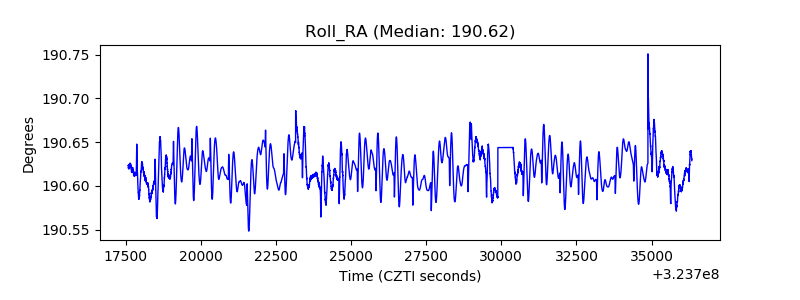 |
| Veto Counter | 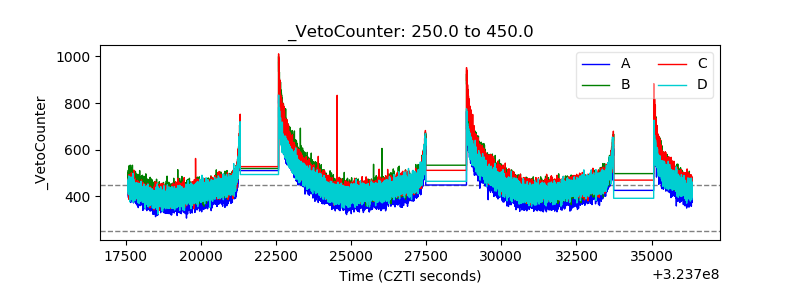 |