| Param | Original file | Final file |
|---|---|---|
| Filename | modeM0/AS1T03_183T01_9000003606_24435cztM0_level2.evt | modeM0/AS1T03_183T01_9000003606_24435cztM0_level2_quad_clean.evt |
| Size (bytes) | 498,297,600 | 115,801,920 |
| Size | 475.2 MB | 110.4 MB |
| Events in quadrant A | 3,084,437 | 772,949 |
| Events in quadrant B | 3,298,522 | 801,607 |
| Events in quadrant C | 3,158,808 | 757,548 |
| Events in quadrant D | 5,099,464 | 712,963 |
| Mode M0 | |||
|---|---|---|---|
| Quadrant | BADHDUFLAG | Total packets | Discarded packets |
| A | 0 | 13605 | 2 |
| B | 0 | 14071 | 2 |
| C | 0 | 13577 | 2 |
| D | 0 | 19785 | 2 |
| Mode SS | |||
|---|---|---|---|
| Quadrant | BADHDUFLAG | Total packets | Discarded packets |
| A | 0 | 134 | 0 |
| B | 0 | 134 | 0 |
| C | 0 | 134 | 0 |
| D | 0 | 134 | 0 |
| Mode M9 | |||
|---|---|---|---|
| Quadrant | BADHDUFLAG | Total packets | Discarded packets |
| A | 0 | 18 | 0 |
| B | 0 | 19 | 0 |
| C | 0 | 19 | 0 |
| D | 0 | 19 | 0 |
| Quadrant | Total seconds | Saturated seconds | Saturation percentage |
|---|---|---|---|
| A | 6631 | 10 | 0.150807% |
| B | 6631 | 37 | 0.557985% |
| C | 6631 | 48 | 0.723873% |
| D | 6631 | 136 | 2.050973% |
Noise dominated data is calculated using 1-second bins in cleaned event files. If a bin has >2000 counts, and if more than 50% of those come from <1% of pixels, then it is considered to be noise-dominated and hence unusable.
| Quadrant | # 1 sec bins | Bins with >0 counts | Bins with >2000 counts | High rate bins dominated by noise | Noise dominated (total time) | Noise dominated (detector-on time) | Marked lightcurve |
|---|---|---|---|---|---|---|---|
| A | 7806 | 6632 | 2 | 2 | 0.03% | 0.03% | 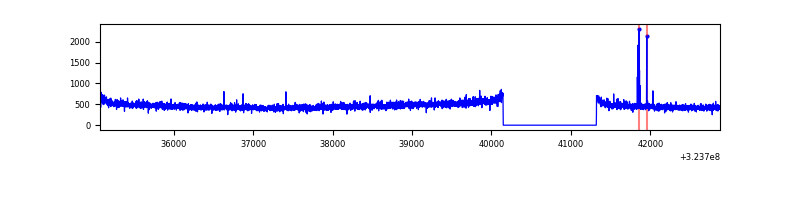 |
| B | 7806 | 6632 | 7 | 7 | 0.09% | 0.11% | 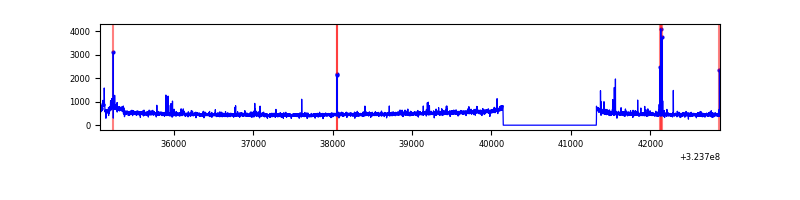 |
| C | 7806 | 6632 | 0 | 0 | 0.00% | 0.00% | 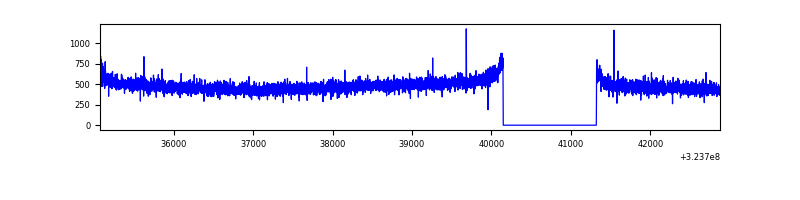 |
| D | 7806 | 6632 | 80 | 80 | 1.02% | 1.21% | 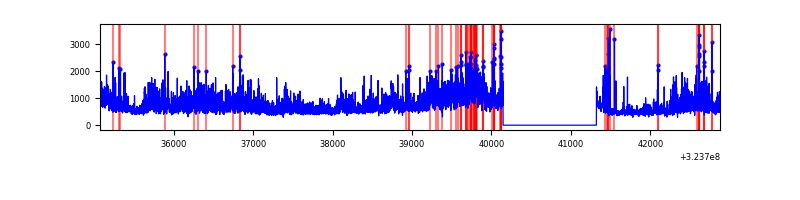 |
Top three noisy pixels from each quadrant. If the there are fewer than three noisy pixels in the level2.evt file, extra rows are filled as -1
| Pixel properties | Quadrant properties | ||||||
|---|---|---|---|---|---|---|---|
| Quadrant | DetID | PixID | Counts | Sigma | Mean | Median | Sigma |
| A | 4 | 2 | 19074 | 114.43 | 795 | 780 | 159.9 |
| A | 13 | 254 | 11434 | 66.64 | 795 | 780 | 159.9 |
| A | 3 | 137 | 7065 | 39.31 | 795 | 780 | 159.9 |
| B | 3 | 64 | 79431 | 521.91 | 808 | 788 | 150.7 |
| B | 4 | 200 | 38582 | 250.82 | 808 | 788 | 150.7 |
| B | 12 | 111 | 17868 | 113.35 | 808 | 788 | 150.7 |
| C | 14 | 238 | 126454 | 699.65 | 776 | 781 | 179.6 |
| C | 3 | 233 | 5907 | 28.54 | 776 | 781 | 179.6 |
| C | 13 | 61 | 5504 | 26.29 | 776 | 781 | 179.6 |
| D | 8 | 195 | 1747147 | 9422.66 | 767 | 745 | 185.3 |
| D | 12 | 218 | 148232 | 795.76 | 767 | 745 | 185.3 |
| D | 1 | 52 | 141056 | 757.04 | 767 | 745 | 185.3 |
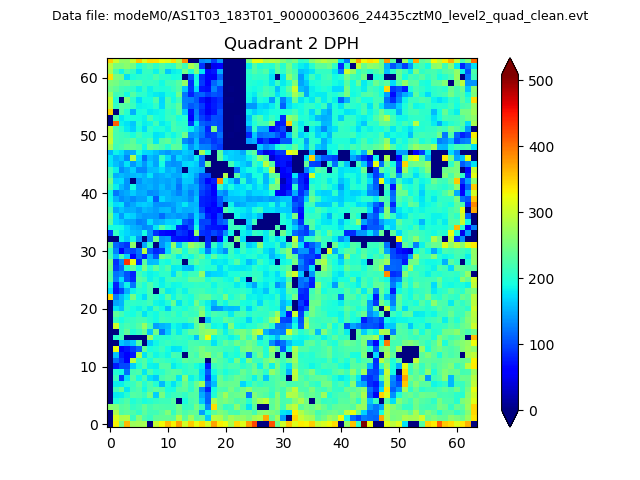
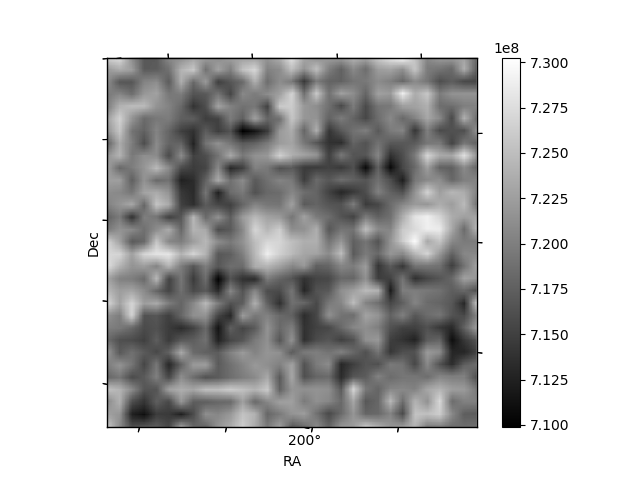
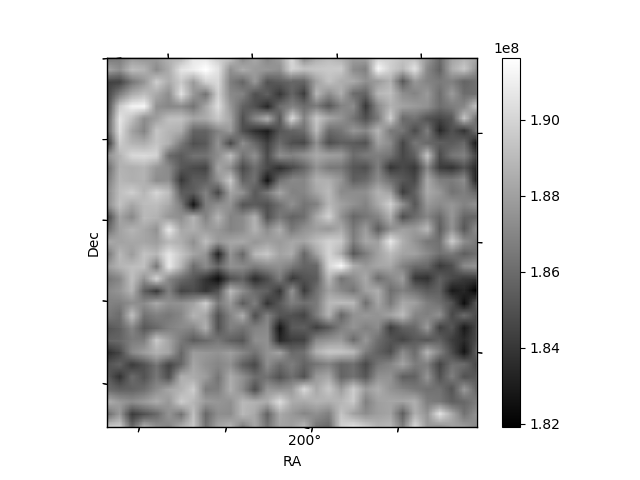
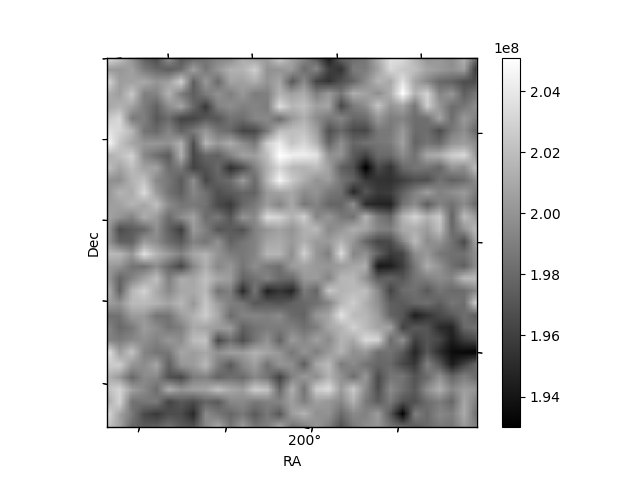
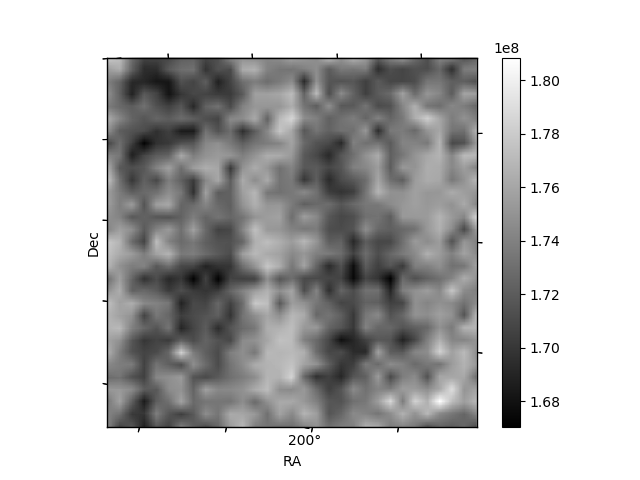
Histogram calculated using DETX and DETY for each event in the final _common_clean file
| Quadrant A | 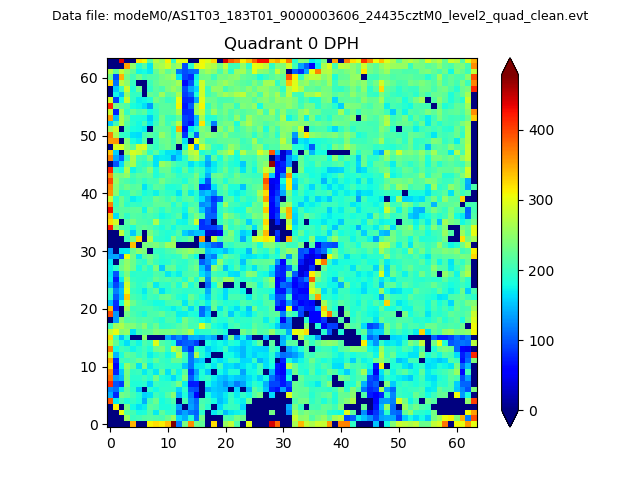 |
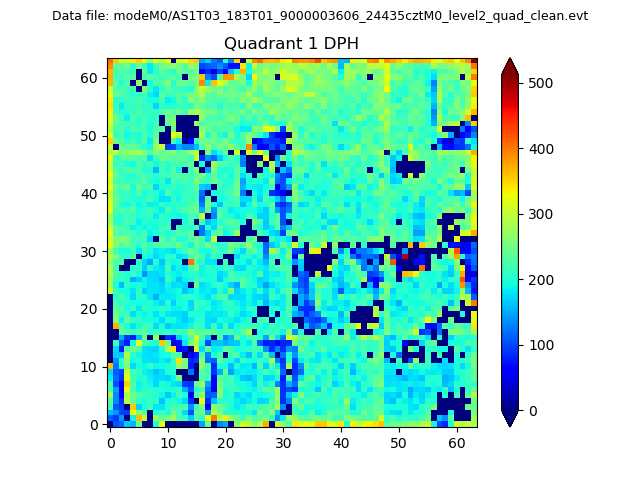 |
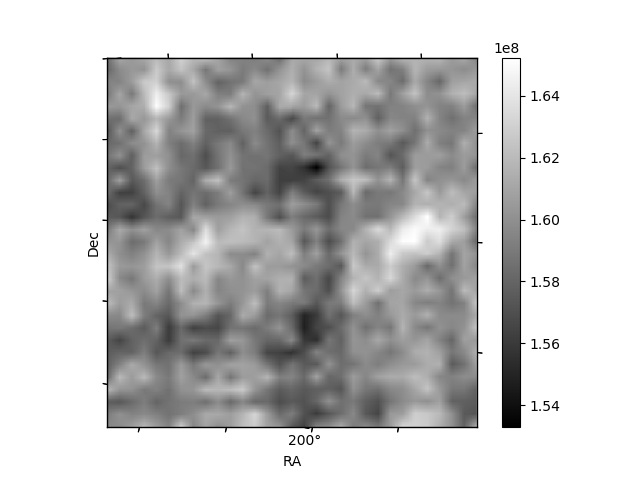
Quadrant B |
|---|---|---|---|
| Quadrant D | 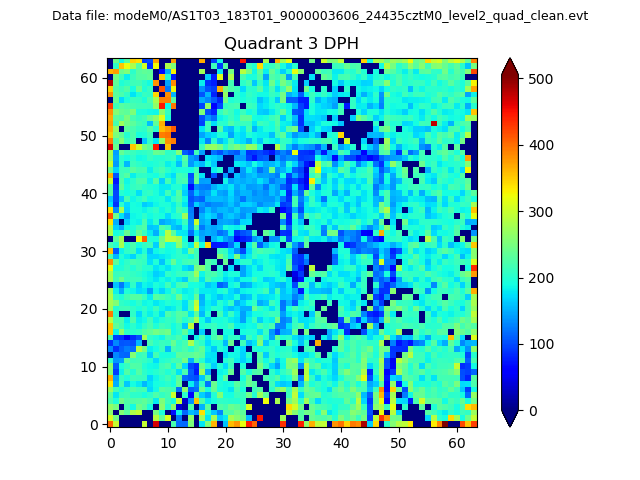 |
 |
Quadrant C |
| Plot type | Count rate plots | Images |
|---|---|---|
| Comparison with Poisson distribution Blue bars denote a histogram of data divided into 1 sec bins. Red curve is a Poisson curve with rate = median count rate of data. |
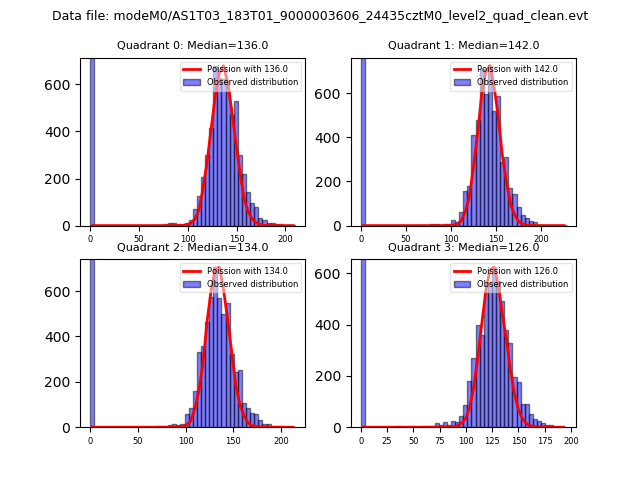 |
 |
| Quadrant-wise count rates Data is divided into 100 sec bins |
 |
|
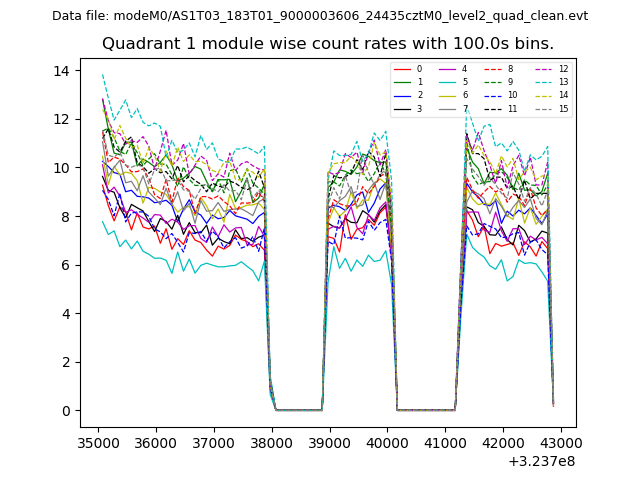
| Module-wise count rates for Quadrant A Data is divided into 100 sec bins |
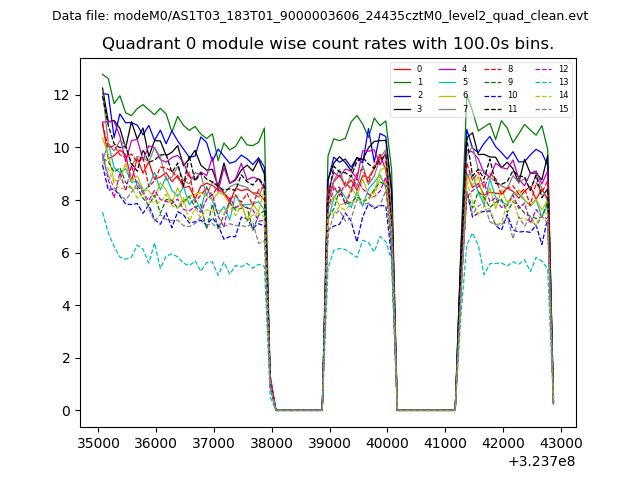 |
 |
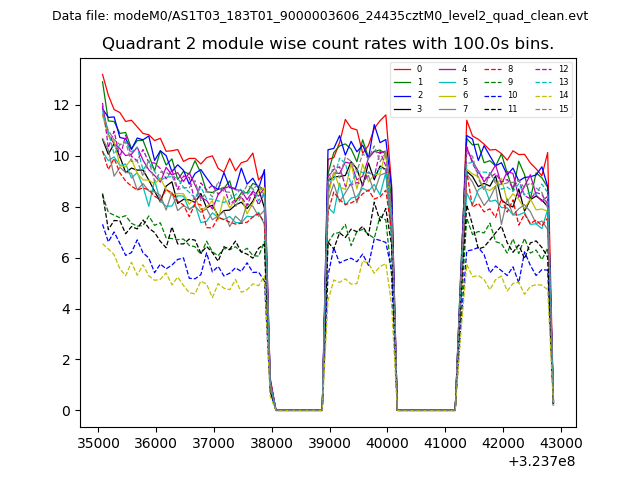
| Module-wise count rates for Quadrant B Data is divided into 100 sec bins |
 |
 |
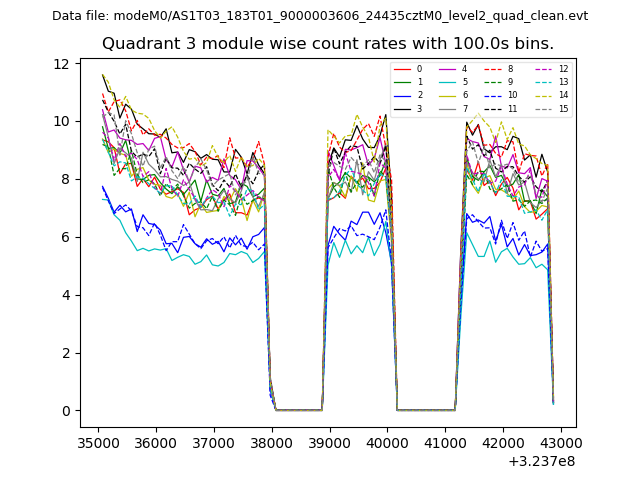
| Module-wise count rates for Quadrant C Data is divided into 100 sec bins |
 |
 |
| Module-wise count rates for Quadrant D Data is divided into 100 sec bins |
 |
 |
| Parameter | Plot |
|---|---|
| CZT HV Monitor | 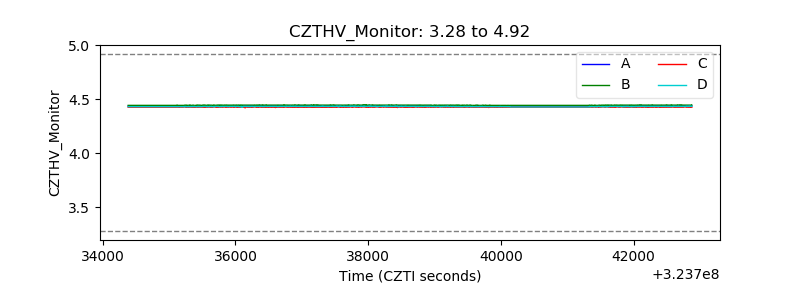 |
| D_VDD | 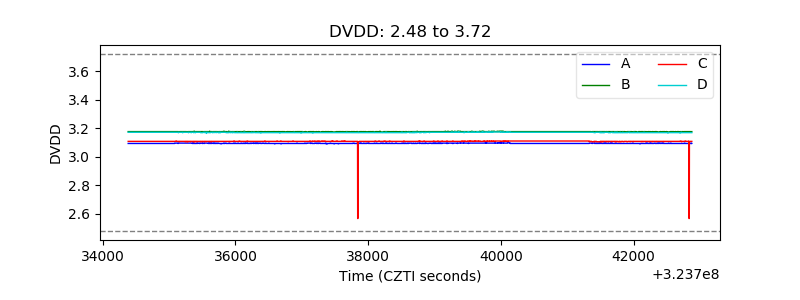 |
| Temperature 1 | 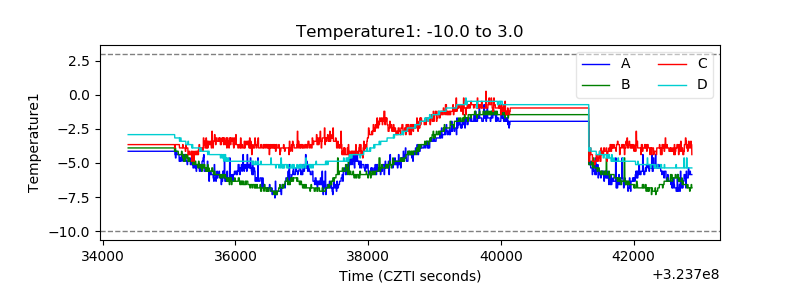 |
| Veto HV Monitor |  |
| Veto LLD |  |
| Alpha Counter | 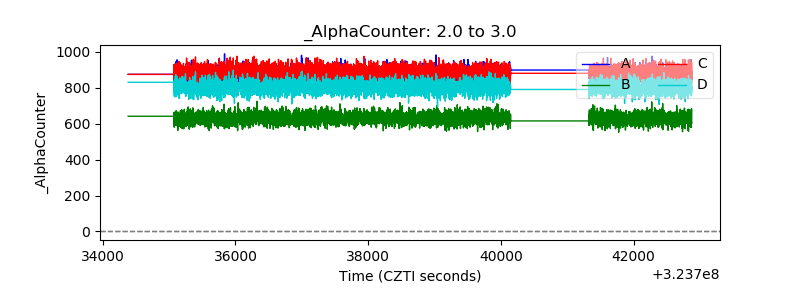 |
| _CPM_Rate | 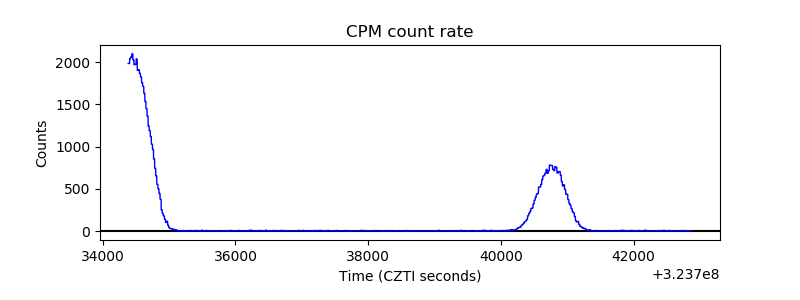 |
| CZT Counter | 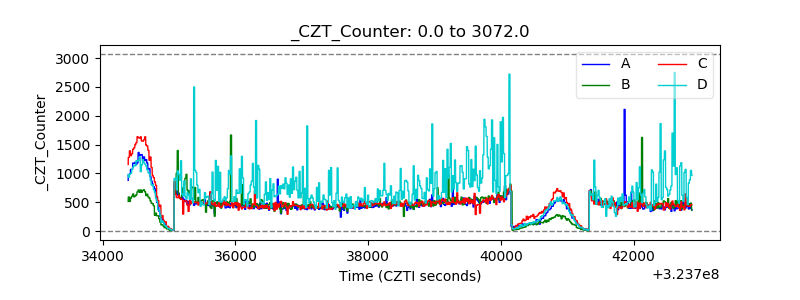 |
| +2.5 Volts monitor |  |
| +5 Volts monitor |  |
| _ROLL_ROT | 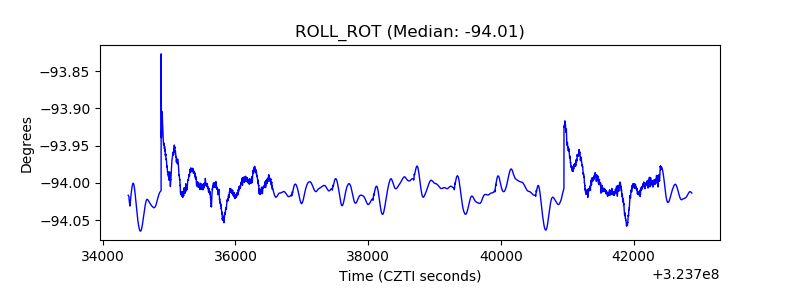 |
| _Roll_DEC | 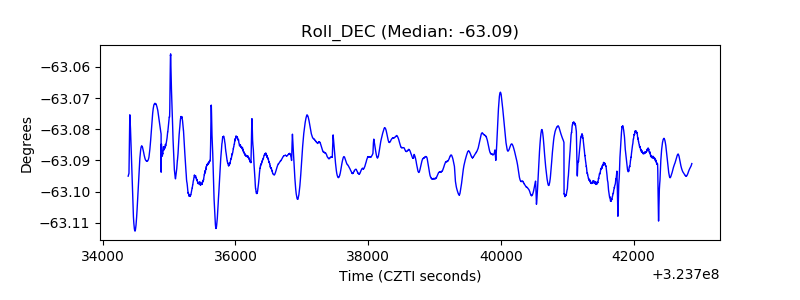 |
| _Roll_RA | 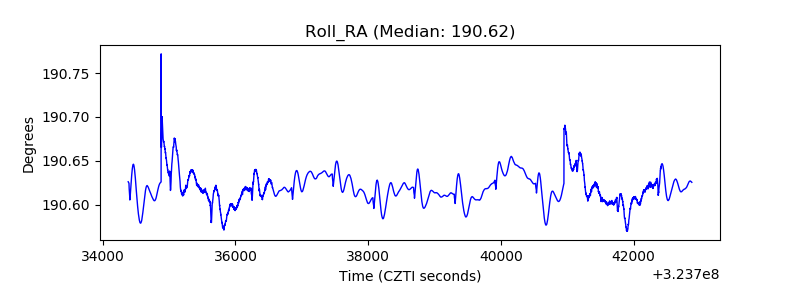 |
| Veto Counter | 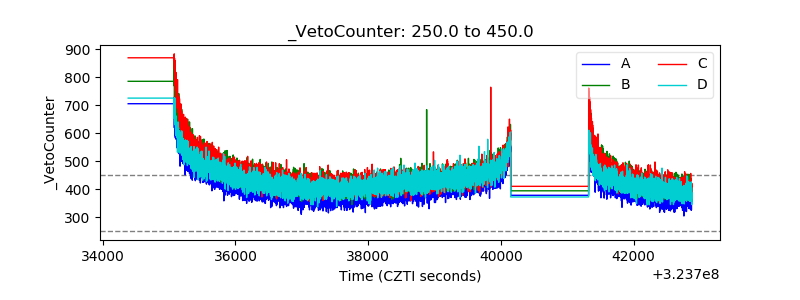 |