| Param | Original file | Final file |
|---|---|---|
| Filename | modeM0/AS1T03_183T01_9000003606_24436cztM0_level2.evt | modeM0/AS1T03_183T01_9000003606_24436cztM0_level2_quad_clean.evt |
| Size (bytes) | 491,025,600 | 117,224,640 |
| Size | 468.3 MB | 111.8 MB |
| Events in quadrant A | 3,181,188 | 780,988 |
| Events in quadrant B | 3,366,452 | 802,296 |
| Events in quadrant C | 3,236,953 | 758,426 |
| Events in quadrant D | 4,614,602 | 724,922 |
| Mode M0 | |||
|---|---|---|---|
| Quadrant | BADHDUFLAG | Total packets | Discarded packets |
| A | 0 | 14176 | 2 |
| B | 0 | 14505 | 2 |
| C | 0 | 14119 | 2 |
| D | 0 | 18446 | 2 |
| Mode SS | |||
|---|---|---|---|
| Quadrant | BADHDUFLAG | Total packets | Discarded packets |
| A | 0 | 140 | 0 |
| B | 0 | 140 | 0 |
| C | 0 | 140 | 0 |
| D | 0 | 140 | 0 |
| Mode M9 | |||
|---|---|---|---|
| Quadrant | BADHDUFLAG | Total packets | Discarded packets |
| A | 0 | 8 | 0 |
| B | 0 | 9 | 0 |
| C | 0 | 9 | 0 |
| D | 0 | 9 | 0 |
| Quadrant | Total seconds | Saturated seconds | Saturation percentage |
|---|---|---|---|
| A | 6948 | 16 | 0.230282% |
| B | 6948 | 48 | 0.690846% |
| C | 6948 | 51 | 0.734024% |
| D | 6948 | 151 | 2.173287% |
Noise dominated data is calculated using 1-second bins in cleaned event files. If a bin has >2000 counts, and if more than 50% of those come from <1% of pixels, then it is considered to be noise-dominated and hence unusable.
| Quadrant | # 1 sec bins | Bins with >0 counts | Bins with >2000 counts | High rate bins dominated by noise | Noise dominated (total time) | Noise dominated (detector-on time) | Marked lightcurve |
|---|---|---|---|---|---|---|---|
| A | 7758 | 6949 | 3 | 3 | 0.04% | 0.04% | 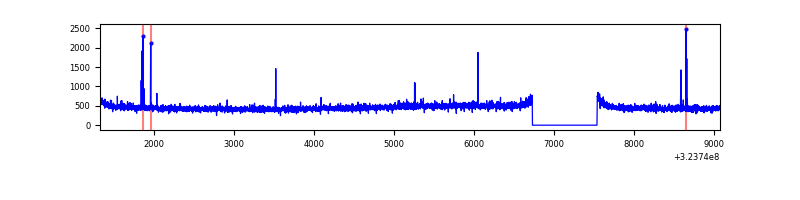 |
| B | 7758 | 6949 | 10 | 10 | 0.13% | 0.14% | 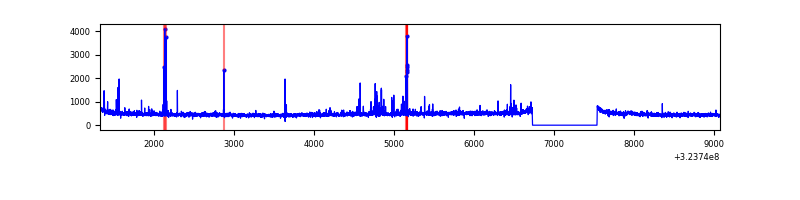 |
| C | 7758 | 6949 | 0 | 0 | 0.00% | 0.00% | 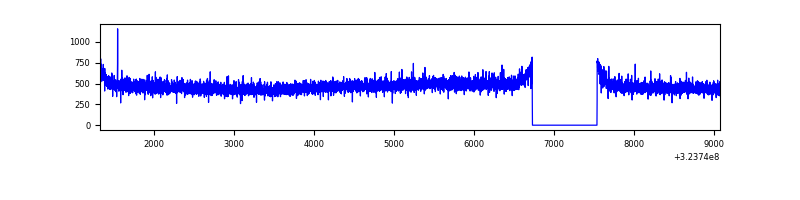 |
| D | 7758 | 6949 | 115 | 115 | 1.48% | 1.65% | 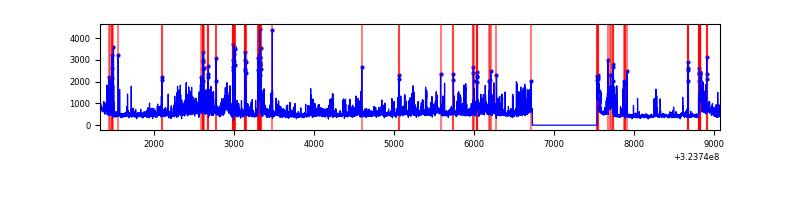 |
Top three noisy pixels from each quadrant. If the there are fewer than three noisy pixels in the level2.evt file, extra rows are filled as -1
| Pixel properties | Quadrant properties | ||||||
|---|---|---|---|---|---|---|---|
| Quadrant | DetID | PixID | Counts | Sigma | Mean | Median | Sigma |
| A | 4 | 2 | 34108 | 204.48 | 816 | 799 | 162.9 |
| A | 13 | 254 | 11658 | 66.66 | 816 | 799 | 162.9 |
| A | 3 | 137 | 7310 | 39.97 | 816 | 799 | 162.9 |
| B | 3 | 64 | 109394 | 702.6 | 824 | 804 | 154.6 |
| B | 0 | 219 | 20971 | 130.48 | 824 | 804 | 154.6 |
| B | 12 | 111 | 18737 | 116.03 | 824 | 804 | 154.6 |
| C | 14 | 238 | 128677 | 694.61 | 794 | 799 | 184.1 |
| C | 13 | 61 | 5574 | 25.94 | 794 | 799 | 184.1 |
| C | 3 | 233 | 4982 | 22.72 | 794 | 799 | 184.1 |
| D | 8 | 195 | 628539 | 3325.98 | 787 | 763 | 188.7 |
| D | 12 | 218 | 619057 | 3275.74 | 787 | 763 | 188.7 |
| D | 1 | 52 | 306449 | 1619.53 | 787 | 763 | 188.7 |
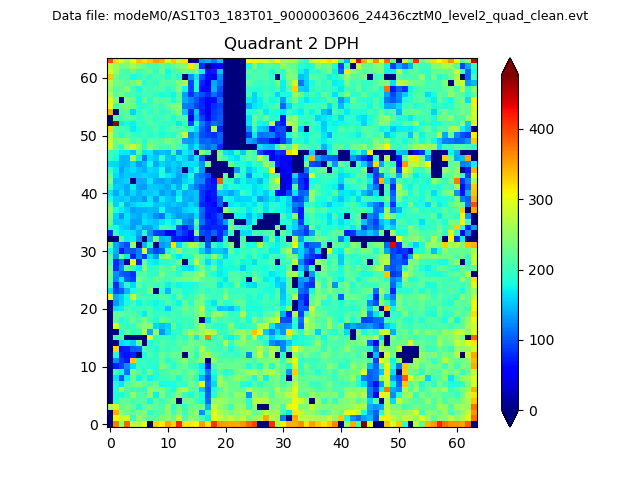
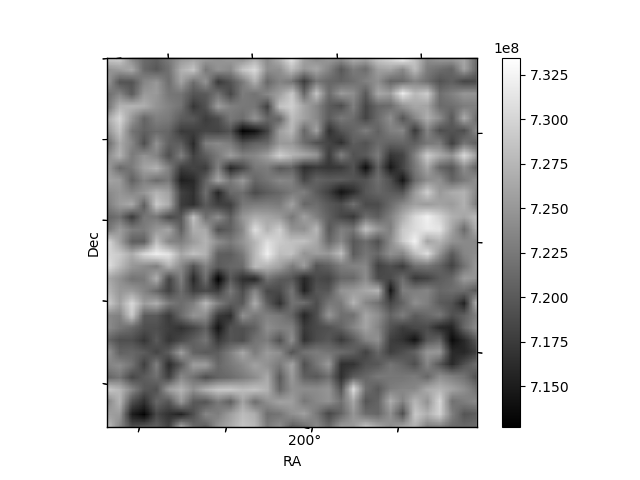
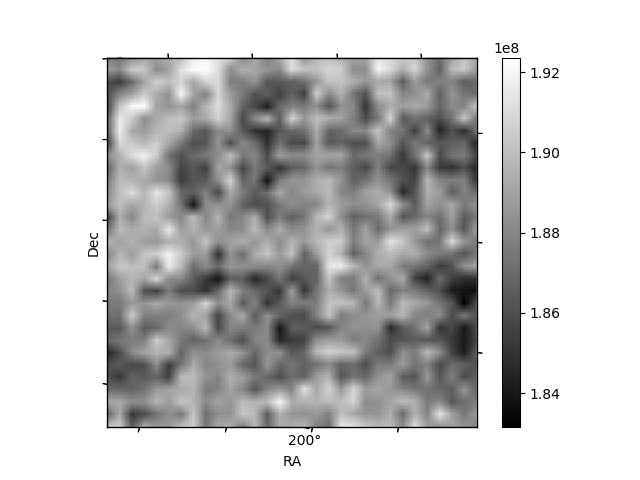
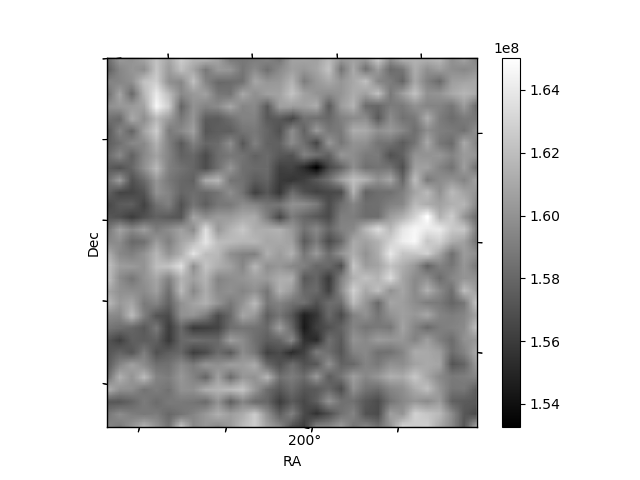
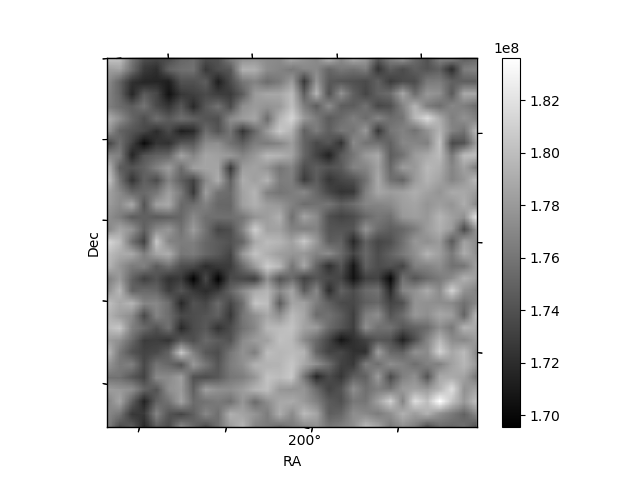
Histogram calculated using DETX and DETY for each event in the final _common_clean file
| Quadrant A | 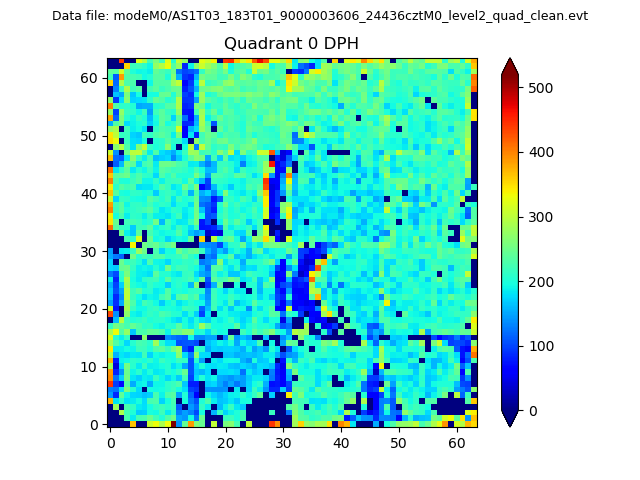 |
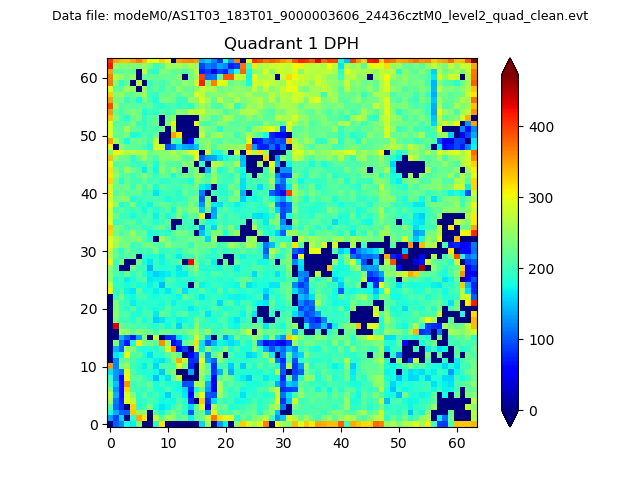 |
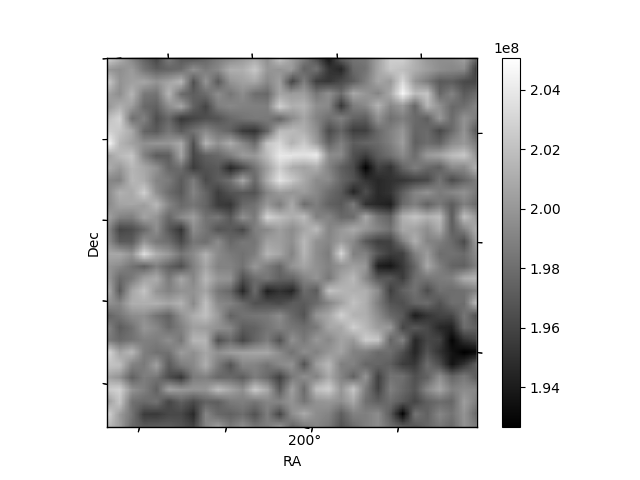
Quadrant B |
|---|---|---|---|
| Quadrant D | 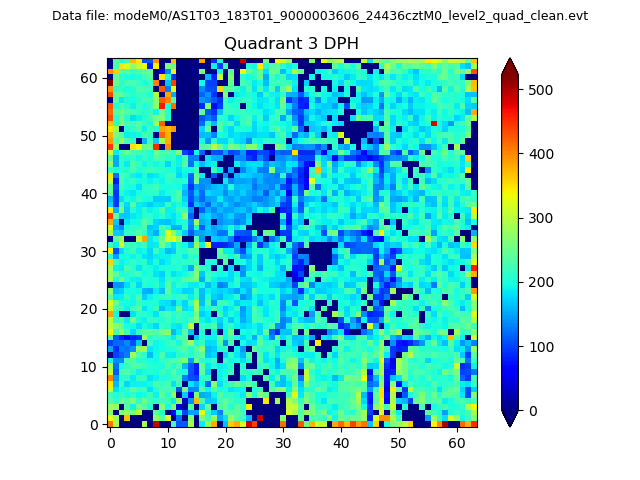 |
 |
Quadrant C |
| Plot type | Count rate plots | Images |
|---|---|---|
| Comparison with Poisson distribution Blue bars denote a histogram of data divided into 1 sec bins. Red curve is a Poisson curve with rate = median count rate of data. |
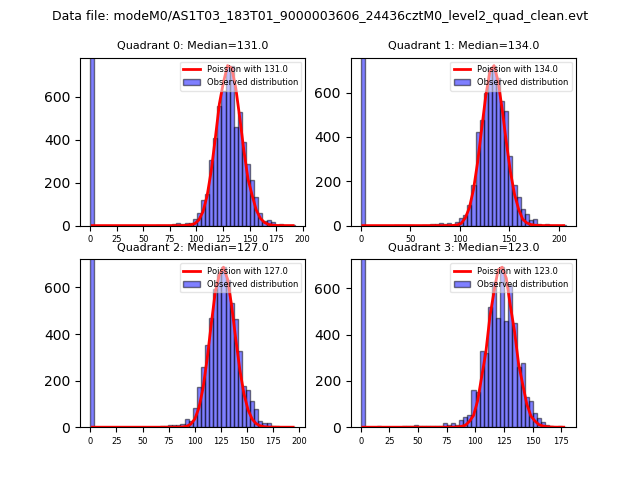 |
 |
| Quadrant-wise count rates Data is divided into 100 sec bins |
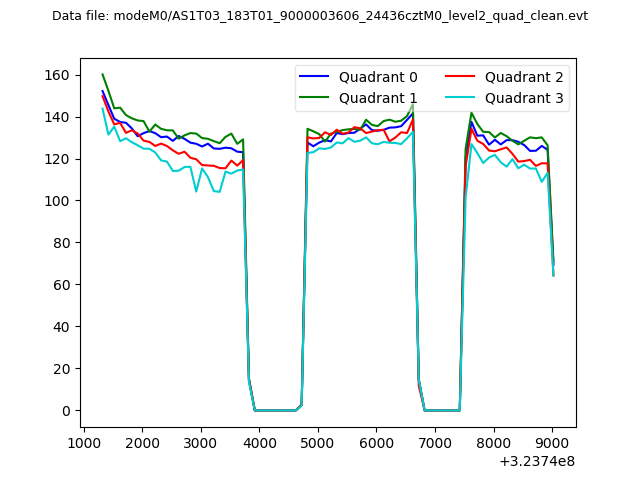 |
|
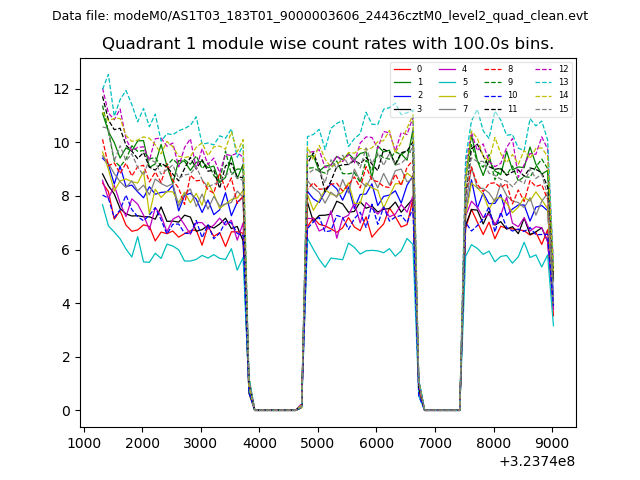
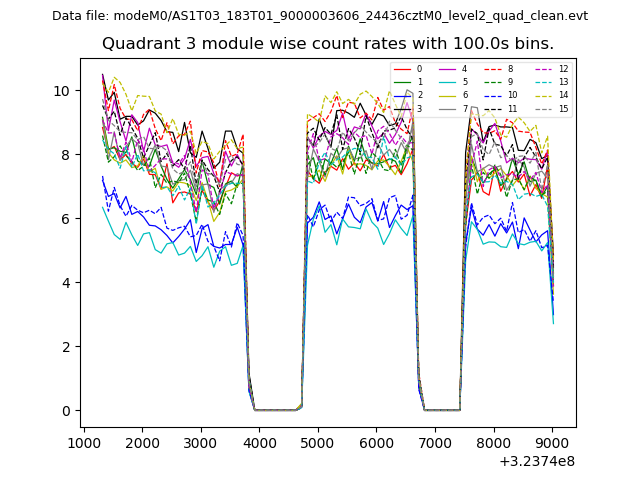
| Module-wise count rates for Quadrant A Data is divided into 100 sec bins |
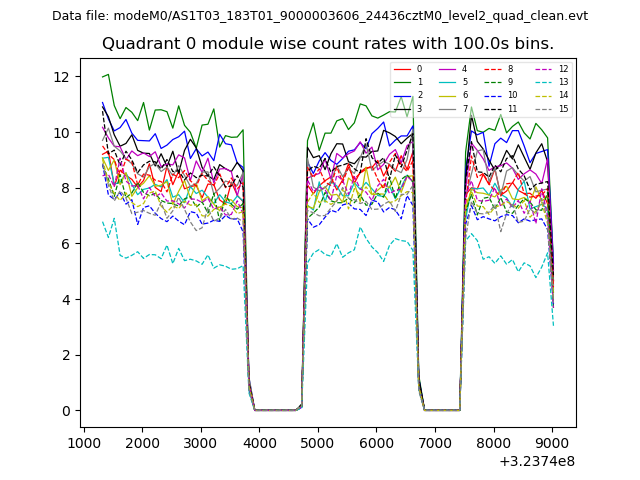 |
 |
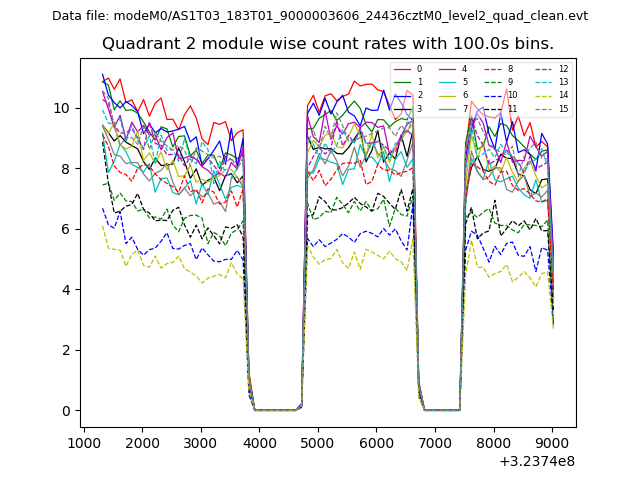
| Module-wise count rates for Quadrant B Data is divided into 100 sec bins |
 |
 |
| Module-wise count rates for Quadrant C Data is divided into 100 sec bins |
 |
 |
| Module-wise count rates for Quadrant D Data is divided into 100 sec bins |
 |
 |
| Parameter | Plot |
|---|---|
| CZT HV Monitor | 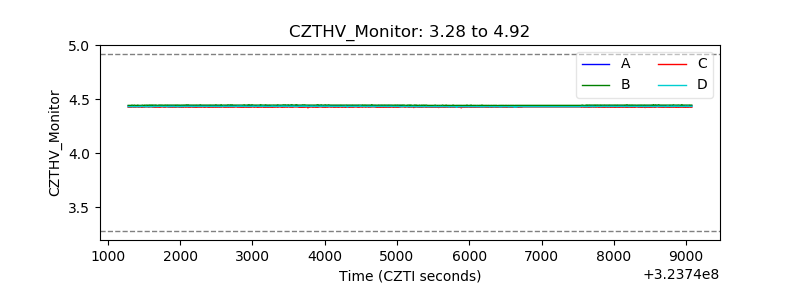 |
| D_VDD | 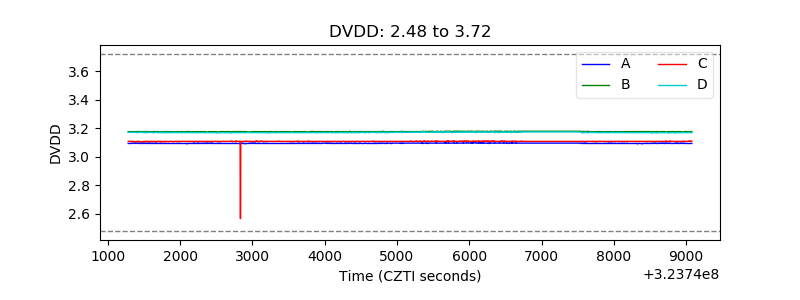 |
| Temperature 1 | 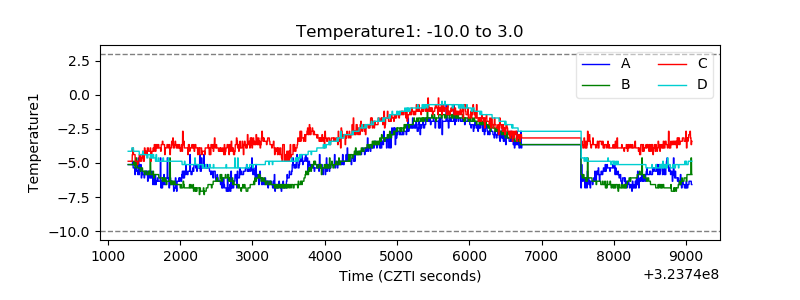 |
| Veto HV Monitor | 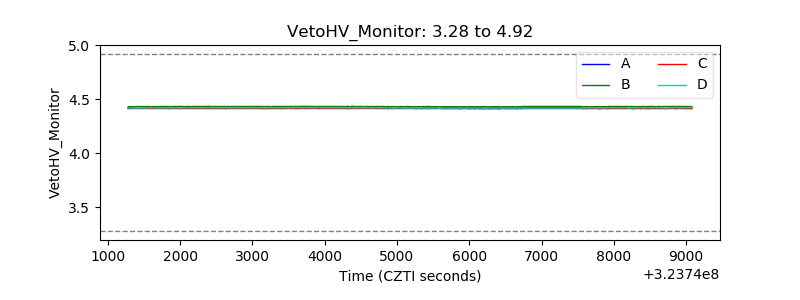 |
| Veto LLD | 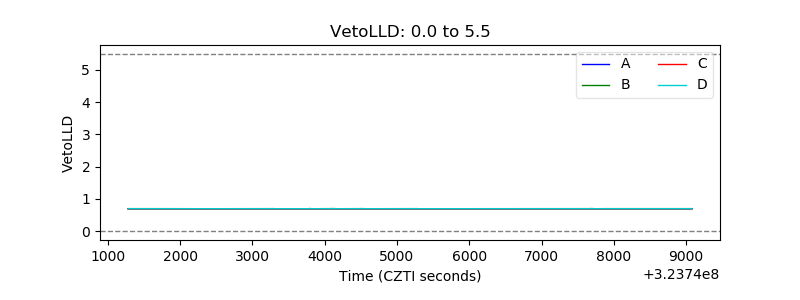 |
| Alpha Counter | 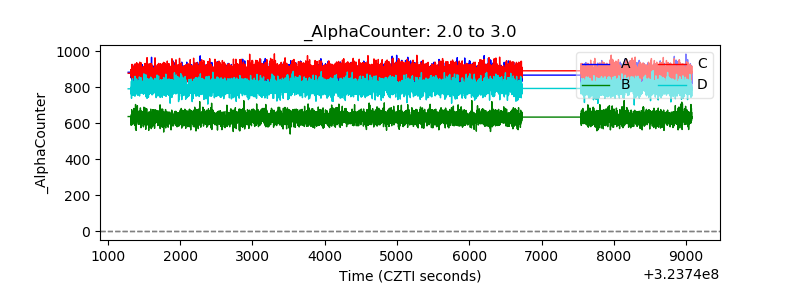 |
| _CPM_Rate | 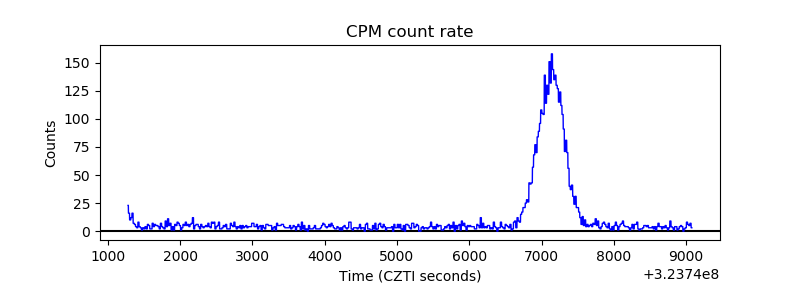 |
| CZT Counter |  |
| +2.5 Volts monitor |  |
| +5 Volts monitor |  |
| _ROLL_ROT | 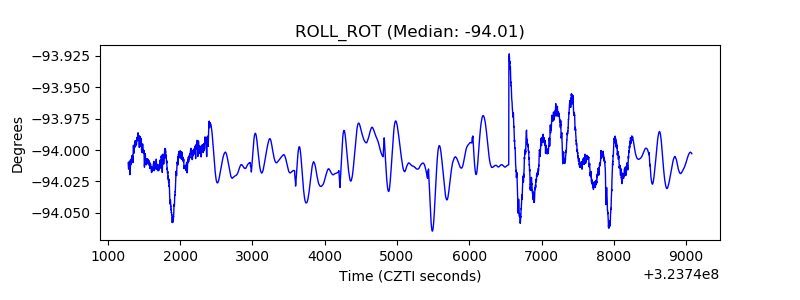 |
| _Roll_DEC | 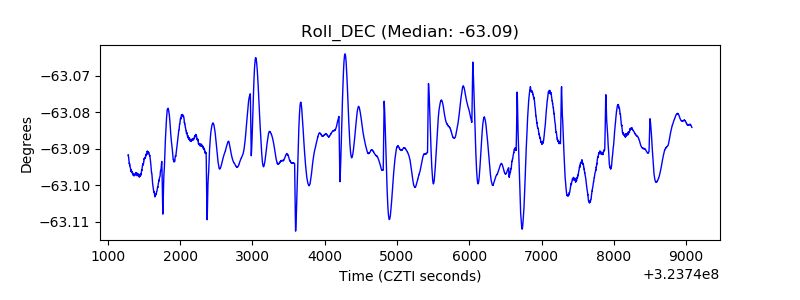 |
| _Roll_RA |  |
| Veto Counter | 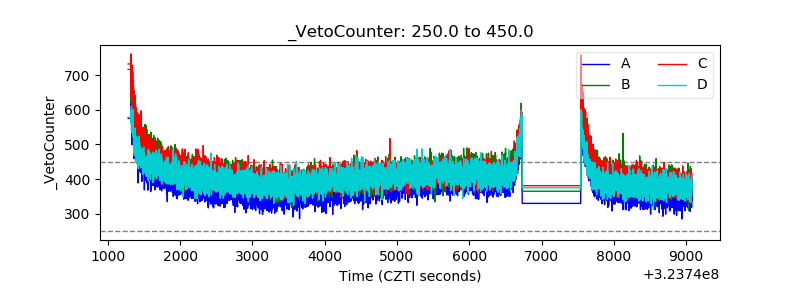 |