| Param | Original file | Final file |
|---|---|---|
| Filename | modeM0/AS1T03_183T01_9000003606_24437cztM0_level2.evt | modeM0/AS1T03_183T01_9000003606_24437cztM0_level2_quad_clean.evt |
| Size (bytes) | 485,254,080 | 118,068,480 |
| Size | 462.8 MB | 112.6 MB |
| Events in quadrant A | 3,252,788 | 784,734 |
| Events in quadrant B | 3,541,959 | 799,624 |
| Events in quadrant C | 3,353,006 | 760,872 |
| Events in quadrant D | 4,062,310 | 732,813 |
| Mode M0 | |||
|---|---|---|---|
| Quadrant | BADHDUFLAG | Total packets | Discarded packets |
| A | 0 | 14596 | 1 |
| B | 0 | 15314 | 1 |
| C | 0 | 14694 | 1 |
| D | 0 | 17005 | 1 |
| Mode SS | |||
|---|---|---|---|
| Quadrant | BADHDUFLAG | Total packets | Discarded packets |
| A | 0 | 144 | 0 |
| B | 0 | 144 | 0 |
| C | 0 | 144 | 0 |
| D | 0 | 144 | 0 |
| Mode M9 | |||
|---|---|---|---|
| Quadrant | BADHDUFLAG | Total packets | Discarded packets |
| A | 0 | 4 | 0 |
| B | 0 | 4 | 0 |
| C | 0 | 4 | 0 |
| D | 0 | 4 | 0 |
| Quadrant | Total seconds | Saturated seconds | Saturation percentage |
|---|---|---|---|
| A | 7151 | 110 | 1.538246% |
| B | 7152 | 147 | 2.055369% |
| C | 7152 | 161 | 2.251119% |
| D | 7152 | 167 | 2.335011% |
Noise dominated data is calculated using 1-second bins in cleaned event files. If a bin has >2000 counts, and if more than 50% of those come from <1% of pixels, then it is considered to be noise-dominated and hence unusable.
| Quadrant | # 1 sec bins | Bins with >0 counts | Bins with >2000 counts | High rate bins dominated by noise | Noise dominated (total time) | Noise dominated (detector-on time) | Marked lightcurve |
|---|---|---|---|---|---|---|---|
| A | 7526 | 7152 | 1 | 1 | 0.01% | 0.01% | 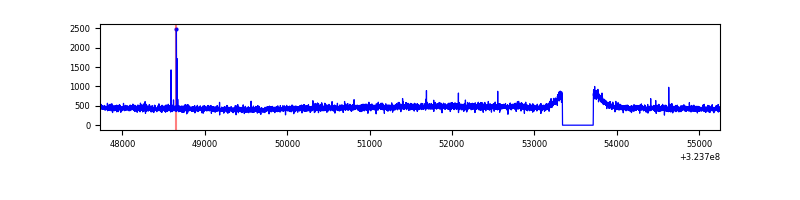 |
| B | 7527 | 7153 | 4 | 4 | 0.05% | 0.06% | 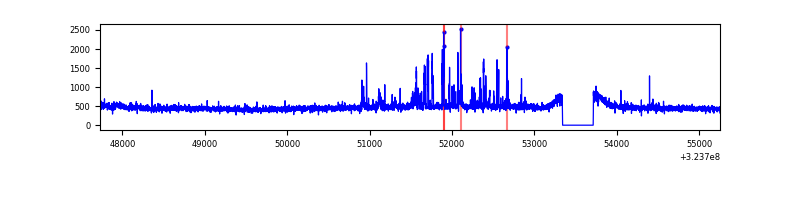 |
| C | 7527 | 7153 | 1 | 1 | 0.01% | 0.01% | 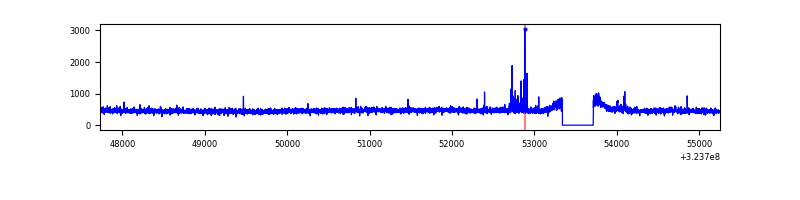 |
| D | 7527 | 7153 | 70 | 70 | 0.93% | 0.98% | 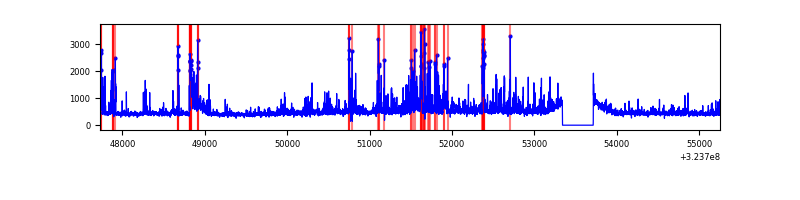 |
Top three noisy pixels from each quadrant. If the there are fewer than three noisy pixels in the level2.evt file, extra rows are filled as -1
| Pixel properties | Quadrant properties | ||||||
|---|---|---|---|---|---|---|---|
| Quadrant | DetID | PixID | Counts | Sigma | Mean | Median | Sigma |
| A | 4 | 2 | 12565 | 70.02 | 840 | 822 | 167.7 |
| A | 13 | 254 | 12210 | 67.9 | 840 | 822 | 167.7 |
| A | 3 | 137 | 7790 | 41.55 | 840 | 822 | 167.7 |
| B | 0 | 219 | 217543 | 1354.35 | 841 | 819 | 160.0 |
| B | 12 | 111 | 19528 | 116.91 | 841 | 819 | 160.0 |
| B | 11 | 111 | 17198 | 102.35 | 841 | 819 | 160.0 |
| C | 14 | 238 | 129874 | 681.89 | 811 | 814 | 189.3 |
| C | 2 | 16 | 36718 | 189.7 | 811 | 814 | 189.3 |
| C | 10 | 9 | 20364 | 103.29 | 811 | 814 | 189.3 |
| D | 12 | 218 | 390569 | 1978.55 | 811 | 787 | 197.0 |
| D | 8 | 195 | 269610 | 1364.56 | 811 | 787 | 197.0 |
| D | 1 | 52 | 268627 | 1359.57 | 811 | 787 | 197.0 |
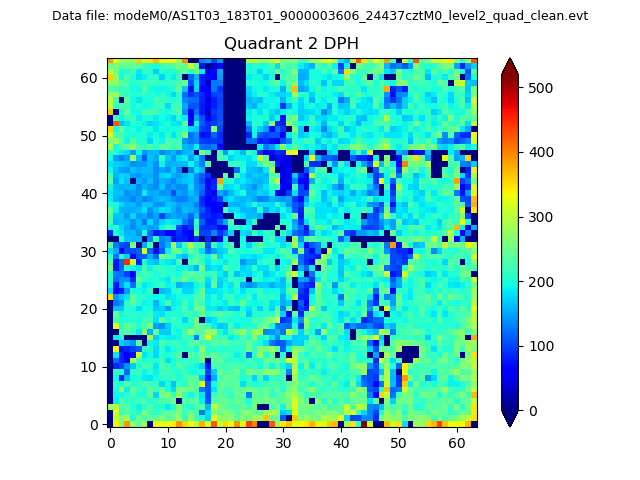
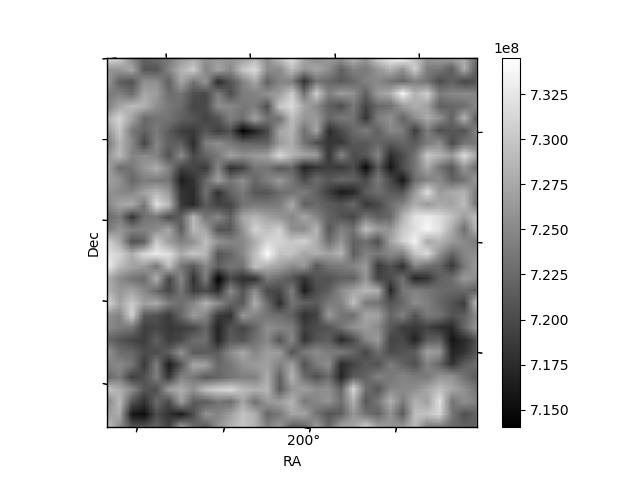
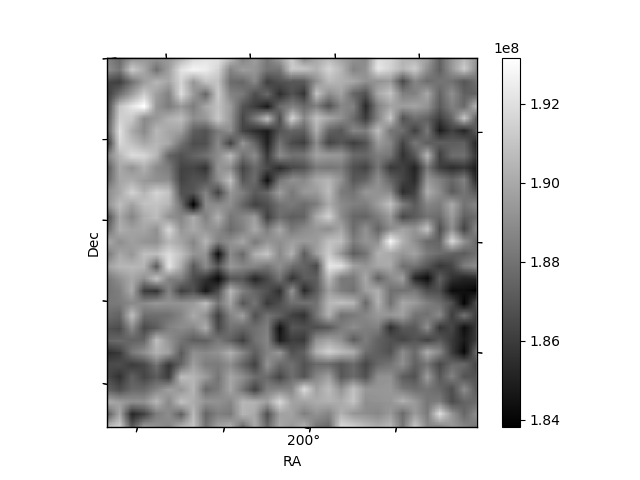
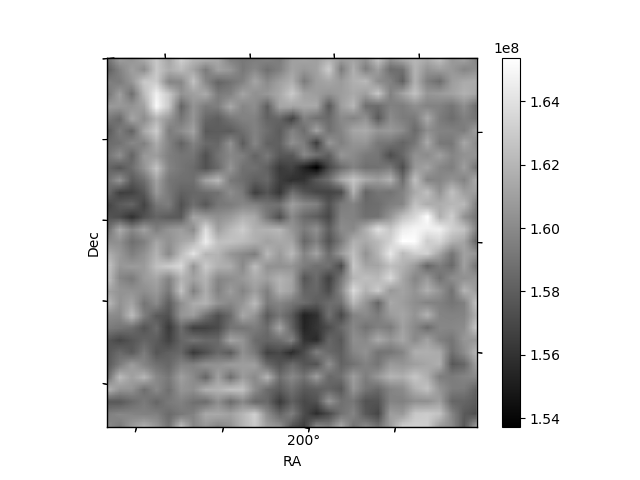
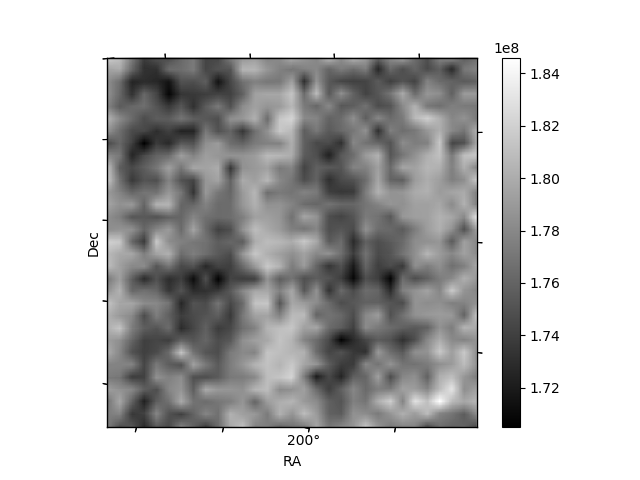
Histogram calculated using DETX and DETY for each event in the final _common_clean file
| Quadrant A | 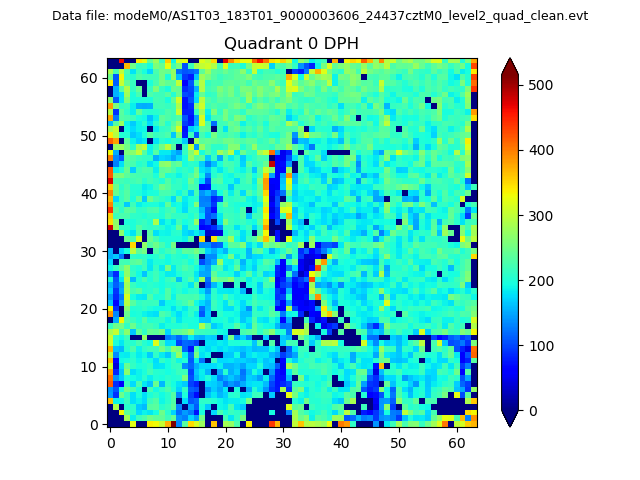 |
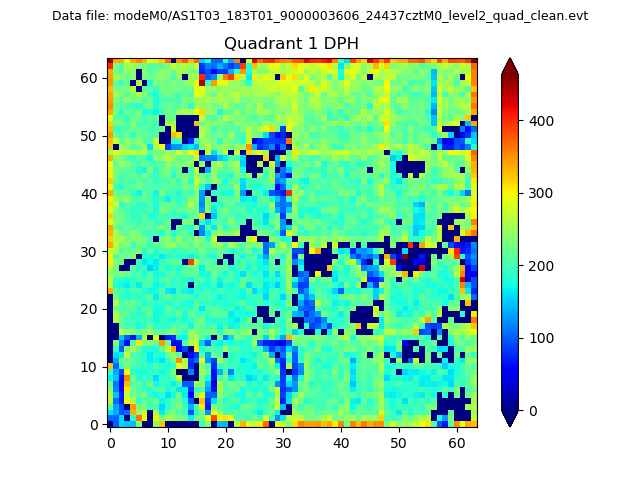 |
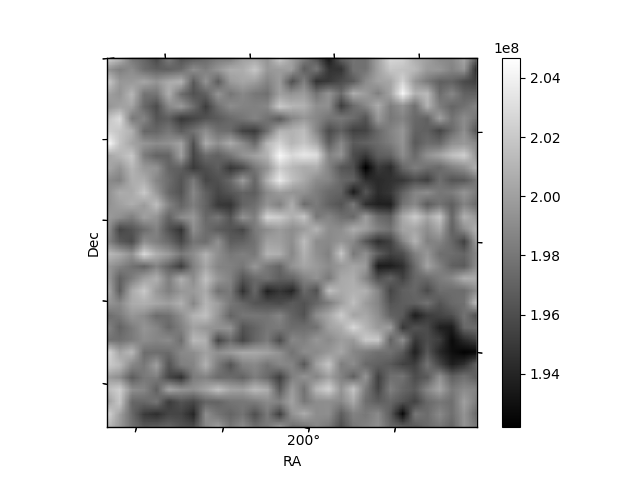
Quadrant B |
|---|---|---|---|
| Quadrant D | 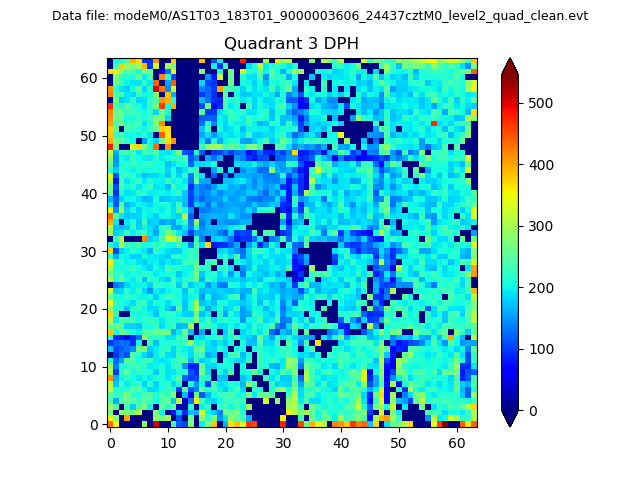 |
 |
Quadrant C |
| Plot type | Count rate plots | Images |
|---|---|---|
| Comparison with Poisson distribution Blue bars denote a histogram of data divided into 1 sec bins. Red curve is a Poisson curve with rate = median count rate of data. |
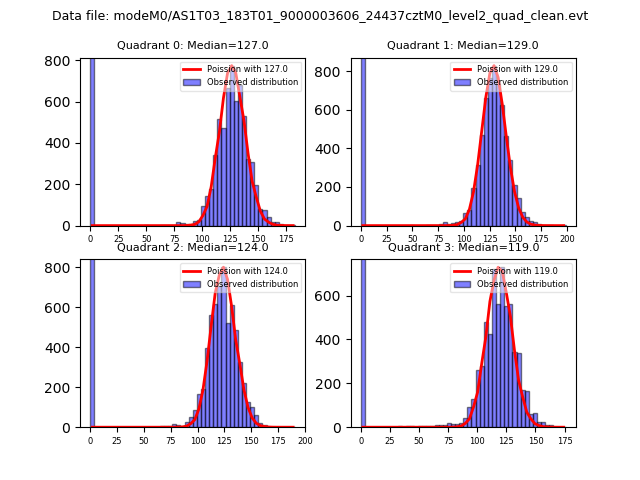 |
 |
| Quadrant-wise count rates Data is divided into 100 sec bins |
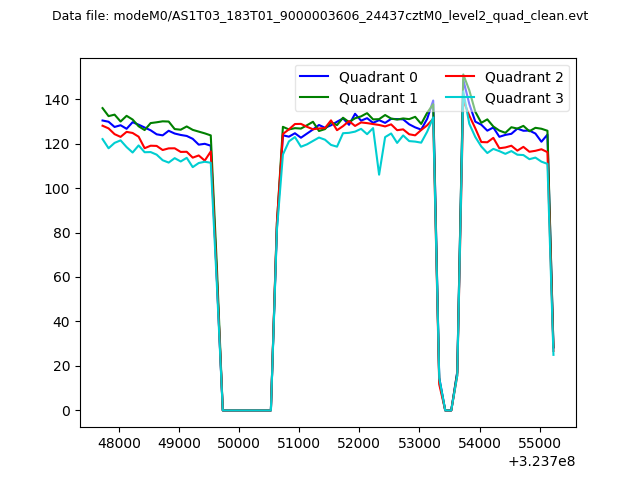 |
|
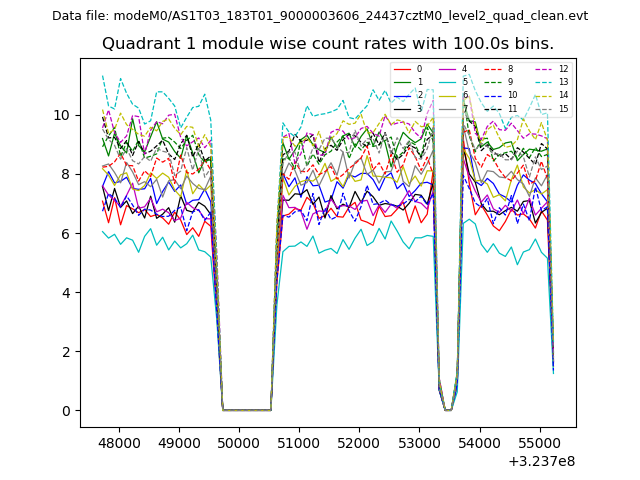
| Module-wise count rates for Quadrant A Data is divided into 100 sec bins |
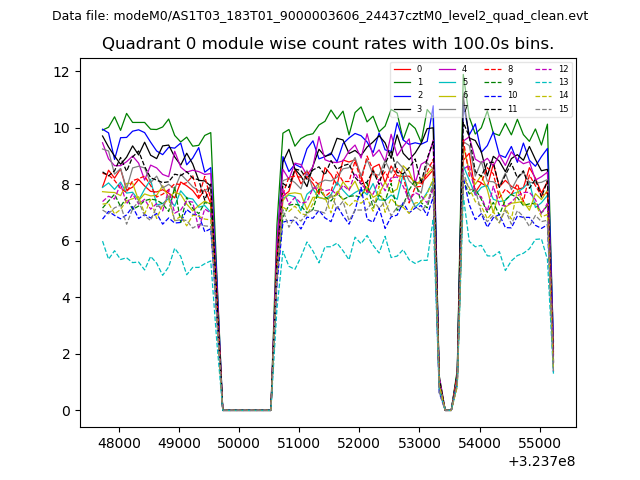 |
 |
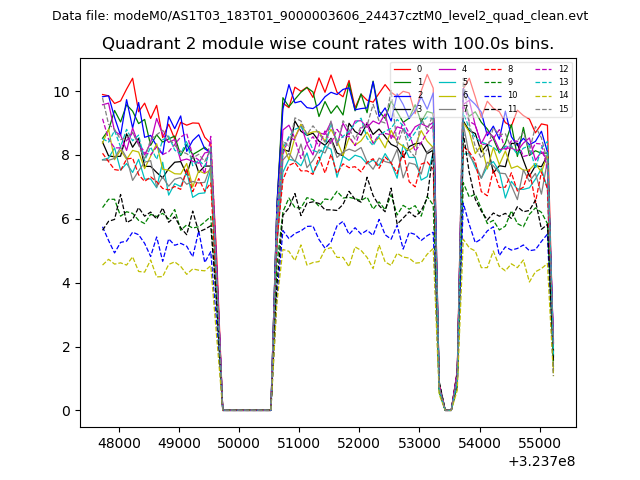
| Module-wise count rates for Quadrant B Data is divided into 100 sec bins |
 |
 |
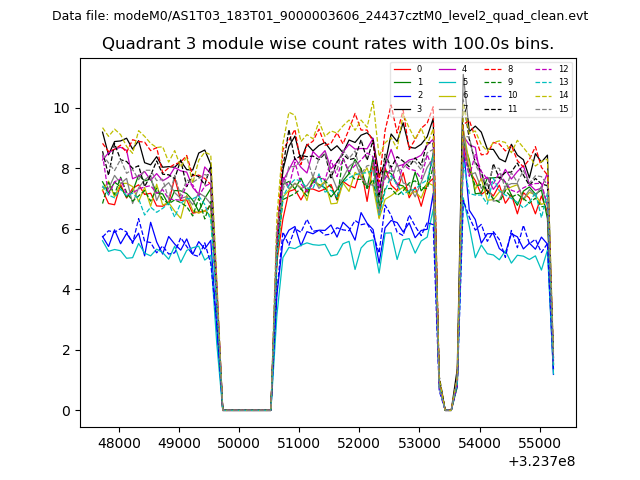
| Module-wise count rates for Quadrant C Data is divided into 100 sec bins |
 |
 |
| Module-wise count rates for Quadrant D Data is divided into 100 sec bins |
 |
 |
| Parameter | Plot |
|---|---|
| CZT HV Monitor | 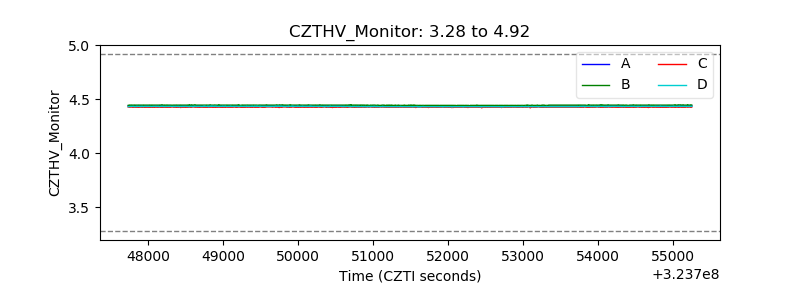 |
| D_VDD | 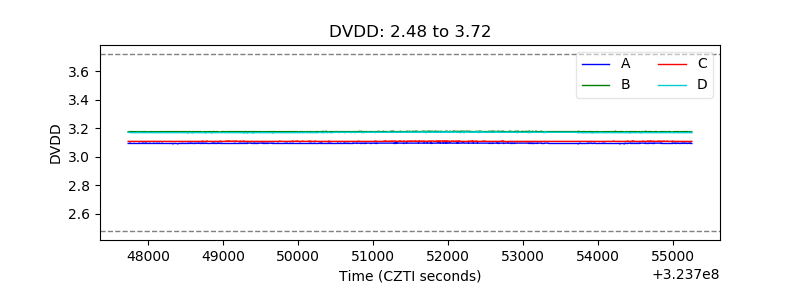 |
| Temperature 1 | 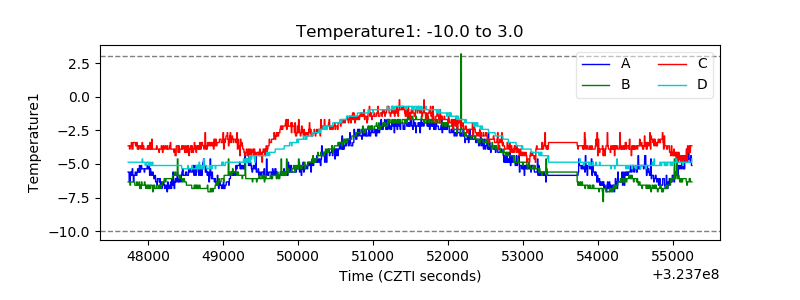 |
| Veto HV Monitor |  |
| Veto LLD | 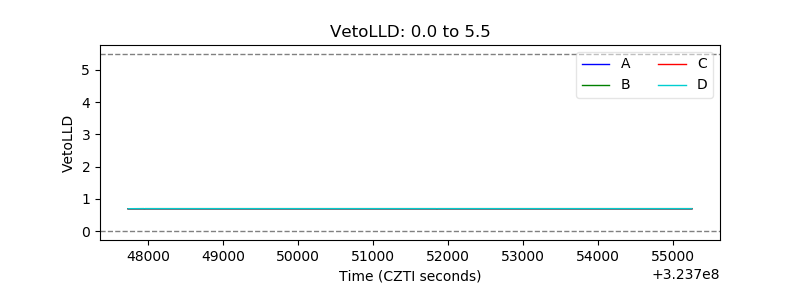 |
| Alpha Counter | 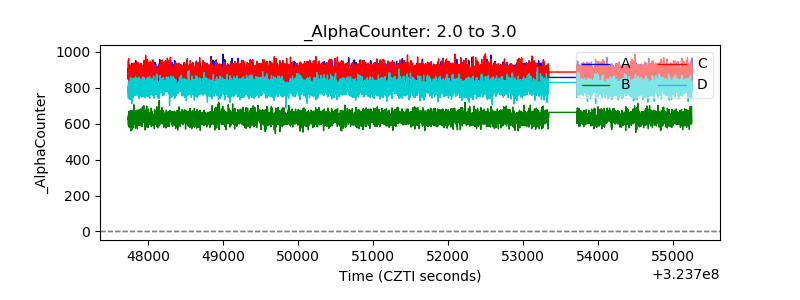 |
| _CPM_Rate | 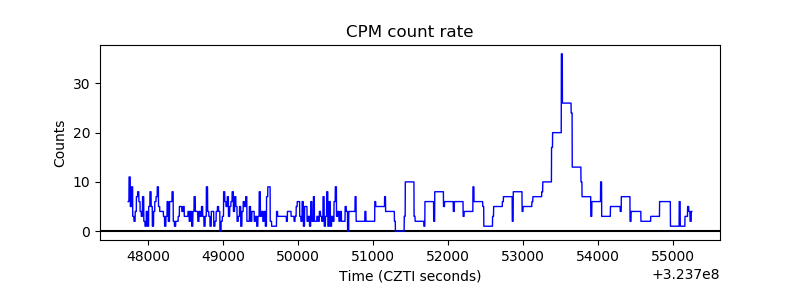 |
| CZT Counter |  |
| +2.5 Volts monitor |  |
| +5 Volts monitor |  |
| _ROLL_ROT | 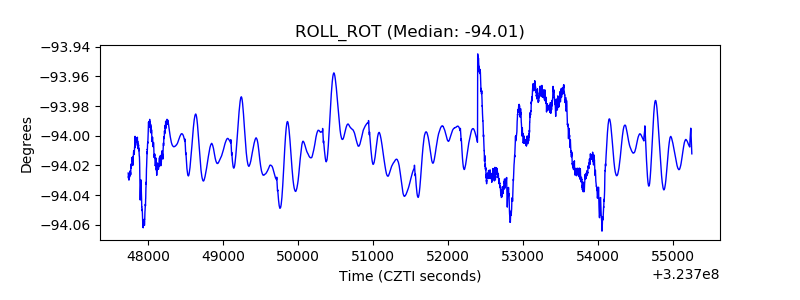 |
| _Roll_DEC | 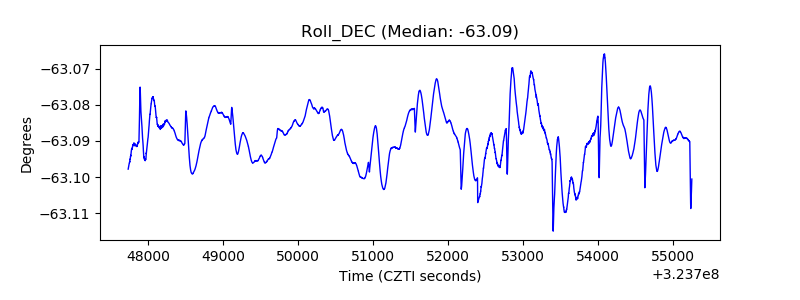 |
| _Roll_RA | 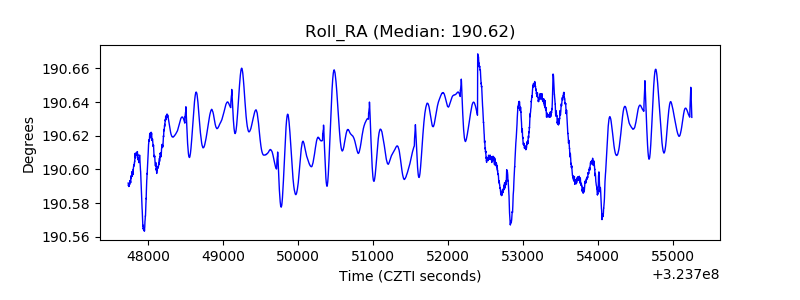 |
| Veto Counter | 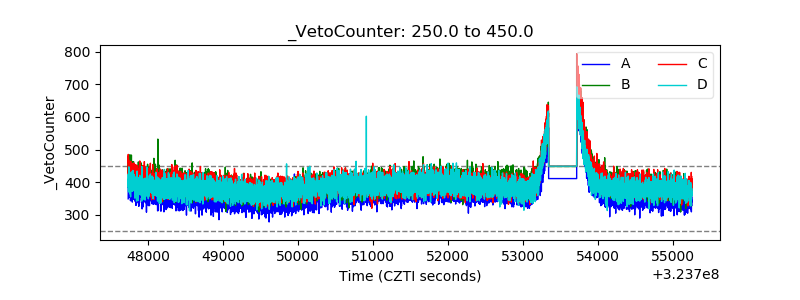 |