| Param | Original file | Final file |
|---|---|---|
| Filename | modeM0/AS1T03_183T01_9000003606_24439cztM0_level2.evt | modeM0/AS1T03_183T01_9000003606_24439cztM0_level2_quad_clean.evt |
| Size (bytes) | 529,822,080 | 103,936,320 |
| Size | 505.3 MB | 99.1 MB |
| Events in quadrant A | 3,249,870 | 678,555 |
| Events in quadrant B | 3,395,399 | 694,927 |
| Events in quadrant C | 3,640,589 | 656,577 |
| Events in quadrant D | 5,270,452 | 615,485 |
| Mode M0 | |||
|---|---|---|---|
| Quadrant | BADHDUFLAG | Total packets | Discarded packets |
| A | 0 | 14660 | 1 |
| B | 0 | 14867 | 1 |
| C | 0 | 15278 | 1 |
| D | 0 | 20367 | 1 |
| Mode SS | |||
|---|---|---|---|
| Quadrant | BADHDUFLAG | Total packets | Discarded packets |
| A | 0 | 146 | 0 |
| B | 0 | 146 | 0 |
| C | 0 | 146 | 0 |
| D | 0 | 146 | 0 |
| Mode M9 | |||
|---|---|---|---|
| Quadrant | BADHDUFLAG | Total packets | Discarded packets |
| A | 0 | 4 | 0 |
| B | 0 | 4 | 0 |
| C | 0 | 4 | 0 |
| D | 0 | 4 | 0 |
| Quadrant | Total seconds | Saturated seconds | Saturation percentage |
|---|---|---|---|
| A | 7208 | 75 | 1.040511% |
| B | 7209 | 97 | 1.345540% |
| C | 7209 | 104 | 1.442641% |
| D | 7209 | 522 | 7.240949% |
Noise dominated data is calculated using 1-second bins in cleaned event files. If a bin has >2000 counts, and if more than 50% of those come from <1% of pixels, then it is considered to be noise-dominated and hence unusable.
| Quadrant | # 1 sec bins | Bins with >0 counts | Bins with >2000 counts | High rate bins dominated by noise | Noise dominated (total time) | Noise dominated (detector-on time) | Marked lightcurve |
|---|---|---|---|---|---|---|---|
| A | 7603 | 7209 | 0 | 0 | 0.00% | 0.00% | 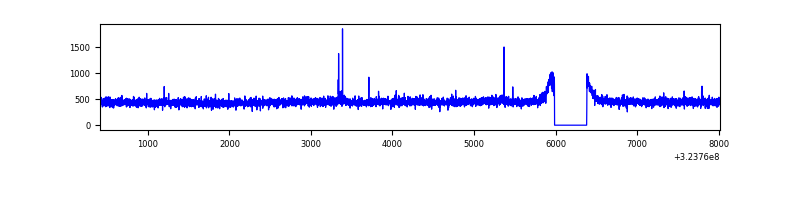 |
| B | 7604 | 7210 | 5 | 5 | 0.07% | 0.07% | 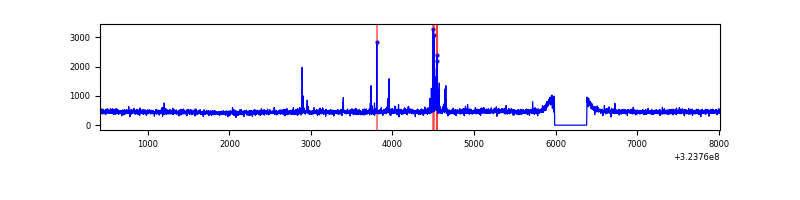 |
| C | 7604 | 7210 | 2 | 2 | 0.03% | 0.03% | 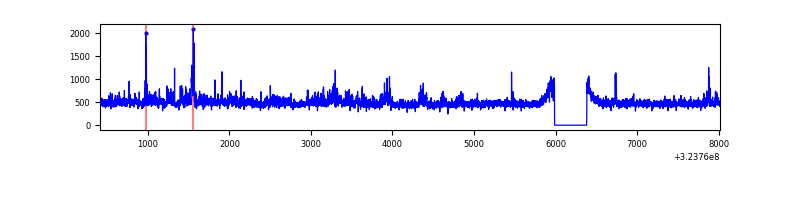 |
| D | 7604 | 7210 | 354 | 354 | 4.66% | 4.91% | 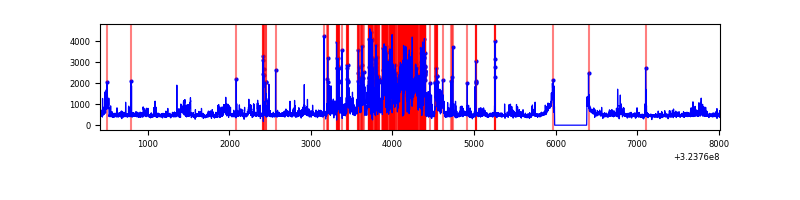 |
Top three noisy pixels from each quadrant. If the there are fewer than three noisy pixels in the level2.evt file, extra rows are filled as -1
| Pixel properties | Quadrant properties | ||||||
|---|---|---|---|---|---|---|---|
| Quadrant | DetID | PixID | Counts | Sigma | Mean | Median | Sigma |
| A | 4 | 2 | 14082 | 78.51 | 839 | 819 | 168.9 |
| A | 13 | 254 | 11568 | 63.63 | 839 | 819 | 168.9 |
| A | 3 | 137 | 7843 | 41.58 | 839 | 819 | 168.9 |
| B | 3 | 64 | 87532 | 541.04 | 841 | 818 | 160.3 |
| B | 12 | 111 | 19900 | 119.06 | 841 | 818 | 160.3 |
| B | 11 | 111 | 17776 | 105.81 | 841 | 818 | 160.3 |
| C | 10 | 9 | 266721 | 1391.21 | 816 | 820 | 191.1 |
| C | 14 | 238 | 129530 | 673.42 | 816 | 820 | 191.1 |
| C | 3 | 233 | 29470 | 149.9 | 816 | 820 | 191.1 |
| D | 10 | 199 | 890593 | 4595.16 | 799 | 774 | 193.6 |
| D | 1 | 52 | 685791 | 3537.53 | 799 | 774 | 193.6 |
| D | 12 | 218 | 337016 | 1736.4 | 799 | 774 | 193.6 |
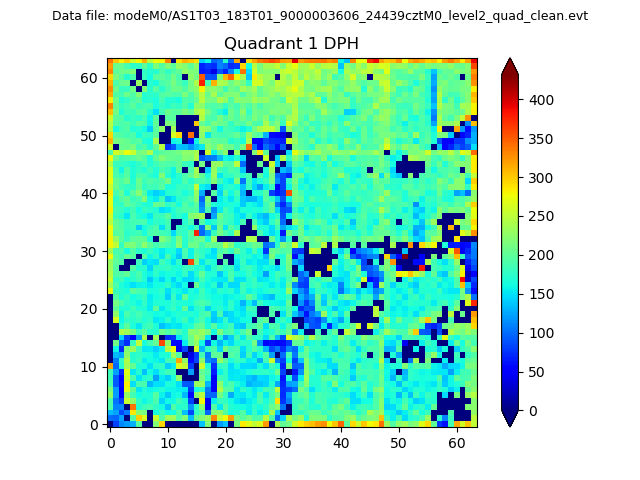
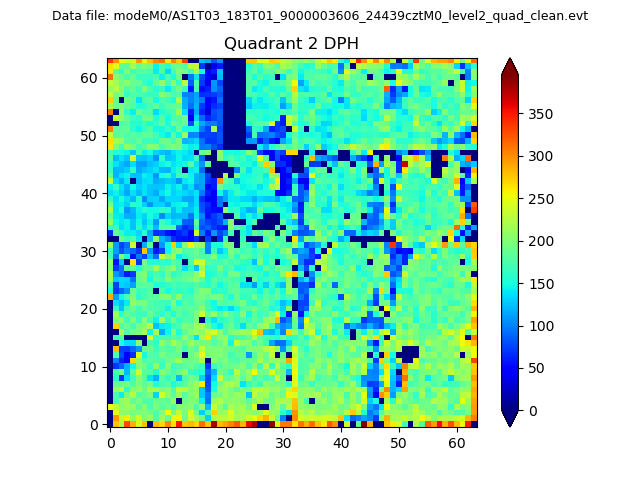
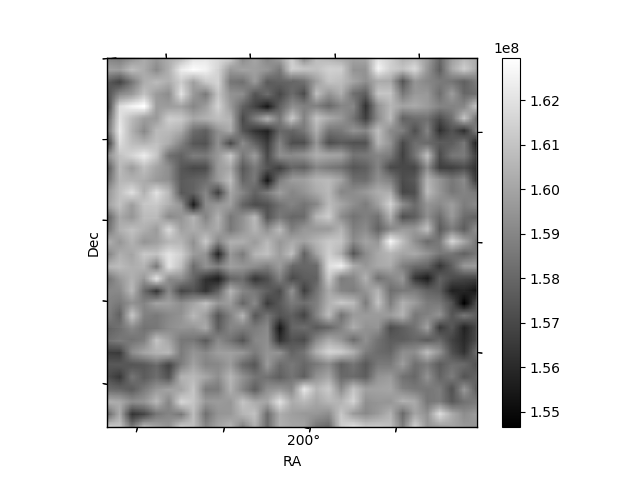
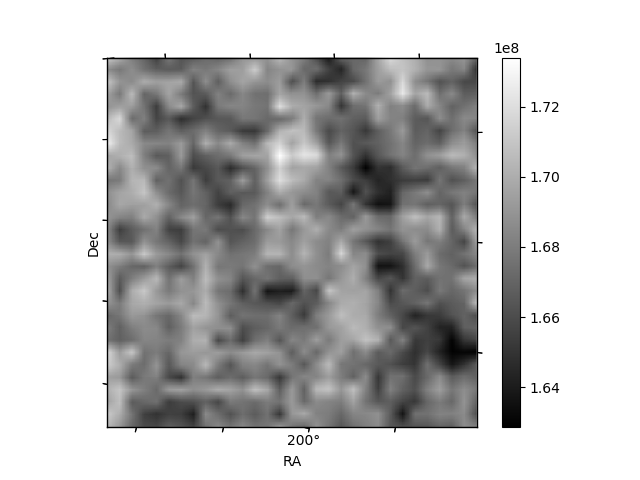
Histogram calculated using DETX and DETY for each event in the final _common_clean file
| Quadrant A |  |
 |
Quadrant B |
|---|---|---|---|
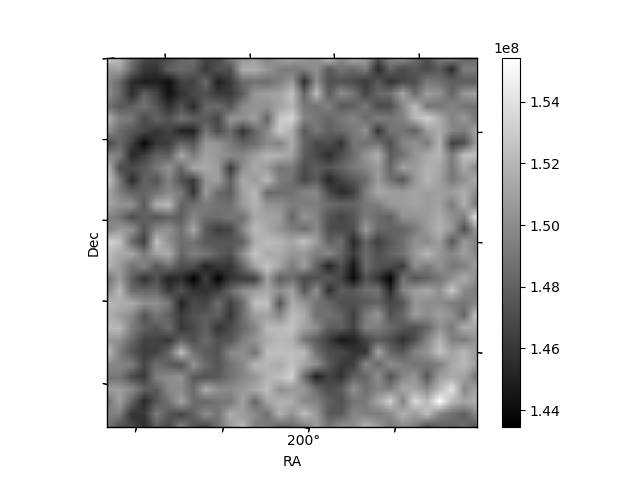
| Quadrant D |  |
 |
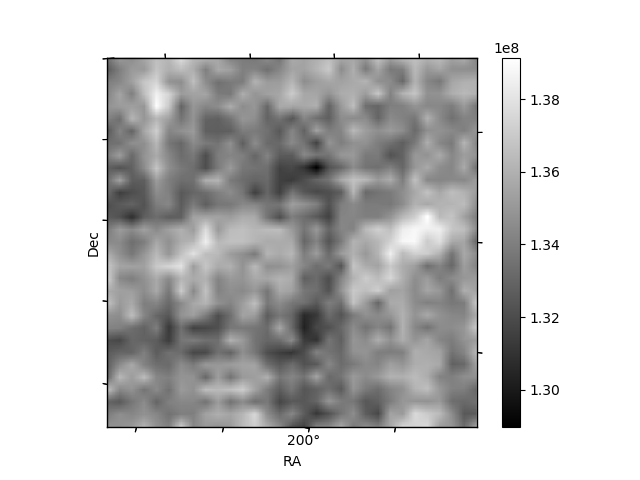
Quadrant C |
| Plot type | Count rate plots | Images |
|---|---|---|
| Comparison with Poisson distribution Blue bars denote a histogram of data divided into 1 sec bins. Red curve is a Poisson curve with rate = median count rate of data. |
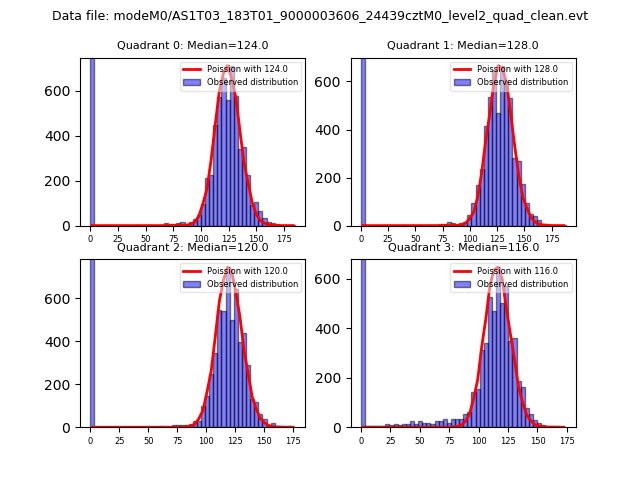 |
 |
| Quadrant-wise count rates Data is divided into 100 sec bins |
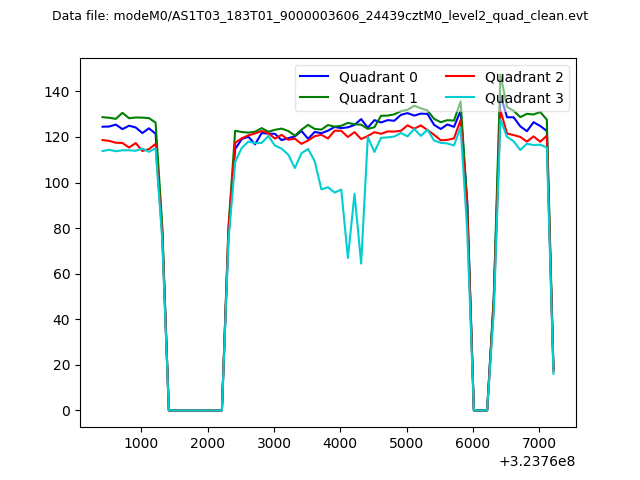 |
|
| Module-wise count rates for Quadrant A Data is divided into 100 sec bins |
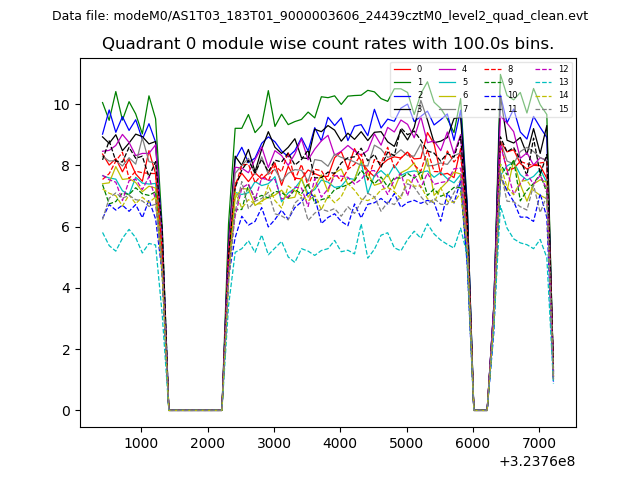 |
 |
| Module-wise count rates for Quadrant B Data is divided into 100 sec bins |
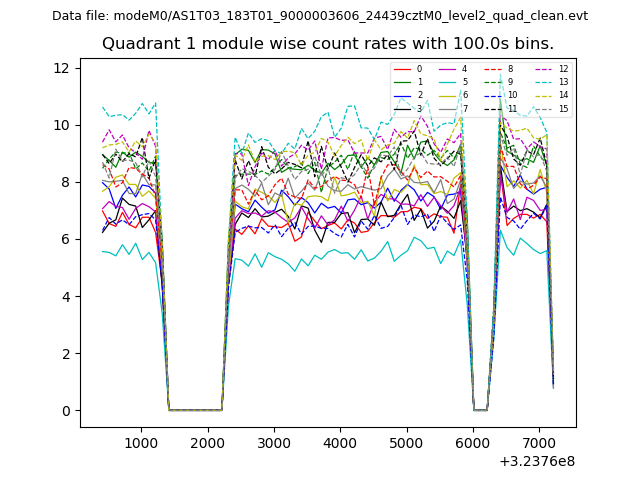 |
 |
| Module-wise count rates for Quadrant C Data is divided into 100 sec bins |
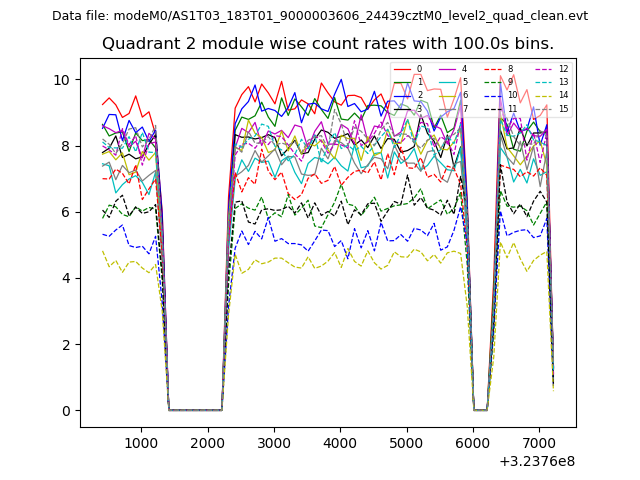 |
 |
| Module-wise count rates for Quadrant D Data is divided into 100 sec bins |
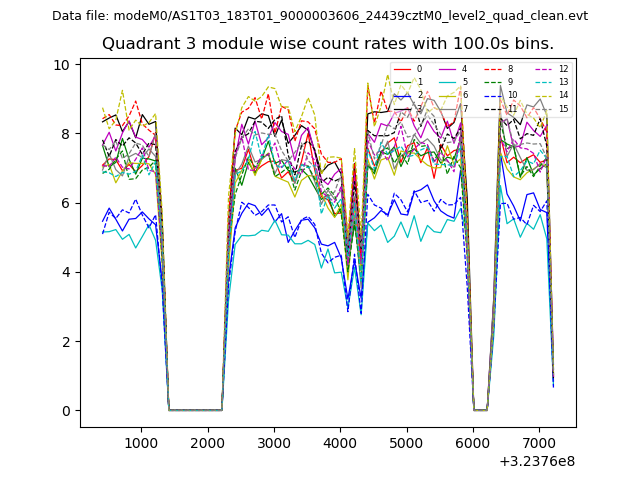 |
 |
| Parameter | Plot |
|---|---|
| CZT HV Monitor | 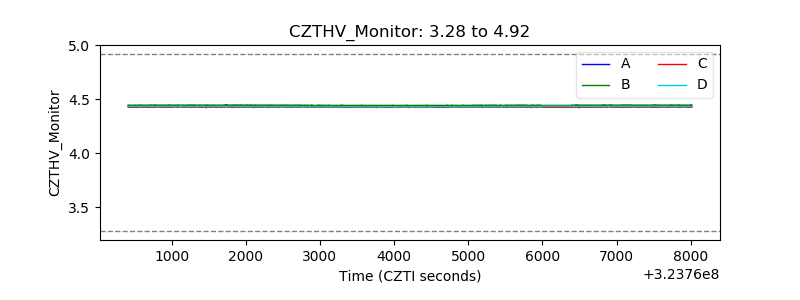 |
| D_VDD | 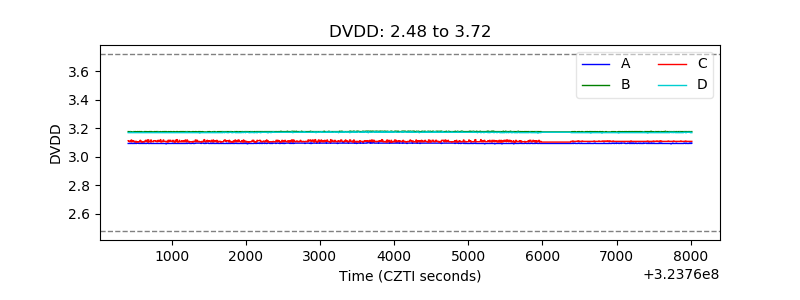 |
| Temperature 1 | 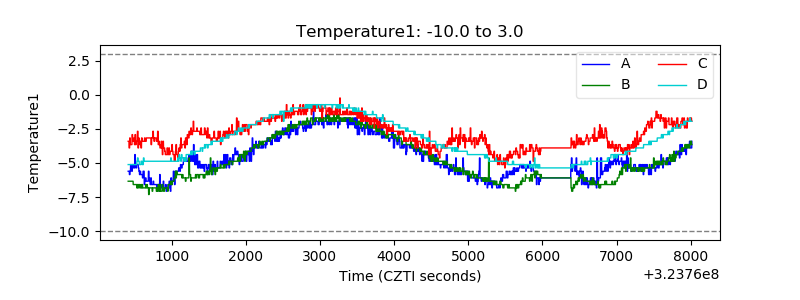 |
| Veto HV Monitor | 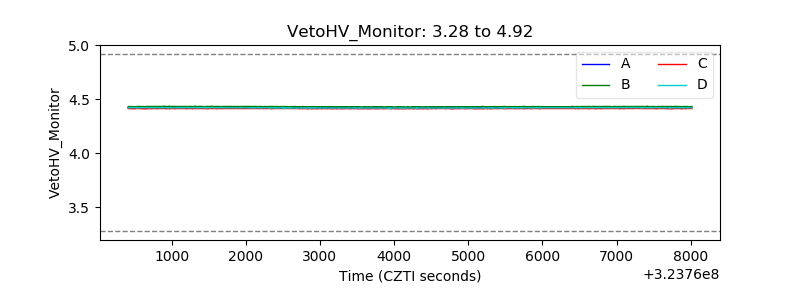 |
| Veto LLD | 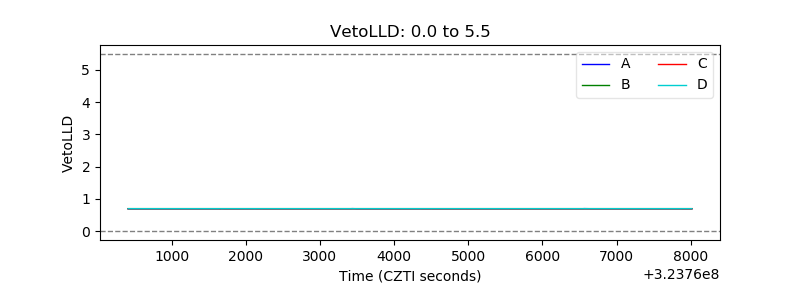 |
| Alpha Counter | 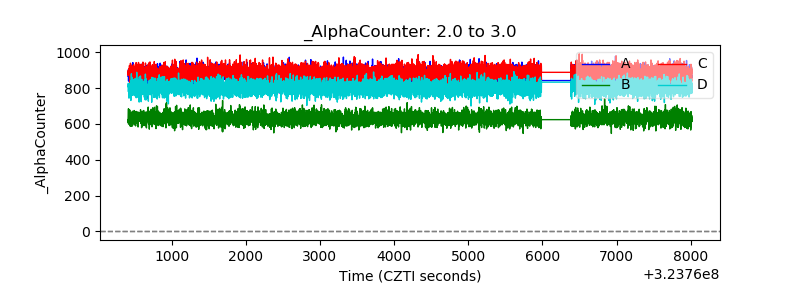 |
| _CPM_Rate | 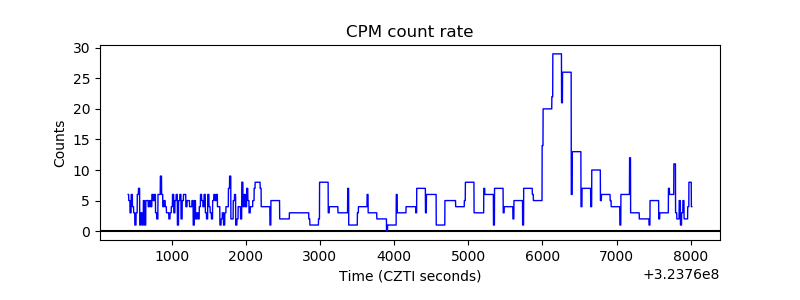 |
| CZT Counter |  |
| +2.5 Volts monitor |  |
| +5 Volts monitor | 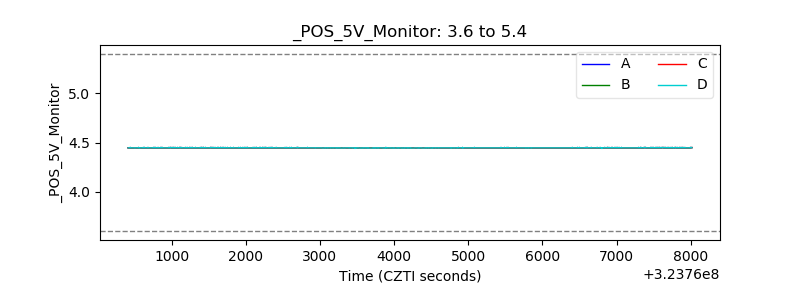 |
| _ROLL_ROT | 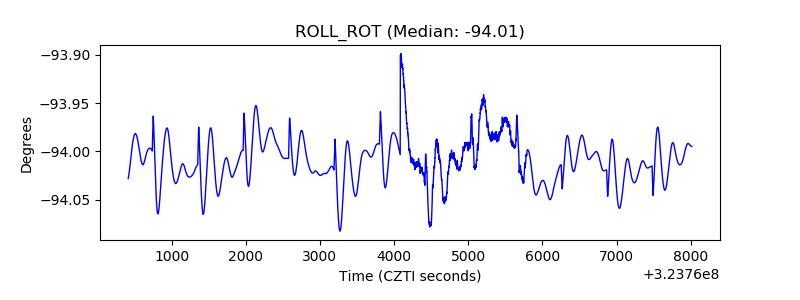 |
| _Roll_DEC | 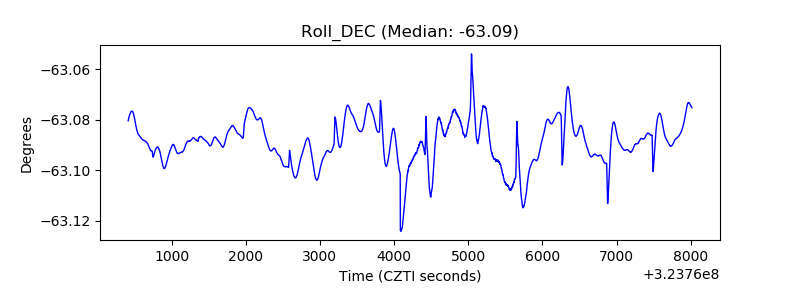 |
| _Roll_RA |  |
| Veto Counter | 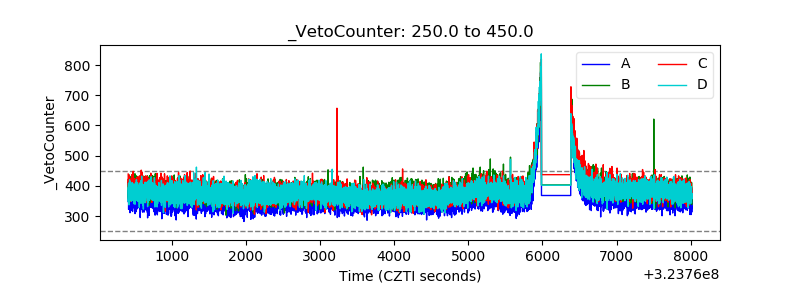 |