| Param | Original file | Final file |
|---|---|---|
| Filename | modeM0/AS1T03_183T01_9000003606_24443cztM0_level2.evt | modeM0/AS1T03_183T01_9000003606_24443cztM0_level2_quad_clean.evt |
| Size (bytes) | 1,633,487,040 | 375,480,000 |
| Size | 1.5 GB | 358.1 MB |
| Events in quadrant A | 10,709,377 | 2,494,754 |
| Events in quadrant B | 11,253,364 | 2,533,680 |
| Events in quadrant C | 11,156,467 | 2,431,990 |
| Events in quadrant D | 14,808,161 | 2,340,872 |
| Mode M0 | |||
|---|---|---|---|
| Quadrant | BADHDUFLAG | Total packets | Discarded packets |
| A | 0 | 47331 | 4 |
| B | 0 | 48289 | 5 |
| C | 0 | 48190 | 4 |
| D | 0 | 59110 | 4 |
| Mode SS | |||
|---|---|---|---|
| Quadrant | BADHDUFLAG | Total packets | Discarded packets |
| A | 0 | 462 | 0 |
| B | 0 | 462 | 0 |
| C | 0 | 462 | 0 |
| D | 0 | 462 | 0 |
| Mode M9 | |||
|---|---|---|---|
| Quadrant | BADHDUFLAG | Total packets | Discarded packets |
| A | 0 | 33 | 0 |
| B | 0 | 33 | 0 |
| C | 0 | 33 | 0 |
| D | 0 | 33 | 0 |
| Quadrant | Total seconds | Saturated seconds | Saturation percentage |
|---|---|---|---|
| A | 22853 | 247 | 1.080821% |
| B | 22853 | 320 | 1.400254% |
| C | 22853 | 369 | 1.614668% |
| D | 22853 | 852 | 3.728176% |
Noise dominated data is calculated using 1-second bins in cleaned event files. If a bin has >2000 counts, and if more than 50% of those come from <1% of pixels, then it is considered to be noise-dominated and hence unusable.
| Quadrant | # 1 sec bins | Bins with >0 counts | Bins with >2000 counts | High rate bins dominated by noise | Noise dominated (total time) | Noise dominated (detector-on time) | Marked lightcurve |
|---|---|---|---|---|---|---|---|
| A | 26018 | 22857 | 13 | 13 | 0.05% | 0.06% | 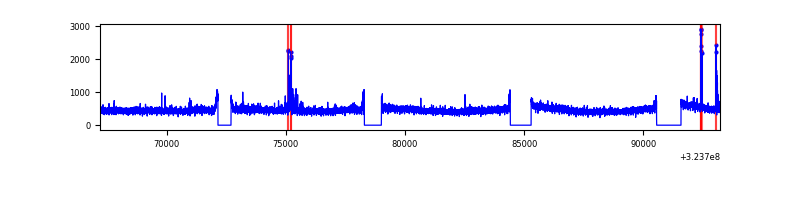 |
| B | 26018 | 22857 | 38 | 38 | 0.15% | 0.17% | 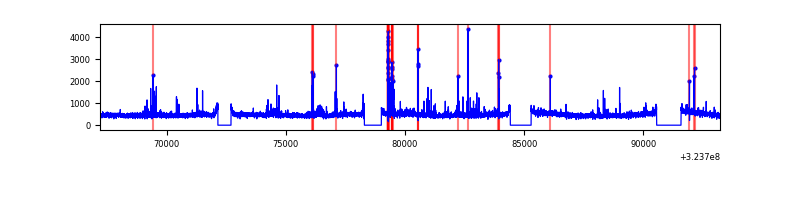 |
| C | 26018 | 22856 | 19 | 19 | 0.07% | 0.08% | 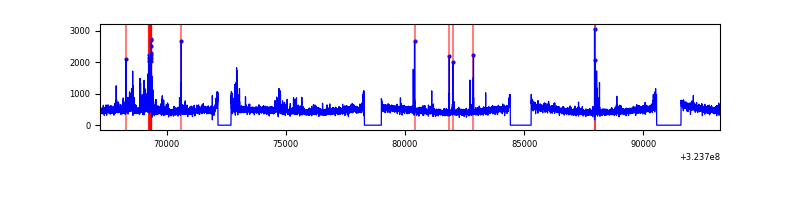 |
| D | 26018 | 22857 | 509 | 509 | 1.96% | 2.23% | 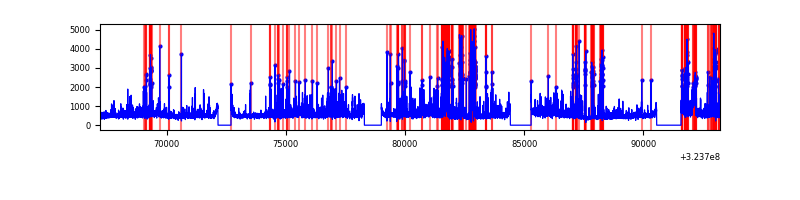 |
Top three noisy pixels from each quadrant. If the there are fewer than three noisy pixels in the level2.evt file, extra rows are filled as -1
| Pixel properties | Quadrant properties | ||||||
|---|---|---|---|---|---|---|---|
| Quadrant | DetID | PixID | Counts | Sigma | Mean | Median | Sigma |
| A | 4 | 2 | 195813 | 354.13 | 2727 | 2668 | 545.4 |
| A | 13 | 254 | 37280 | 63.46 | 2727 | 2668 | 545.4 |
| A | 3 | 137 | 24732 | 40.45 | 2727 | 2668 | 545.4 |
| B | 3 | 64 | 377699 | 732.82 | 2718 | 2648 | 511.8 |
| B | 4 | 81 | 124424 | 237.94 | 2718 | 2648 | 511.8 |
| B | 12 | 111 | 63369 | 118.64 | 2718 | 2648 | 511.8 |
| C | 14 | 238 | 416336 | 684.81 | 2613 | 2632 | 604.1 |
| C | 10 | 9 | 408976 | 672.63 | 2613 | 2632 | 604.1 |
| C | 2 | 16 | 124474 | 201.69 | 2613 | 2632 | 604.1 |
| D | 1 | 52 | 2448299 | 3846.04 | 2626 | 2545 | 635.9 |
| D | 12 | 218 | 1202736 | 1887.35 | 2626 | 2545 | 635.9 |
| D | 8 | 195 | 891763 | 1398.33 | 2626 | 2545 | 635.9 |
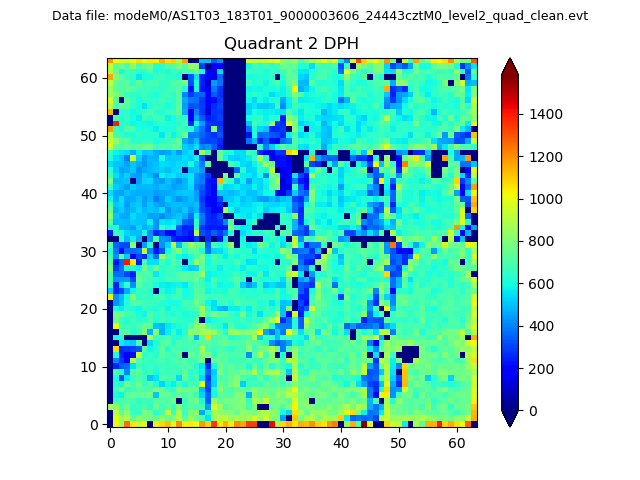
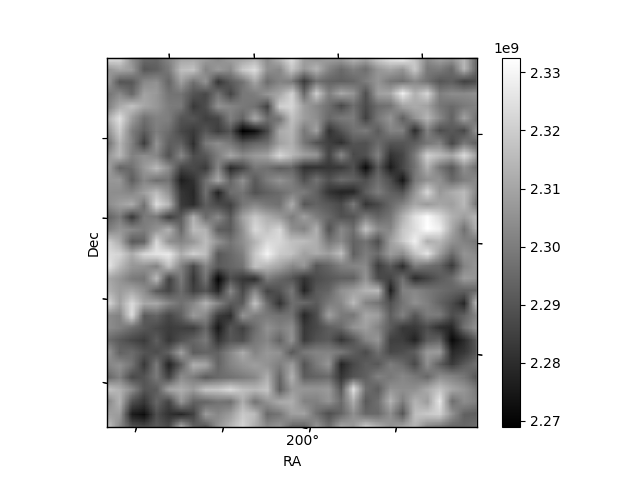
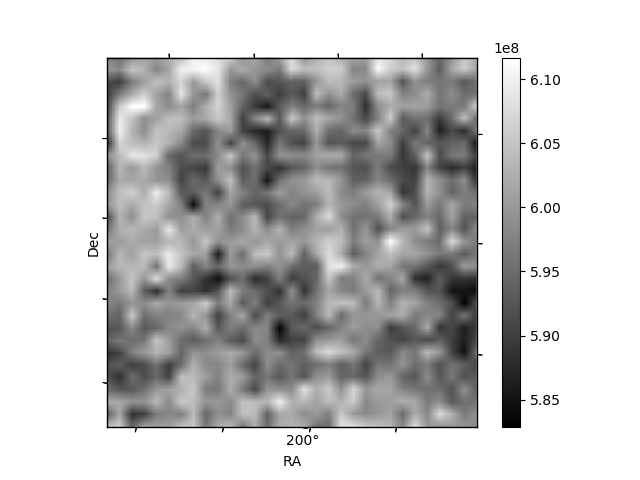
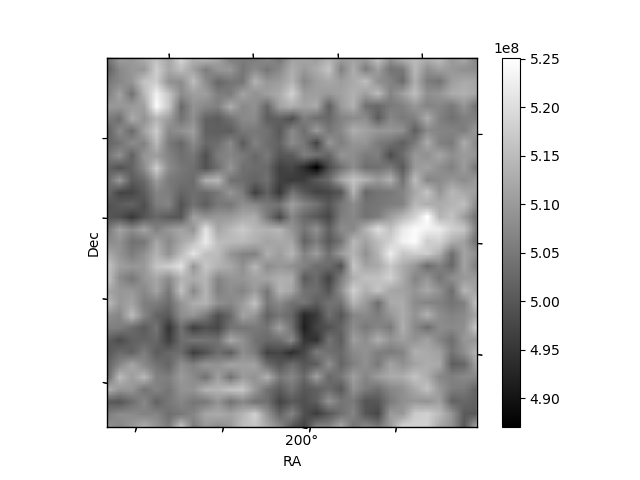
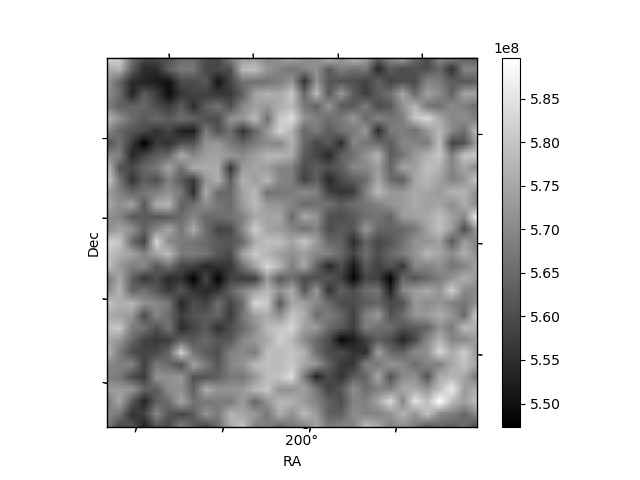
Histogram calculated using DETX and DETY for each event in the final _common_clean file
| Quadrant A | 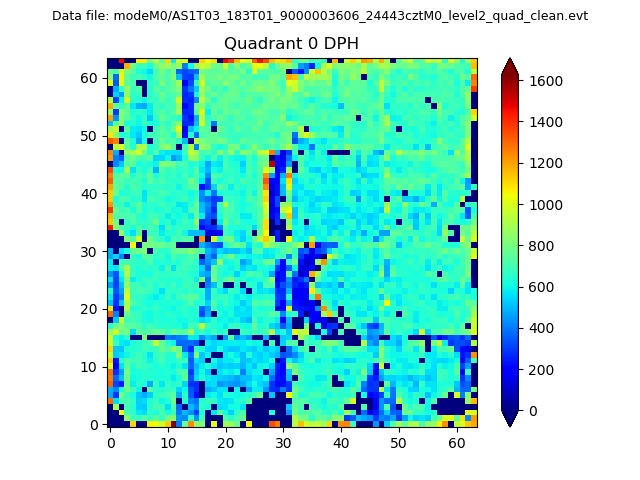 |
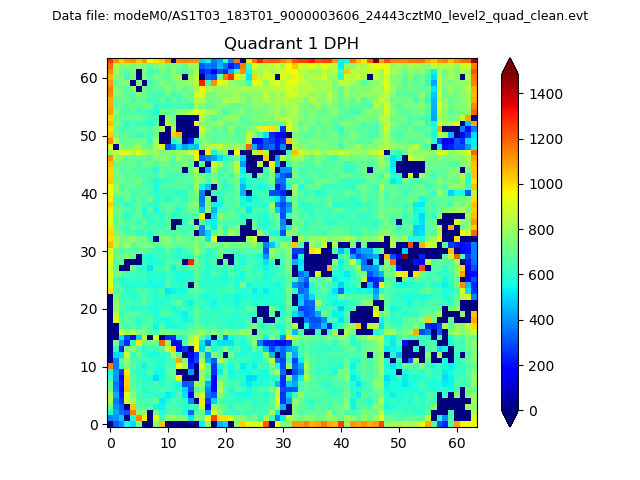 |
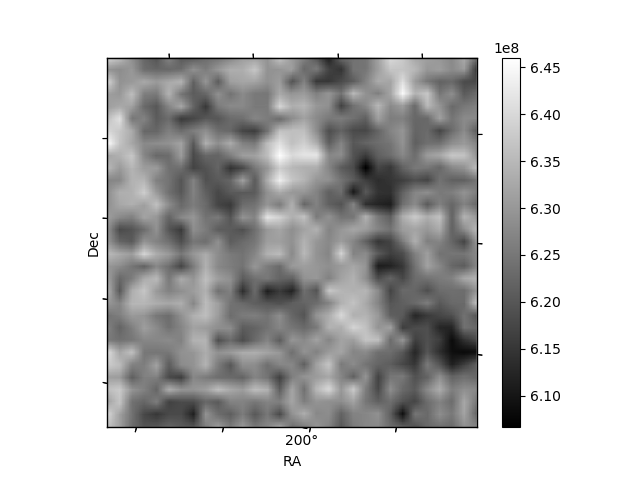
Quadrant B |
|---|---|---|---|
| Quadrant D | 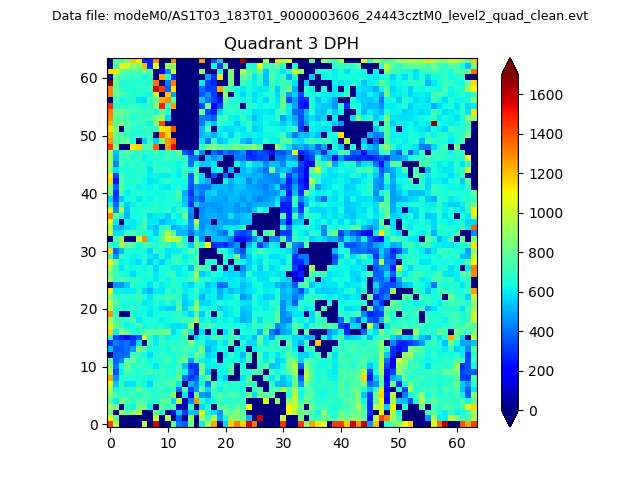 |
 |
Quadrant C |
| Plot type | Count rate plots | Images |
|---|---|---|
| Comparison with Poisson distribution Blue bars denote a histogram of data divided into 1 sec bins. Red curve is a Poisson curve with rate = median count rate of data. |
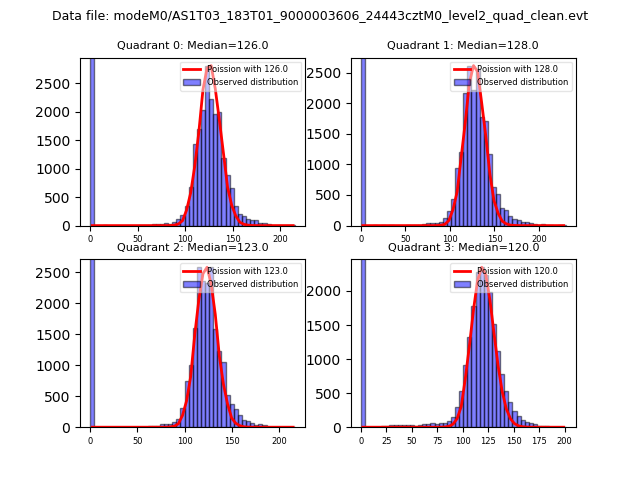 |
 |
| Quadrant-wise count rates Data is divided into 100 sec bins |
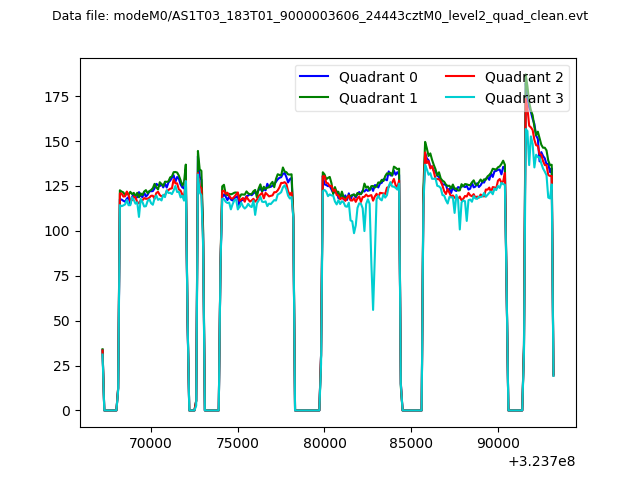 |
|
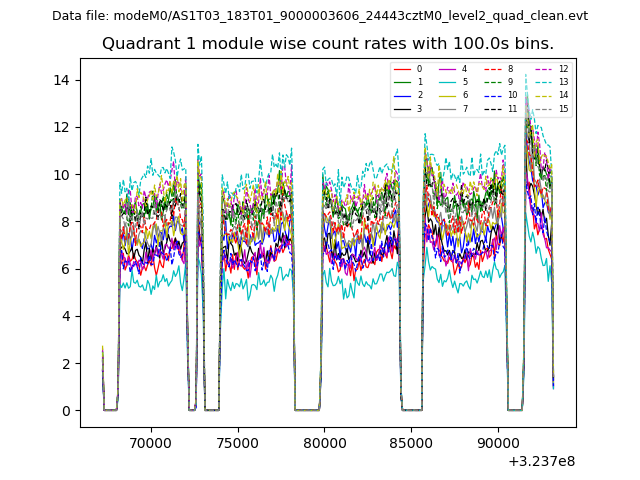
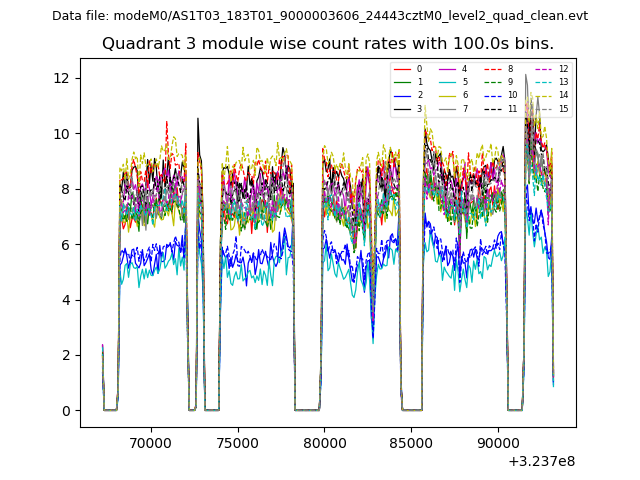
| Module-wise count rates for Quadrant A Data is divided into 100 sec bins |
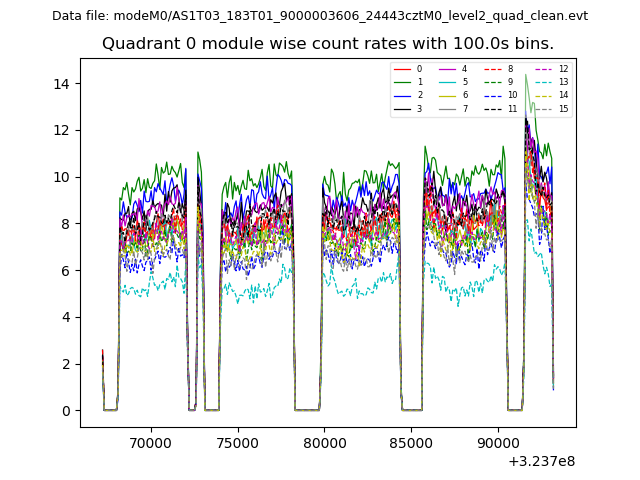 |
 |
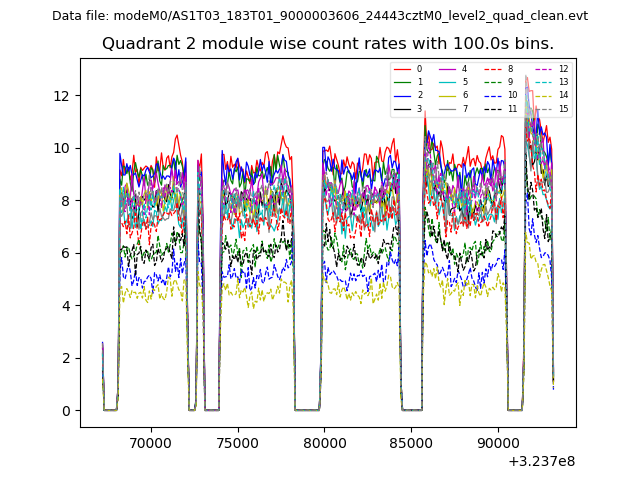
| Module-wise count rates for Quadrant B Data is divided into 100 sec bins |
 |
 |
| Module-wise count rates for Quadrant C Data is divided into 100 sec bins |
 |
 |
| Module-wise count rates for Quadrant D Data is divided into 100 sec bins |
 |
 |
| Parameter | Plot |
|---|---|
| CZT HV Monitor | 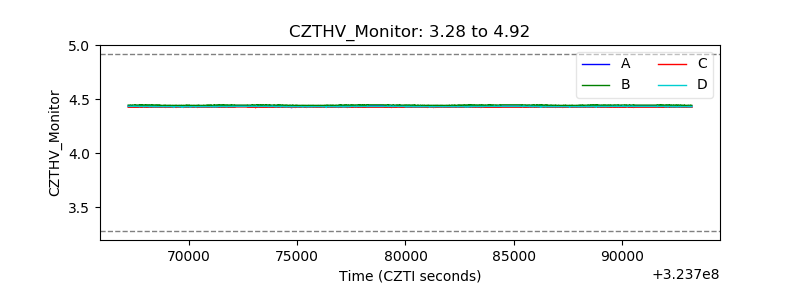 |
| D_VDD | 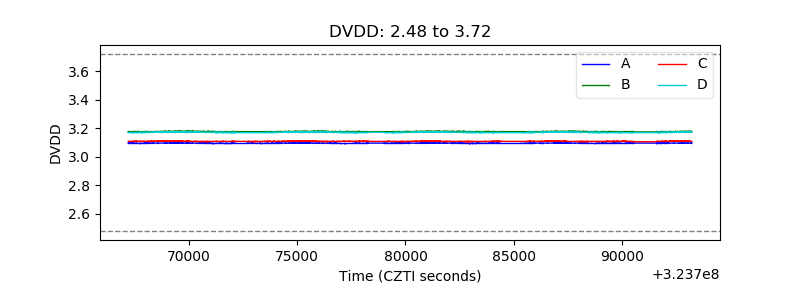 |
| Temperature 1 |  |
| Veto HV Monitor | 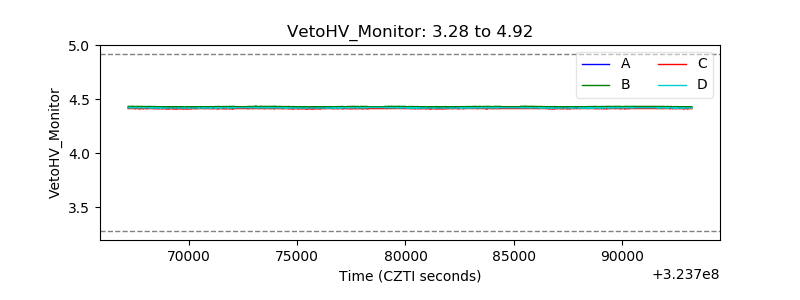 |
| Veto LLD | 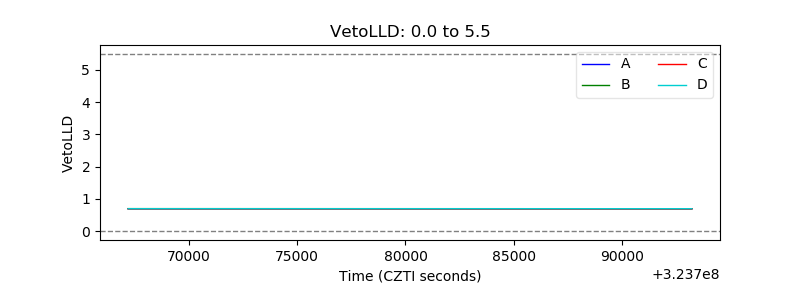 |
| Alpha Counter | 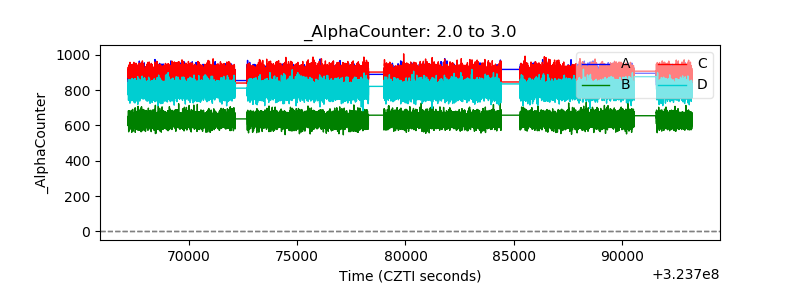 |
| _CPM_Rate | 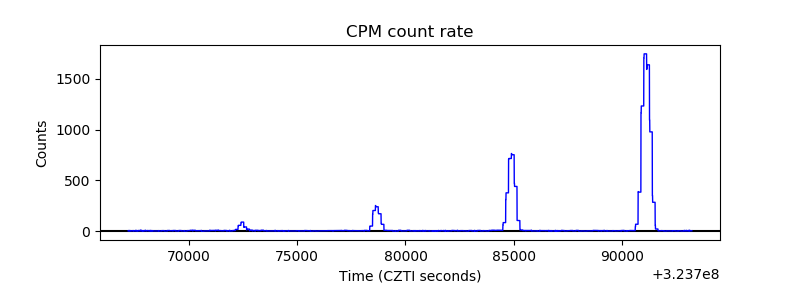 |
| CZT Counter | 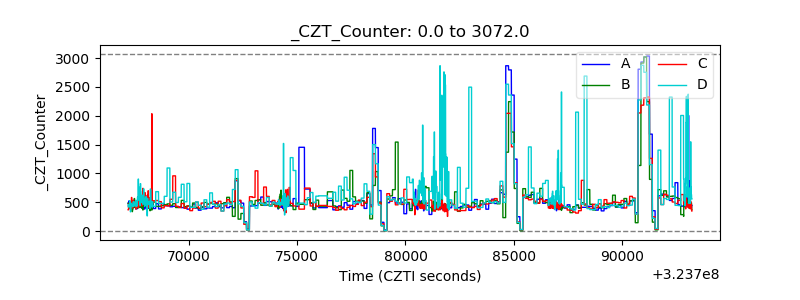 |
| +2.5 Volts monitor |  |
| +5 Volts monitor |  |
| _ROLL_ROT |  |
| _Roll_DEC |  |
| _Roll_RA | 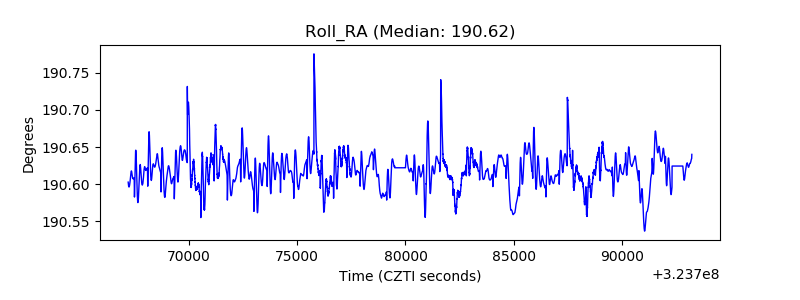 |
| Veto Counter | 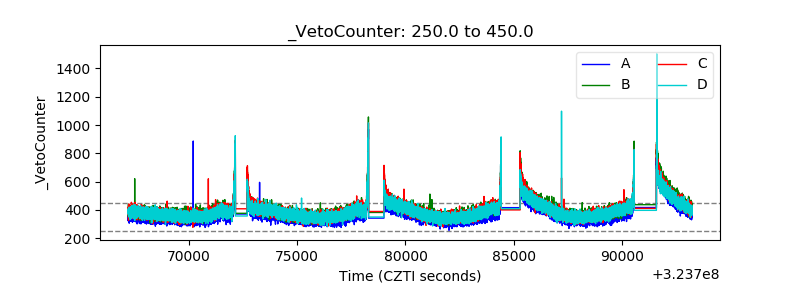 |