| Param | Original file | Final file |
|---|---|---|
| Filename | modeM0/AS1T03_183T01_9000003606_24447cztM0_level2.evt | modeM0/AS1T03_183T01_9000003606_24447cztM0_level2_quad_clean.evt |
| Size (bytes) | 458,951,040 | 119,609,280 |
| Size | 437.7 MB | 114.1 MB |
| Events in quadrant A | 3,149,393 | 819,092 |
| Events in quadrant B | 3,375,758 | 843,321 |
| Events in quadrant C | 3,223,434 | 778,935 |
| Events in quadrant D | 3,727,066 | 745,817 |
| Mode M0 | |||
|---|---|---|---|
| Quadrant | BADHDUFLAG | Total packets | Discarded packets |
| A | 0 | 13356 | 2 |
| B | 0 | 14059 | 2 |
| C | 0 | 13554 | 2 |
| D | 0 | 15256 | 2 |
| Mode SS | |||
|---|---|---|---|
| Quadrant | BADHDUFLAG | Total packets | Discarded packets |
| A | 0 | 126 | 0 |
| B | 0 | 126 | 0 |
| C | 0 | 126 | 0 |
| D | 0 | 126 | 0 |
| Mode M9 | |||
|---|---|---|---|
| Quadrant | BADHDUFLAG | Total packets | Discarded packets |
| A | 0 | 17 | 0 |
| B | 0 | 18 | 0 |
| C | 0 | 18 | 0 |
| D | 0 | 18 | 0 |
| Quadrant | Total seconds | Saturated seconds | Saturation percentage |
|---|---|---|---|
| A | 6245 | 58 | 0.928743% |
| B | 6244 | 97 | 1.553491% |
| C | 6244 | 89 | 1.425368% |
| D | 6244 | 62 | 0.992953% |
Noise dominated data is calculated using 1-second bins in cleaned event files. If a bin has >2000 counts, and if more than 50% of those come from <1% of pixels, then it is considered to be noise-dominated and hence unusable.
| Quadrant | # 1 sec bins | Bins with >0 counts | Bins with >2000 counts | High rate bins dominated by noise | Noise dominated (total time) | Noise dominated (detector-on time) | Marked lightcurve |
|---|---|---|---|---|---|---|---|
| A | 7520 | 6246 | 0 | 0 | 0.00% | 0.00% | 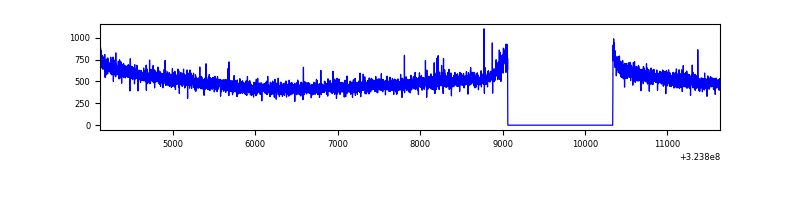 |
| B | 7519 | 6245 | 17 | 17 | 0.23% | 0.27% | 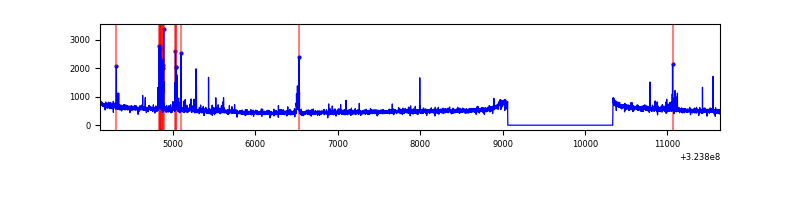 |
| C | 7519 | 6245 | 1 | 1 | 0.01% | 0.02% | 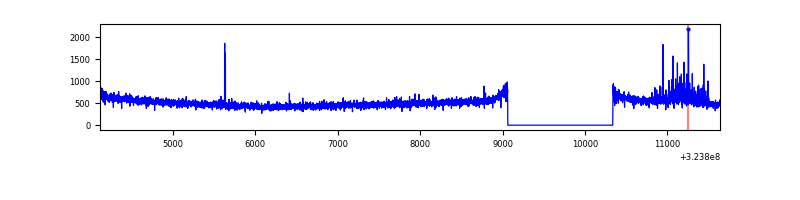 |
| D | 7519 | 6245 | 31 | 31 | 0.41% | 0.50% | 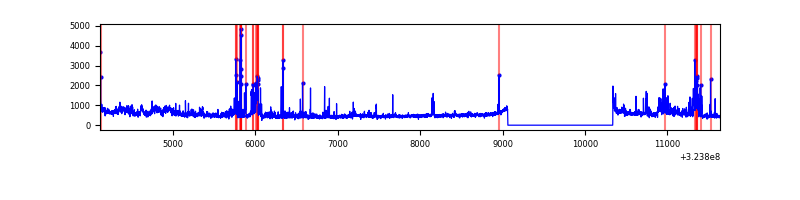 |
Top three noisy pixels from each quadrant. If the there are fewer than three noisy pixels in the level2.evt file, extra rows are filled as -1
| Pixel properties | Quadrant properties | ||||||
|---|---|---|---|---|---|---|---|
| Quadrant | DetID | PixID | Counts | Sigma | Mean | Median | Sigma |
| A | 13 | 254 | 10518 | 59.65 | 814 | 802 | 162.9 |
| A | 4 | 2 | 9467 | 53.2 | 814 | 802 | 162.9 |
| A | 0 | 226 | 7031 | 38.24 | 814 | 802 | 162.9 |
| B | 3 | 64 | 177112 | 1155.29 | 816 | 796 | 152.6 |
| B | 12 | 111 | 17530 | 109.64 | 816 | 796 | 152.6 |
| B | 11 | 111 | 15300 | 95.03 | 816 | 796 | 152.6 |
| C | 14 | 238 | 126104 | 707.66 | 770 | 776 | 177.1 |
| C | 2 | 16 | 73012 | 407.88 | 770 | 776 | 177.1 |
| C | 3 | 233 | 21325 | 116.03 | 770 | 776 | 177.1 |
| D | 1 | 52 | 375255 | 2037.23 | 771 | 749 | 183.8 |
| D | 12 | 218 | 278074 | 1508.58 | 771 | 749 | 183.8 |
| D | 8 | 195 | 105376 | 569.15 | 771 | 749 | 183.8 |
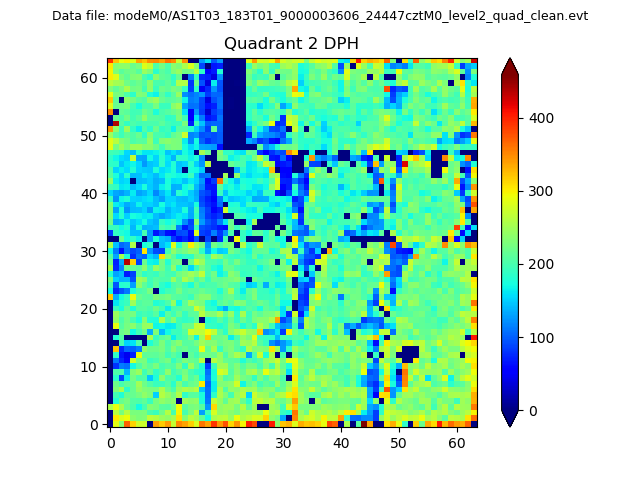
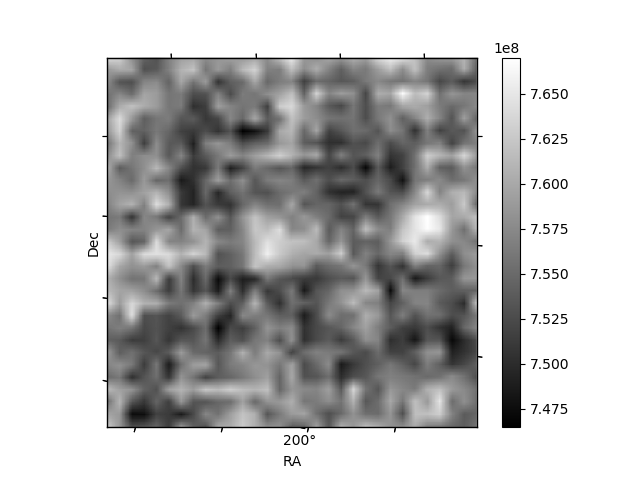
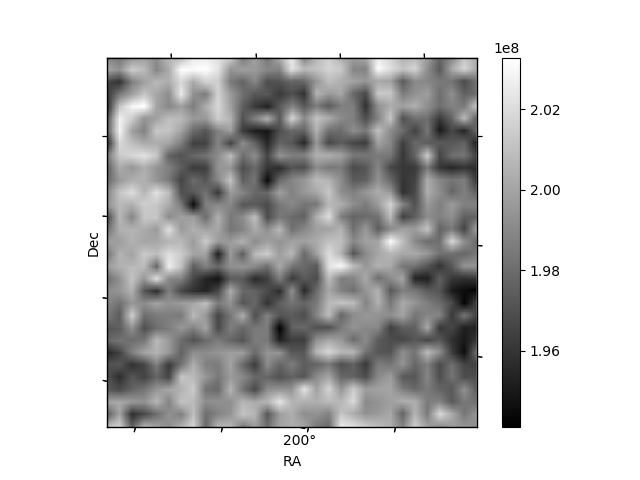
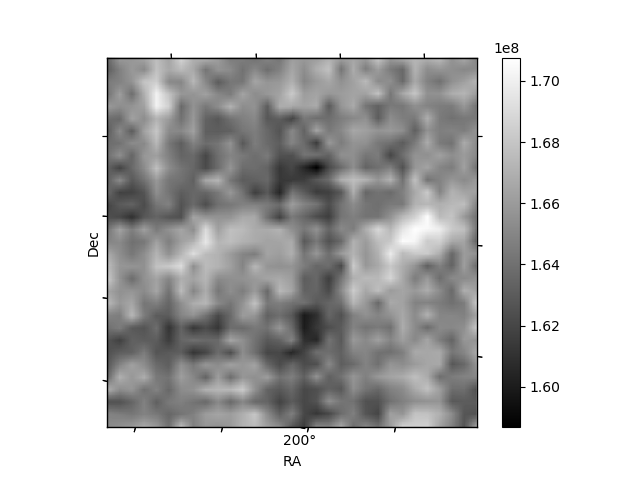
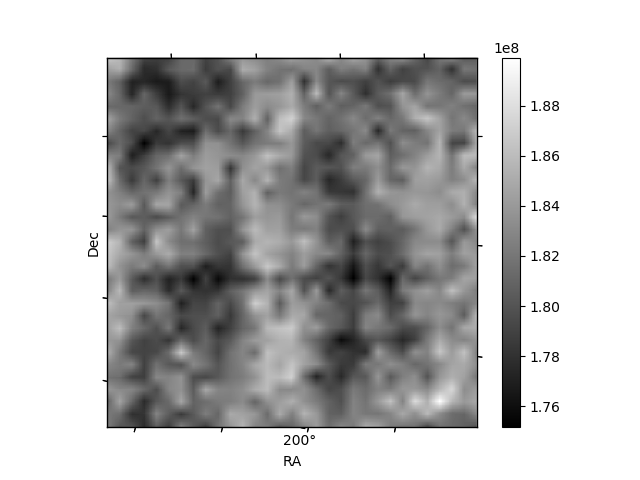
Histogram calculated using DETX and DETY for each event in the final _common_clean file
| Quadrant A | 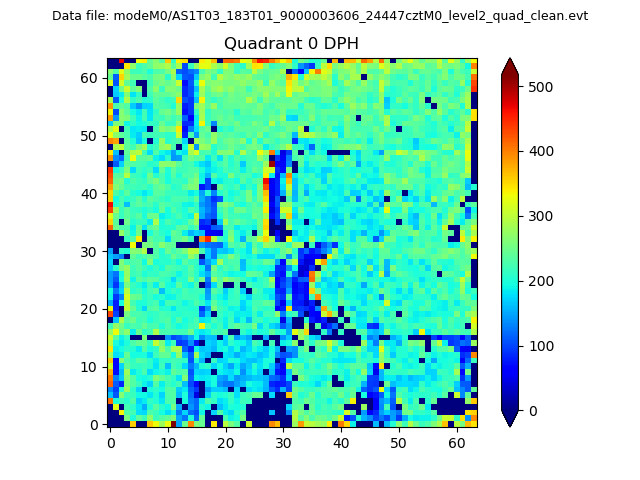 |
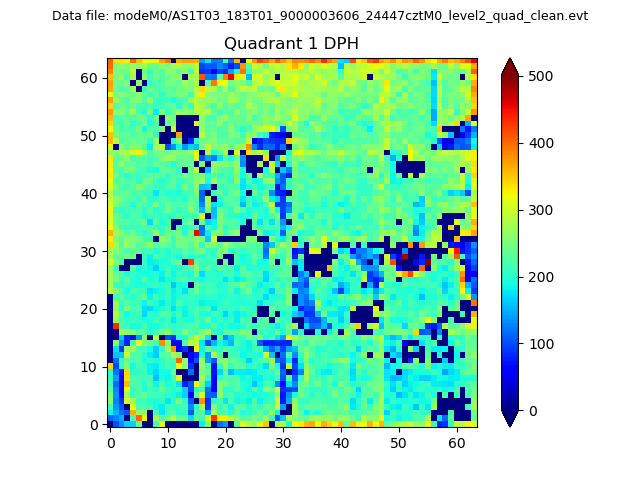 |
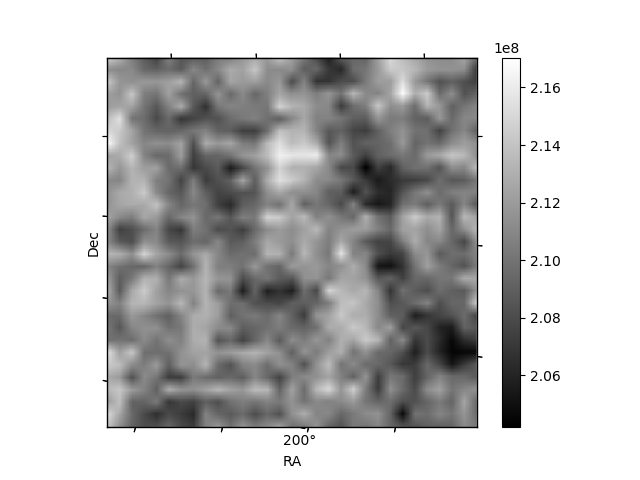
Quadrant B |
|---|---|---|---|
| Quadrant D | 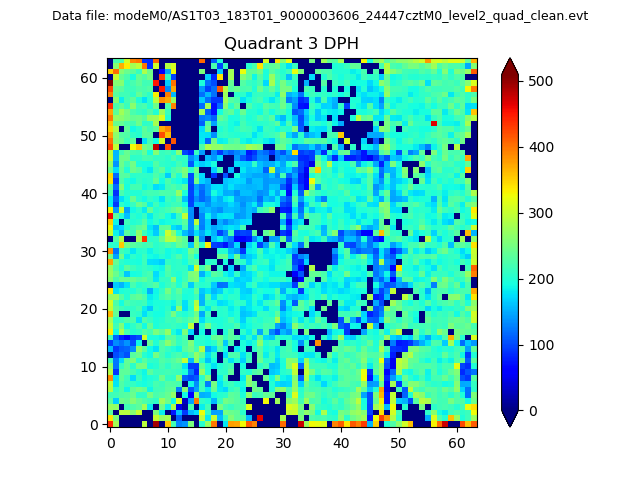 |
 |
Quadrant C |
| Plot type | Count rate plots | Images |
|---|---|---|
| Comparison with Poisson distribution Blue bars denote a histogram of data divided into 1 sec bins. Red curve is a Poisson curve with rate = median count rate of data. |
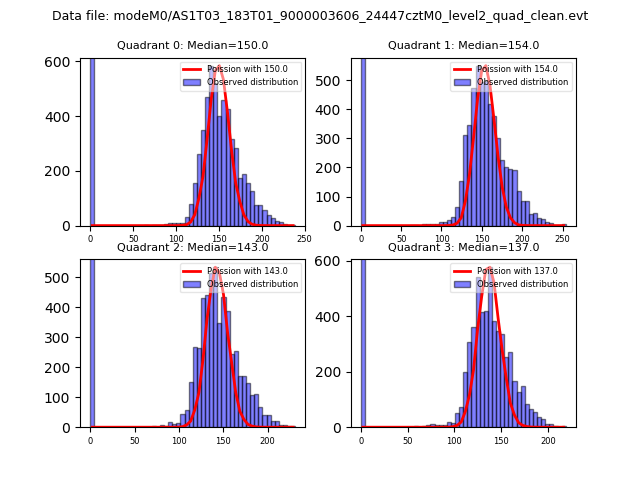 |
 |
| Quadrant-wise count rates Data is divided into 100 sec bins |
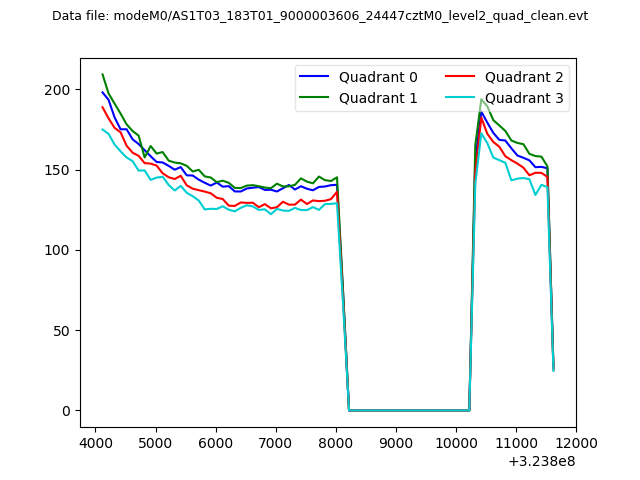 |
|
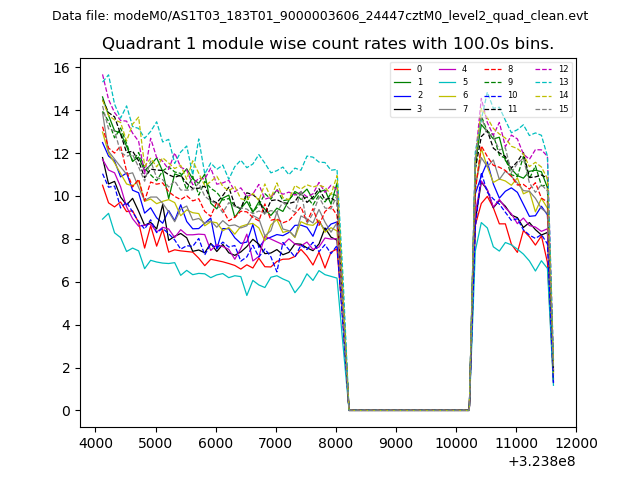
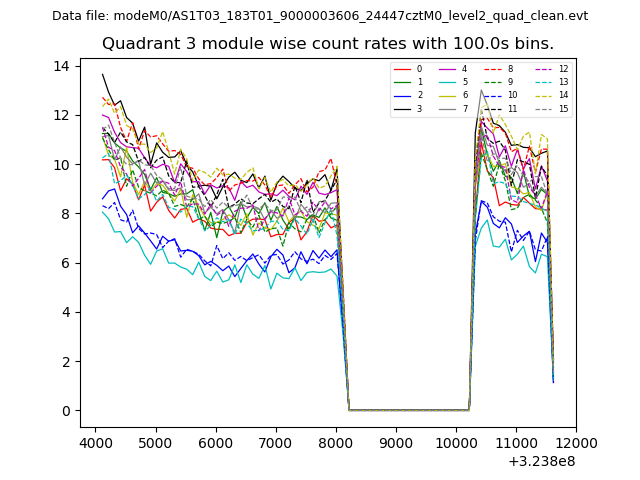
| Module-wise count rates for Quadrant A Data is divided into 100 sec bins |
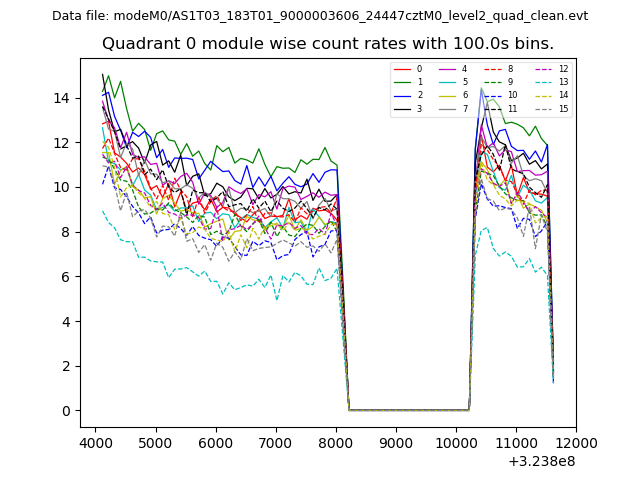 |
 |
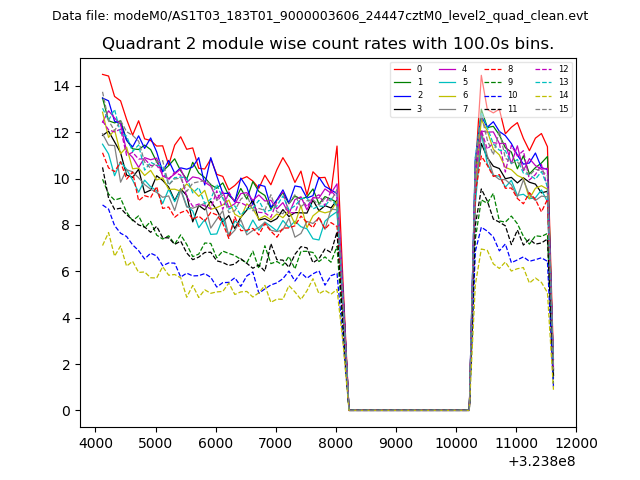
| Module-wise count rates for Quadrant B Data is divided into 100 sec bins |
 |
 |
| Module-wise count rates for Quadrant C Data is divided into 100 sec bins |
 |
 |
| Module-wise count rates for Quadrant D Data is divided into 100 sec bins |
 |
 |
| Parameter | Plot |
|---|---|
| CZT HV Monitor | 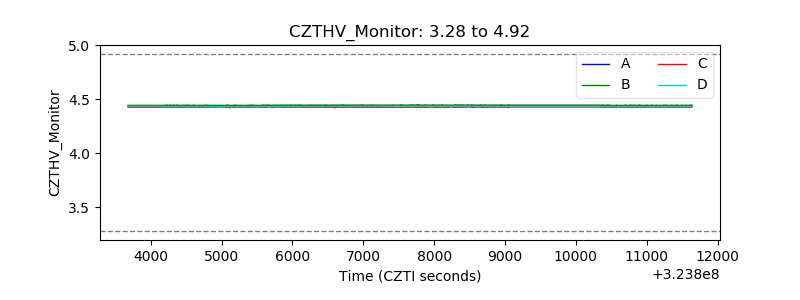 |
| D_VDD | 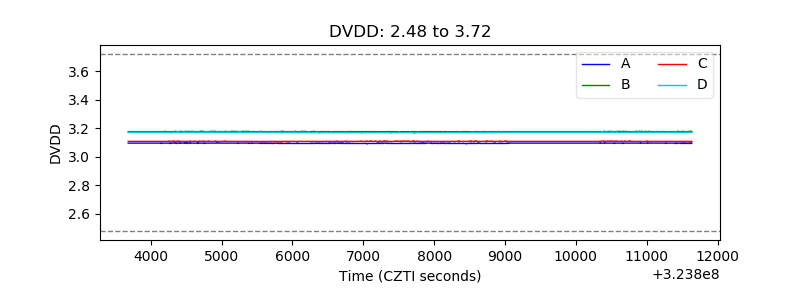 |
| Temperature 1 | 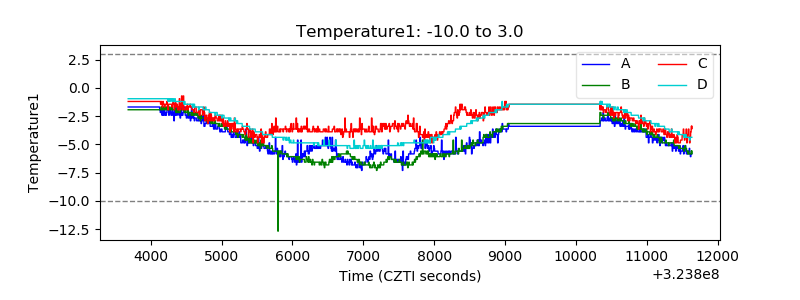 |
| Veto HV Monitor | 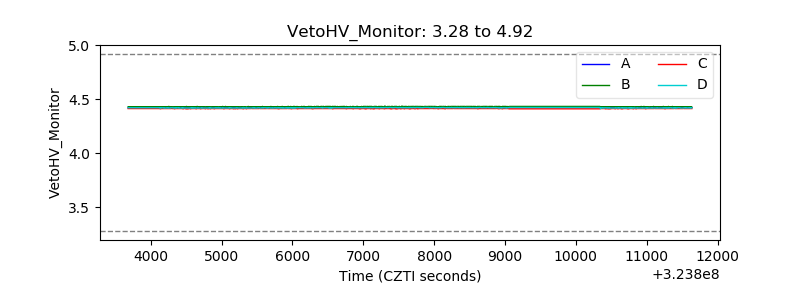 |
| Veto LLD | 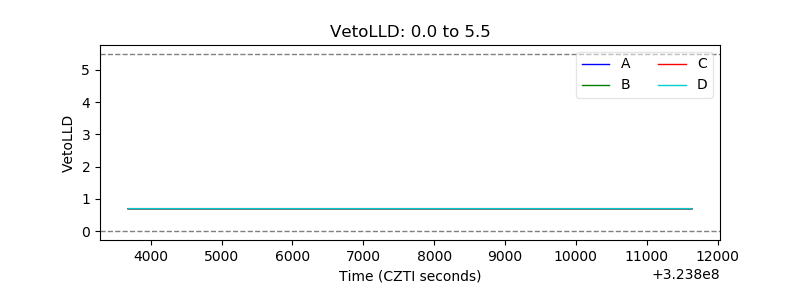 |
| Alpha Counter | 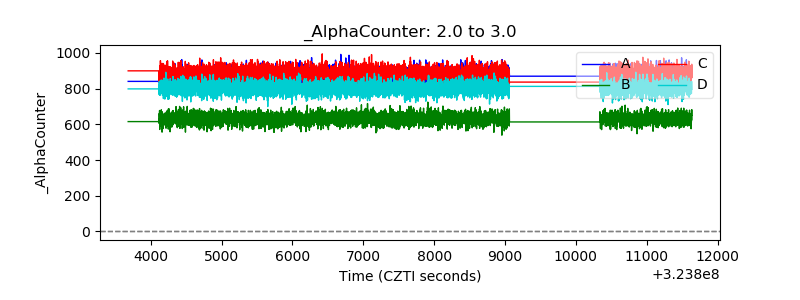 |
| _CPM_Rate | 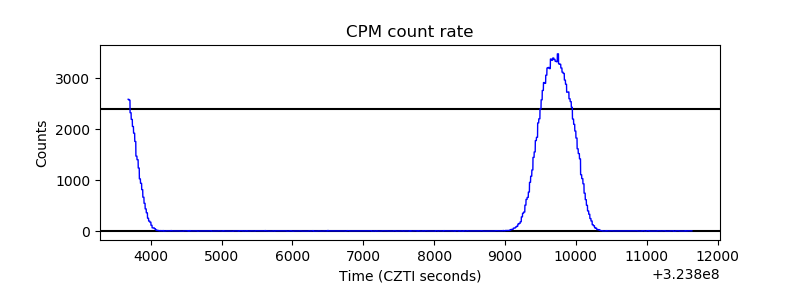 |
| CZT Counter | 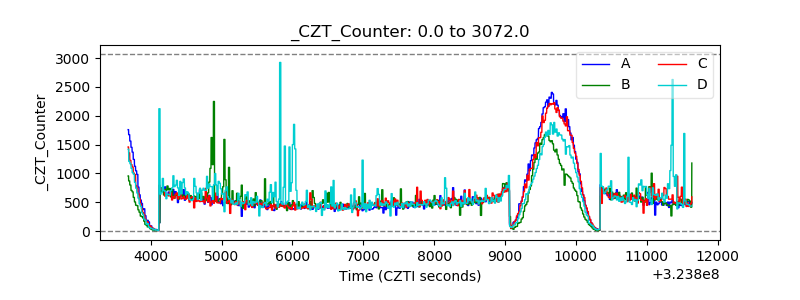 |
| +2.5 Volts monitor |  |
| +5 Volts monitor |  |
| _ROLL_ROT | 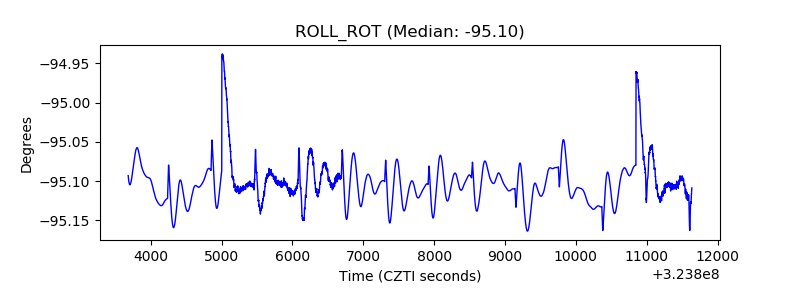 |
| _Roll_DEC | 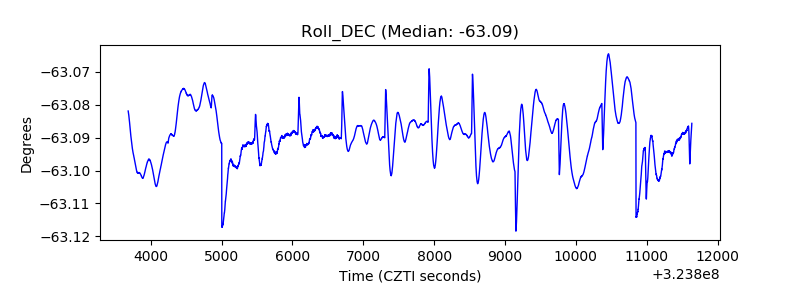 |
| _Roll_RA | 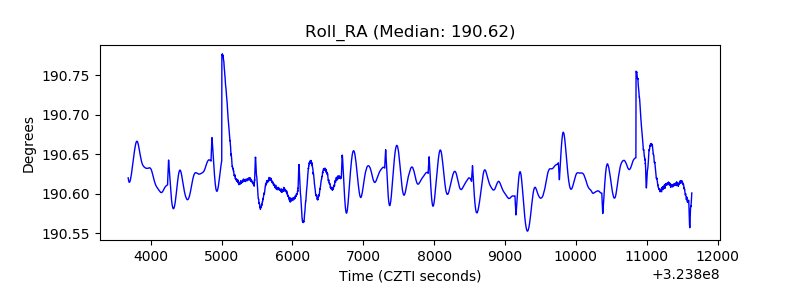 |
| Veto Counter | 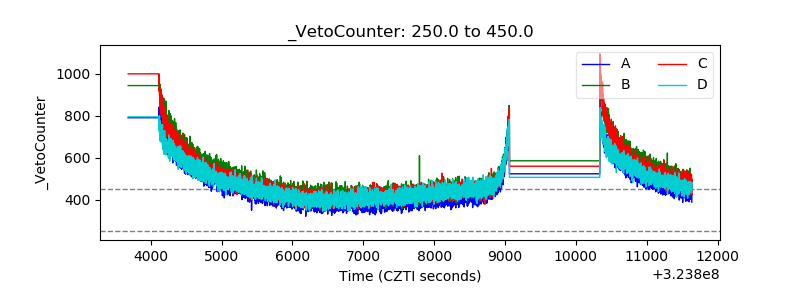 |