| Param | Original file | Final file |
|---|---|---|
| Filename | modeM0/AS1T03_183T01_9000003606_24449cztM0_level2.evt | modeM0/AS1T03_183T01_9000003606_24449cztM0_level2_quad_clean.evt |
| Size (bytes) | 467,628,480 | 119,517,120 |
| Size | 446.0 MB | 114.0 MB |
| Events in quadrant A | 3,175,665 | 805,507 |
| Events in quadrant B | 3,267,288 | 835,076 |
| Events in quadrant C | 3,357,005 | 778,667 |
| Events in quadrant D | 3,915,620 | 742,148 |
| Mode M0 | |||
|---|---|---|---|
| Quadrant | BADHDUFLAG | Total packets | Discarded packets |
| A | 0 | 13765 | 2 |
| B | 0 | 13861 | 2 |
| C | 0 | 14208 | 3 |
| D | 0 | 16145 | 2 |
| Mode SS | |||
|---|---|---|---|
| Quadrant | BADHDUFLAG | Total packets | Discarded packets |
| A | 0 | 132 | 0 |
| B | 0 | 132 | 0 |
| C | 0 | 132 | 0 |
| D | 0 | 132 | 0 |
| Mode M9 | |||
|---|---|---|---|
| Quadrant | BADHDUFLAG | Total packets | Discarded packets |
| A | 0 | 18 | 0 |
| B | 0 | 19 | 0 |
| C | 0 | 19 | 0 |
| D | 0 | 19 | 0 |
| Quadrant | Total seconds | Saturated seconds | Saturation percentage |
|---|---|---|---|
| A | 6580 | 24 | 0.364742% |
| B | 6580 | 41 | 0.623100% |
| C | 6579 | 66 | 1.003192% |
| D | 6579 | 130 | 1.975984% |
Noise dominated data is calculated using 1-second bins in cleaned event files. If a bin has >2000 counts, and if more than 50% of those come from <1% of pixels, then it is considered to be noise-dominated and hence unusable.
| Quadrant | # 1 sec bins | Bins with >0 counts | Bins with >2000 counts | High rate bins dominated by noise | Noise dominated (total time) | Noise dominated (detector-on time) | Marked lightcurve |
|---|---|---|---|---|---|---|---|
| A | 7845 | 6581 | 2 | 2 | 0.03% | 0.03% | 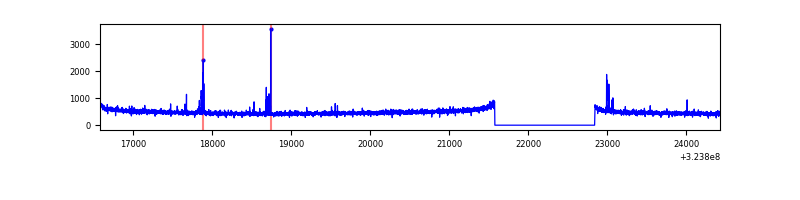 |
| B | 7845 | 6581 | 4 | 4 | 0.05% | 0.06% | 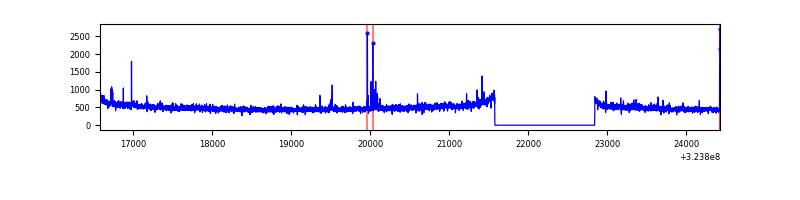 |
| C | 7844 | 6580 | 6 | 6 | 0.08% | 0.09% | 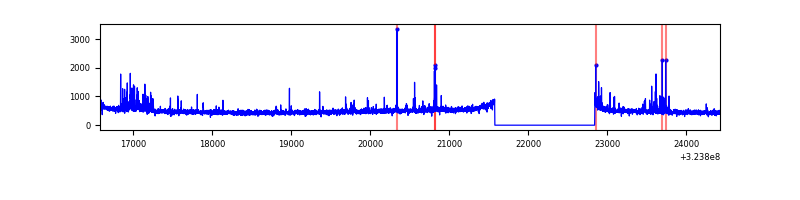 |
| D | 7844 | 6580 | 104 | 104 | 1.33% | 1.58% |  |
Top three noisy pixels from each quadrant. If the there are fewer than three noisy pixels in the level2.evt file, extra rows are filled as -1
| Pixel properties | Quadrant properties | ||||||
|---|---|---|---|---|---|---|---|
| Quadrant | DetID | PixID | Counts | Sigma | Mean | Median | Sigma |
| A | 4 | 2 | 63612 | 392.11 | 807 | 793 | 160.2 |
| A | 13 | 254 | 10586 | 61.13 | 807 | 793 | 160.2 |
| A | 3 | 137 | 7108 | 39.42 | 807 | 793 | 160.2 |
| B | 4 | 81 | 24799 | 156.96 | 818 | 798 | 152.9 |
| B | 7 | 202 | 21144 | 133.06 | 818 | 798 | 152.9 |
| B | 12 | 111 | 17956 | 112.21 | 818 | 798 | 152.9 |
| C | 2 | 16 | 178245 | 977.1 | 780 | 785 | 181.6 |
| C | 14 | 238 | 125465 | 686.49 | 780 | 785 | 181.6 |
| C | 3 | 233 | 12424 | 64.08 | 780 | 785 | 181.6 |
| D | 12 | 218 | 423029 | 2292.36 | 769 | 747 | 184.2 |
| D | 1 | 52 | 297130 | 1608.92 | 769 | 747 | 184.2 |
| D | 13 | 174 | 189504 | 1024.67 | 769 | 747 | 184.2 |
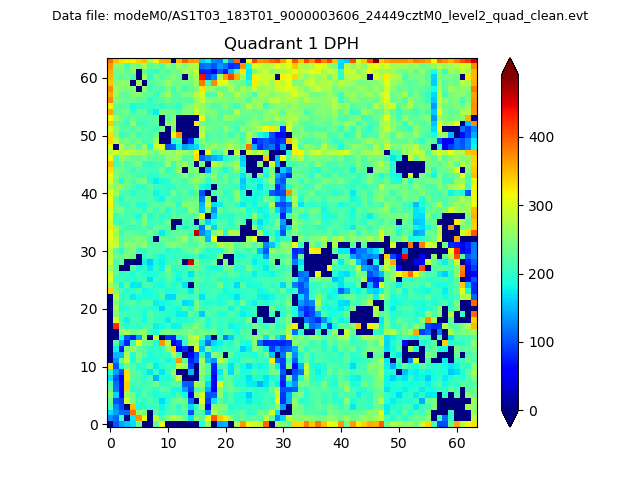
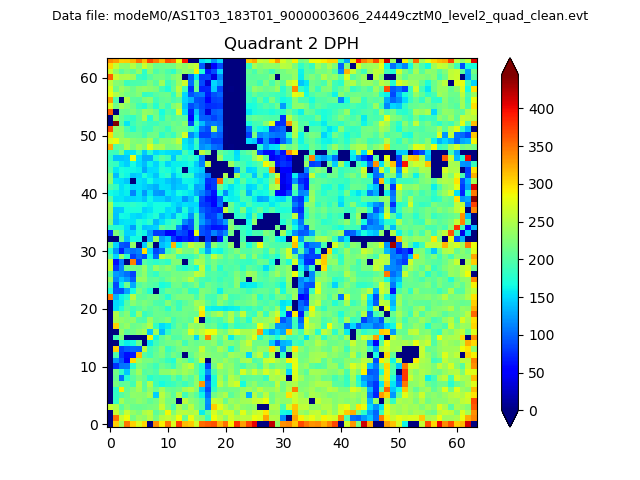
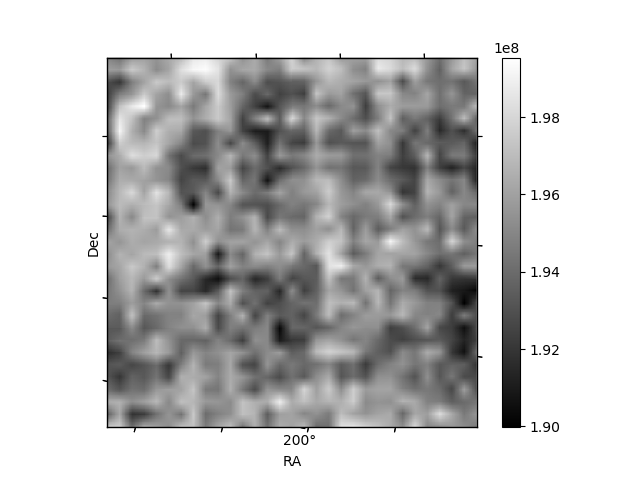
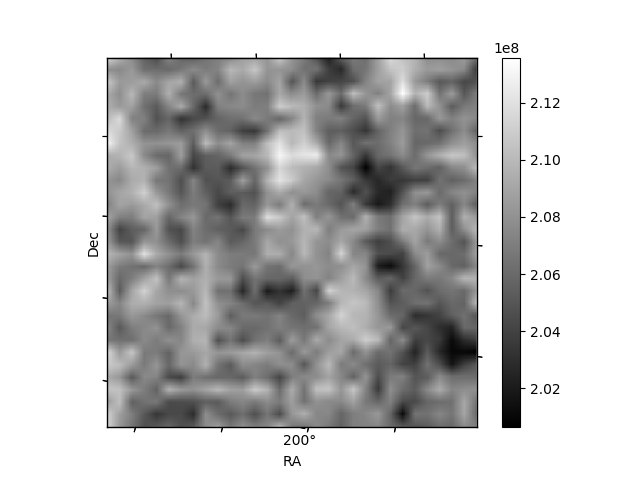
Histogram calculated using DETX and DETY for each event in the final _common_clean file
| Quadrant A |  |
 |
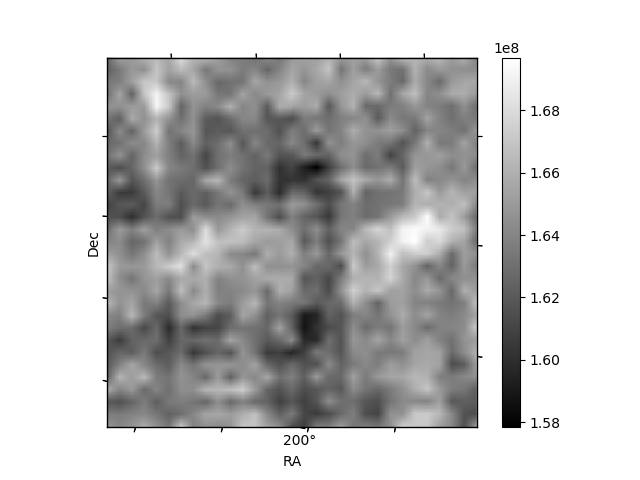
Quadrant B |
|---|---|---|---|
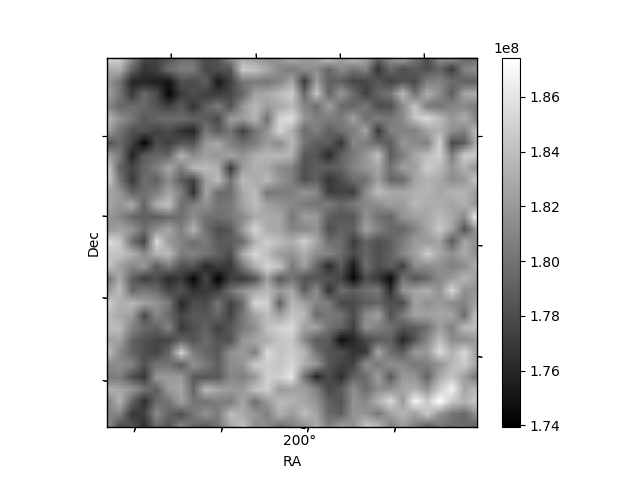
| Quadrant D | 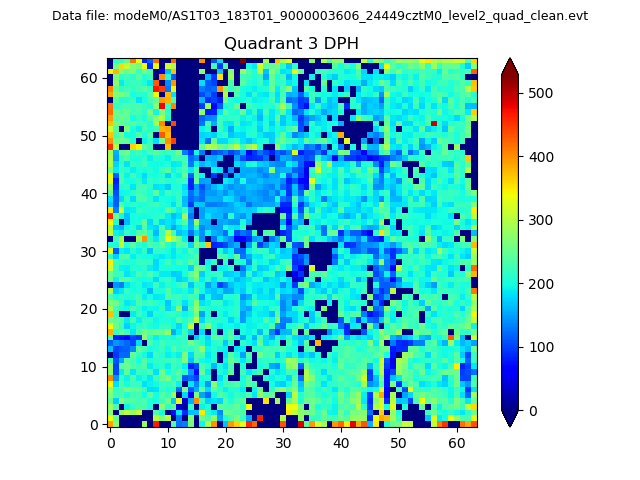 |
 |
Quadrant C |
| Plot type | Count rate plots | Images |
|---|---|---|
| Comparison with Poisson distribution Blue bars denote a histogram of data divided into 1 sec bins. Red curve is a Poisson curve with rate = median count rate of data. |
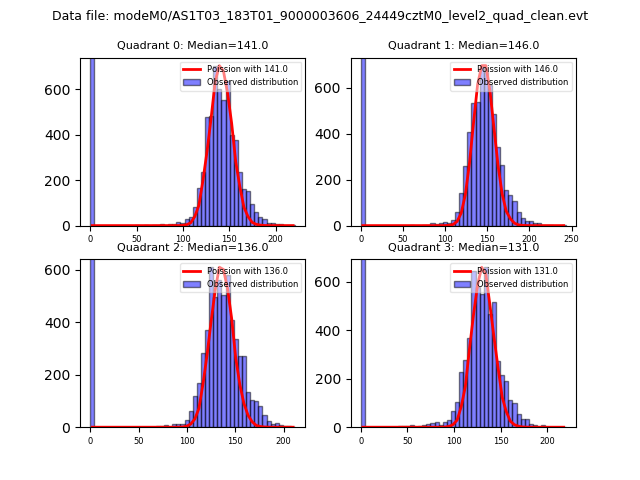 |
 |
| Quadrant-wise count rates Data is divided into 100 sec bins |
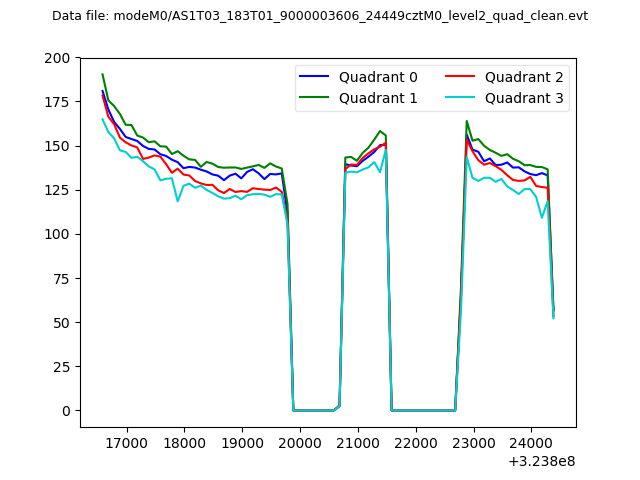 |
|
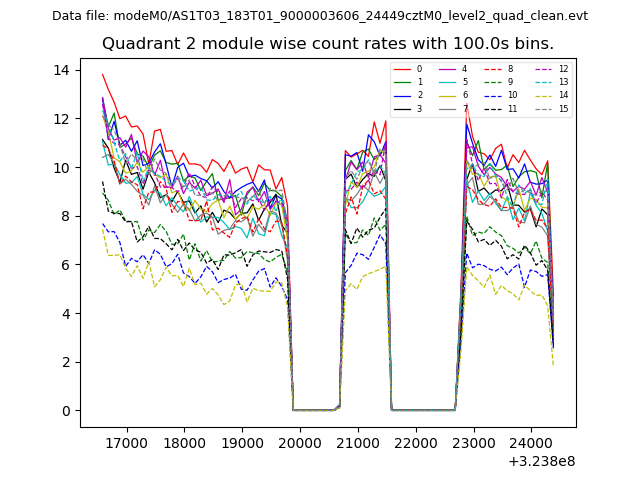
| Module-wise count rates for Quadrant A Data is divided into 100 sec bins |
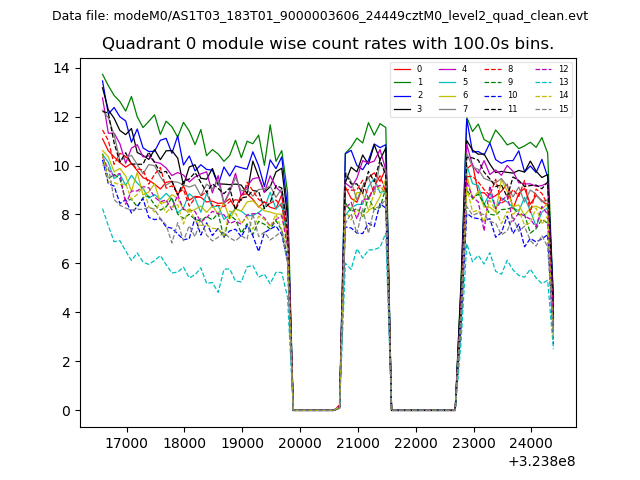 |
 |
| Module-wise count rates for Quadrant B Data is divided into 100 sec bins |
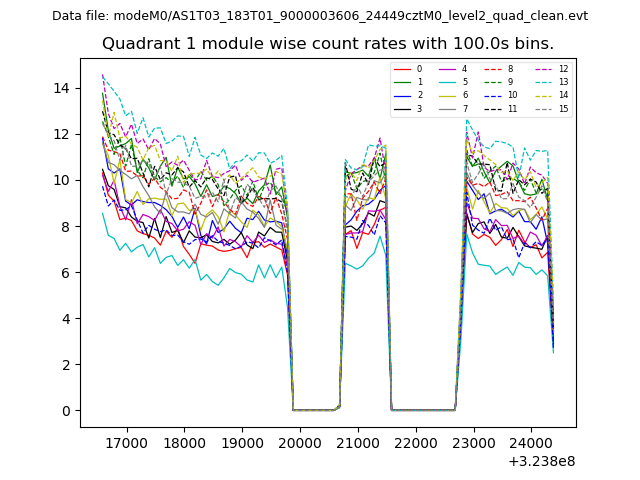 |
 |
| Module-wise count rates for Quadrant C Data is divided into 100 sec bins |
 |
 |
| Module-wise count rates for Quadrant D Data is divided into 100 sec bins |
 |
 |
| Parameter | Plot |
|---|---|
| CZT HV Monitor | 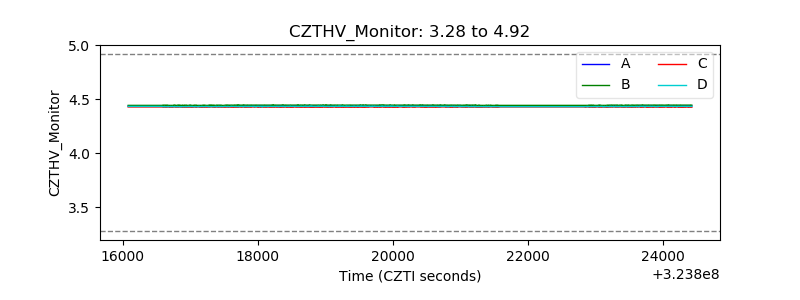 |
| D_VDD |  |
| Temperature 1 | 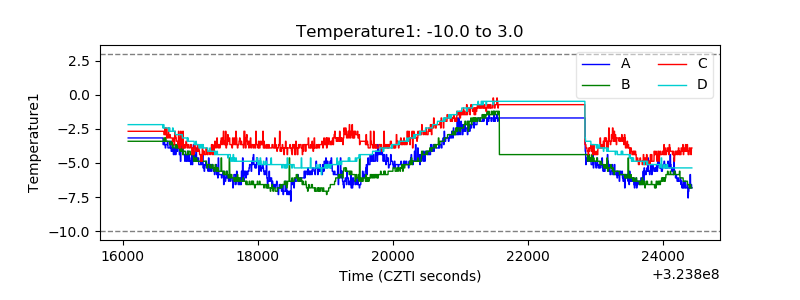 |
| Veto HV Monitor | 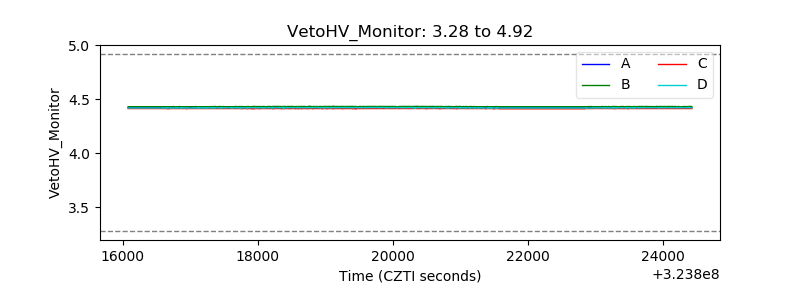 |
| Veto LLD | 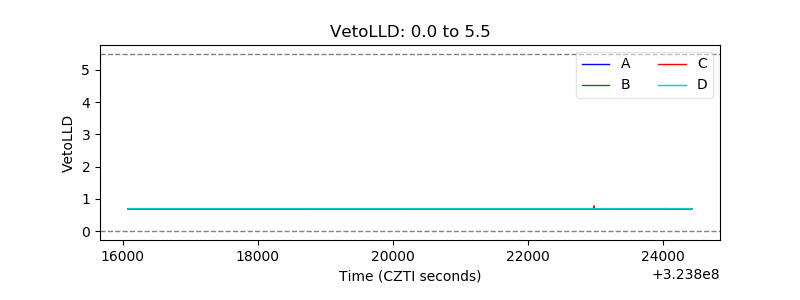 |
| Alpha Counter | 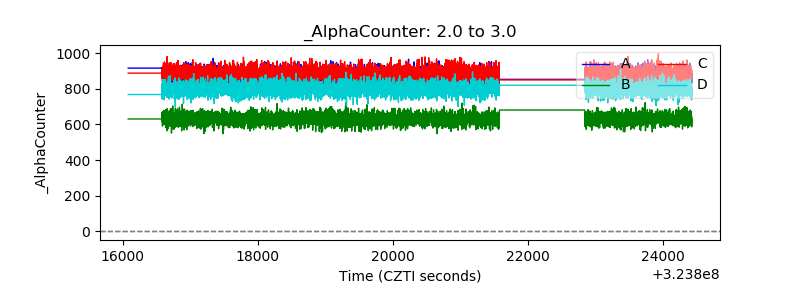 |
| _CPM_Rate | 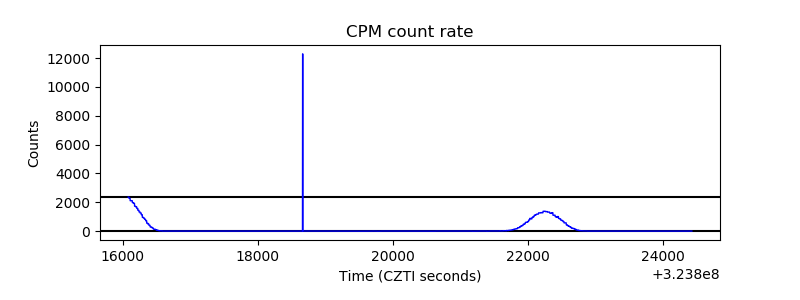 |
| CZT Counter | 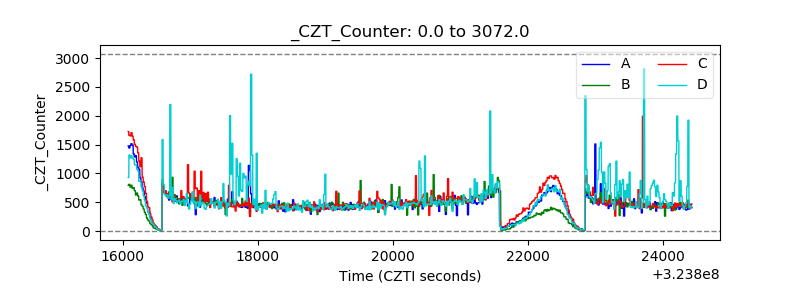 |
| +2.5 Volts monitor |  |
| +5 Volts monitor |  |
| _ROLL_ROT |  |
| _Roll_DEC | 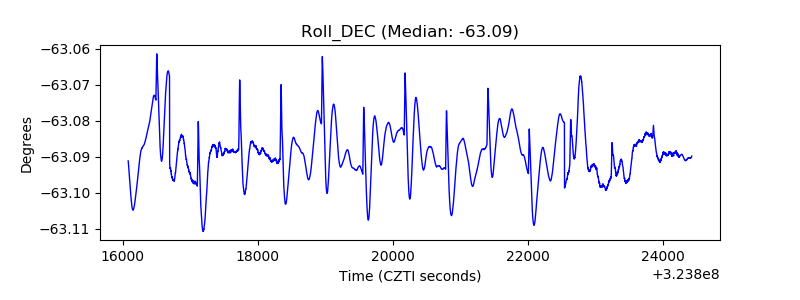 |
| _Roll_RA | 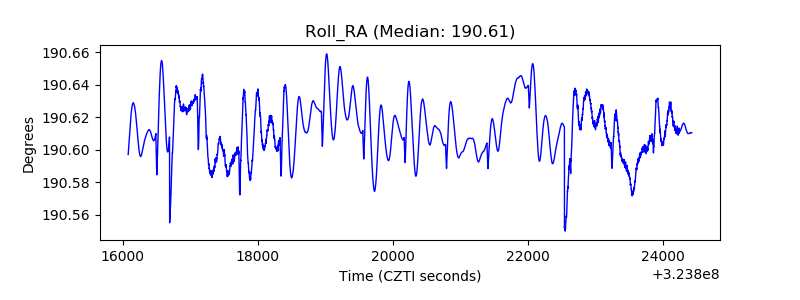 |
| Veto Counter |  |