| Param | Original file | Final file |
|---|---|---|
| Filename | modeM0/AS1T03_183T01_9000003606_24450cztM0_level2.evt | modeM0/AS1T03_183T01_9000003606_24450cztM0_level2_quad_clean.evt |
| Size (bytes) | 514,892,160 | 120,009,600 |
| Size | 491.0 MB | 114.5 MB |
| Events in quadrant A | 3,202,609 | 809,810 |
| Events in quadrant B | 3,512,315 | 832,333 |
| Events in quadrant C | 3,928,774 | 767,009 |
| Events in quadrant D | 4,478,885 | 742,120 |
| Mode M0 | |||
|---|---|---|---|
| Quadrant | BADHDUFLAG | Total packets | Discarded packets |
| A | 0 | 14197 | 2 |
| B | 0 | 14949 | 2 |
| C | 0 | 16213 | 2 |
| D | 0 | 18232 | 2 |
| Mode SS | |||
|---|---|---|---|
| Quadrant | BADHDUFLAG | Total packets | Discarded packets |
| A | 0 | 142 | 0 |
| B | 0 | 142 | 0 |
| C | 0 | 142 | 0 |
| D | 0 | 142 | 0 |
| Mode M9 | |||
|---|---|---|---|
| Quadrant | BADHDUFLAG | Total packets | Discarded packets |
| A | 0 | 11 | 0 |
| B | 0 | 12 | 0 |
| C | 0 | 12 | 0 |
| D | 0 | 12 | 0 |
| Quadrant | Total seconds | Saturated seconds | Saturation percentage |
|---|---|---|---|
| A | 6933 | 30 | 0.432713% |
| B | 6933 | 86 | 1.240444% |
| C | 6933 | 360 | 5.192557% |
| D | 6933 | 241 | 3.476129% |
Noise dominated data is calculated using 1-second bins in cleaned event files. If a bin has >2000 counts, and if more than 50% of those come from <1% of pixels, then it is considered to be noise-dominated and hence unusable.
| Quadrant | # 1 sec bins | Bins with >0 counts | Bins with >2000 counts | High rate bins dominated by noise | Noise dominated (total time) | Noise dominated (detector-on time) | Marked lightcurve |
|---|---|---|---|---|---|---|---|
| A | 7883 | 6934 | 0 | 0 | 0.00% | 0.00% | 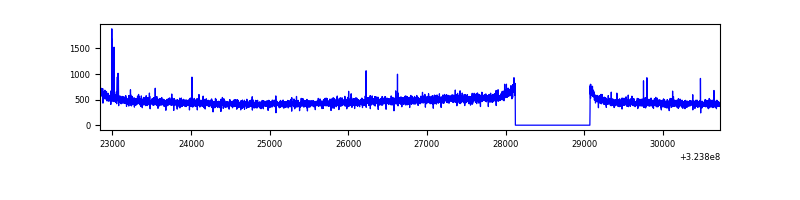 |
| B | 7883 | 6934 | 28 | 28 | 0.36% | 0.40% | 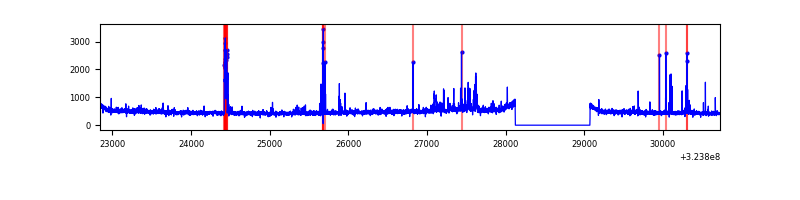 |
| C | 7883 | 6934 | 147 | 147 | 1.86% | 2.12% | 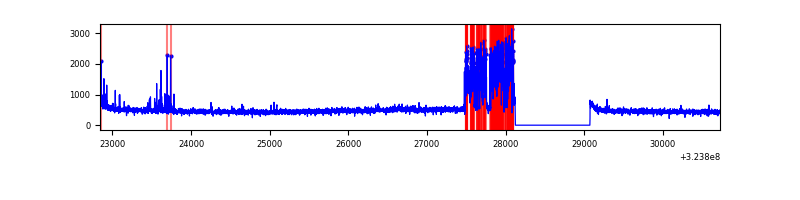 |
| D | 7883 | 6934 | 185 | 185 | 2.35% | 2.67% | 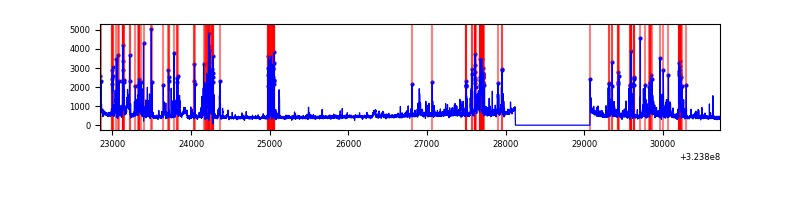 |
Top three noisy pixels from each quadrant. If the there are fewer than three noisy pixels in the level2.evt file, extra rows are filled as -1
| Pixel properties | Quadrant properties | ||||||
|---|---|---|---|---|---|---|---|
| Quadrant | DetID | PixID | Counts | Sigma | Mean | Median | Sigma |
| A | 4 | 2 | 20642 | 120.19 | 825 | 810 | 165.0 |
| A | 13 | 254 | 10350 | 57.82 | 825 | 810 | 165.0 |
| A | 3 | 137 | 7412 | 40.01 | 825 | 810 | 165.0 |
| B | 6 | 36 | 123977 | 787.89 | 833 | 812 | 156.3 |
| B | 3 | 64 | 88077 | 558.23 | 833 | 812 | 156.3 |
| B | 0 | 190 | 25375 | 157.13 | 833 | 812 | 156.3 |
| C | 3 | 233 | 654877 | 3572.21 | 787 | 793 | 183.1 |
| C | 14 | 238 | 124995 | 678.32 | 787 | 793 | 183.1 |
| C | 2 | 16 | 54989 | 295.99 | 787 | 793 | 183.1 |
| D | 12 | 218 | 953231 | 5004.05 | 788 | 764 | 190.3 |
| D | 1 | 52 | 246009 | 1288.46 | 788 | 764 | 190.3 |
| D | 8 | 195 | 187122 | 979.08 | 788 | 764 | 190.3 |
Histogram calculated using DETX and DETY for each event in the final _common_clean file
| Quadrant A |  |
 |
Quadrant B |
|---|---|---|---|
| Quadrant D |  |
 |
Quadrant C |
| Plot type | Count rate plots | Images |
|---|---|---|
| Comparison with Poisson distribution Blue bars denote a histogram of data divided into 1 sec bins. Red curve is a Poisson curve with rate = median count rate of data. |
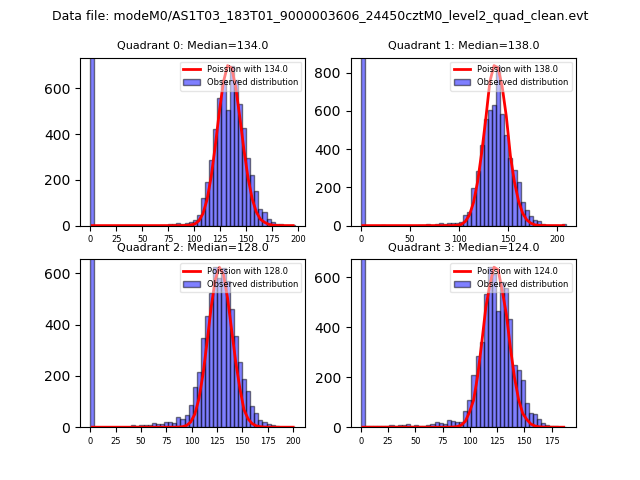 |
 |
| Quadrant-wise count rates Data is divided into 100 sec bins |
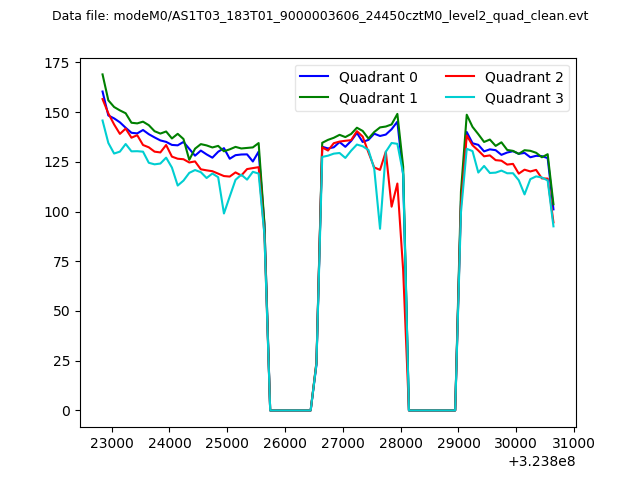 |
|
| Module-wise count rates for Quadrant A Data is divided into 100 sec bins |
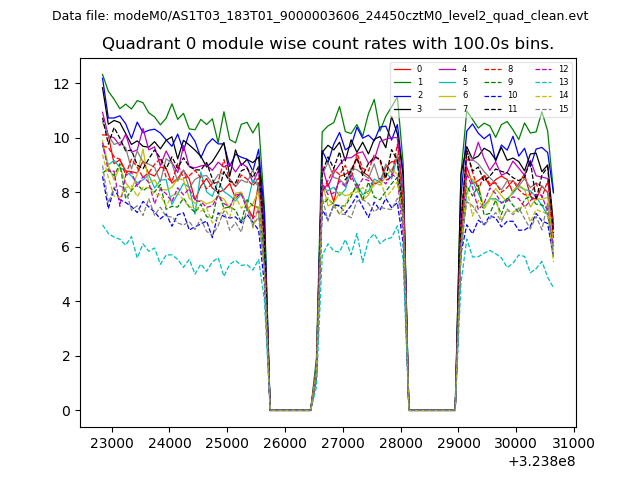 |
 |
| Module-wise count rates for Quadrant B Data is divided into 100 sec bins |
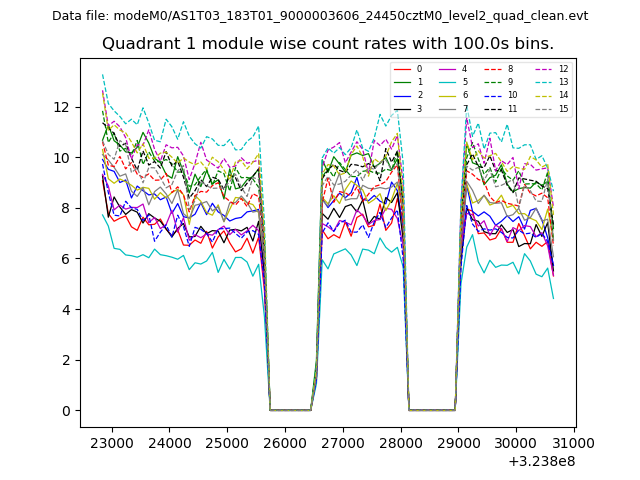 |
 |
| Module-wise count rates for Quadrant C Data is divided into 100 sec bins |
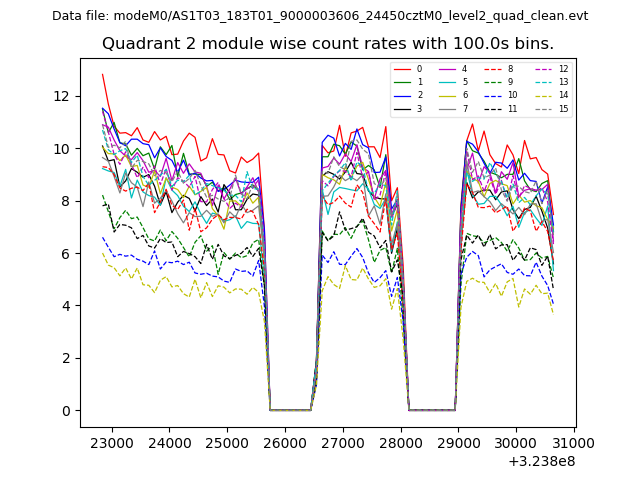 |
 |
| Module-wise count rates for Quadrant D Data is divided into 100 sec bins |
 |
 |
| Parameter | Plot |
|---|---|
| CZT HV Monitor | 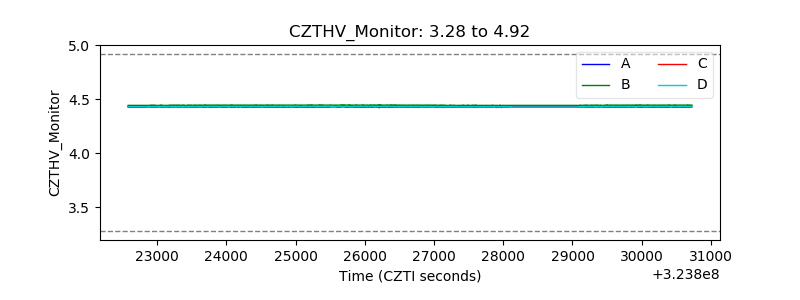 |
| D_VDD |  |
| Temperature 1 |  |
| Veto HV Monitor |  |
| Veto LLD |  |
| Alpha Counter | 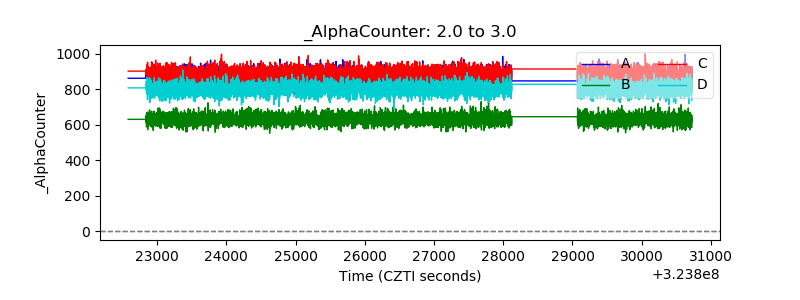 |
| _CPM_Rate | 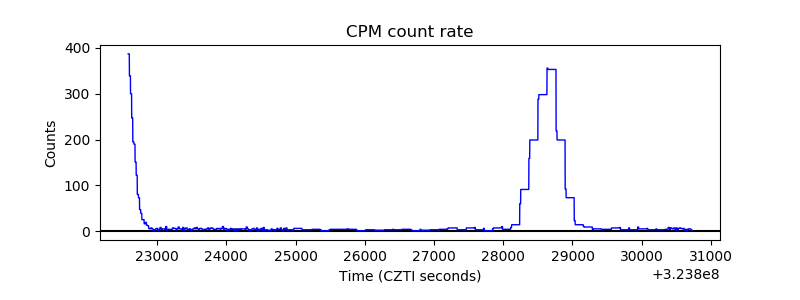 |
| CZT Counter |  |
| +2.5 Volts monitor |  |
| +5 Volts monitor |  |
| _ROLL_ROT |  |
| _Roll_DEC |  |
| _Roll_RA |  |
| Veto Counter | 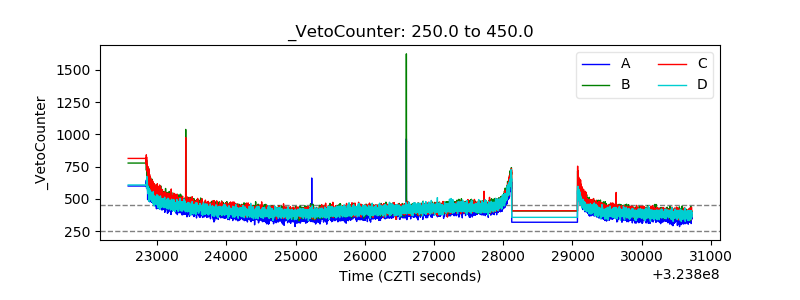 |