| Param | Original file | Final file |
|---|---|---|
| Filename | modeM0/AS1T03_183T01_9000003606_24453cztM0_level2.evt | modeM0/AS1T03_183T01_9000003606_24453cztM0_level2_quad_clean.evt |
| Size (bytes) | 521,161,920 | 120,326,400 |
| Size | 497.0 MB | 114.8 MB |
| Events in quadrant A | 3,423,614 | 797,559 |
| Events in quadrant B | 3,513,625 | 814,549 |
| Events in quadrant C | 3,832,569 | 766,901 |
| Events in quadrant D | 4,504,675 | 743,953 |
| Mode M0 | |||
|---|---|---|---|
| Quadrant | BADHDUFLAG | Total packets | Discarded packets |
| A | 0 | 15305 | 1 |
| B | 0 | 15372 | 1 |
| C | 0 | 16185 | 1 |
| D | 0 | 18553 | 1 |
| Mode SS | |||
|---|---|---|---|
| Quadrant | BADHDUFLAG | Total packets | Discarded packets |
| A | 0 | 152 | 0 |
| B | 0 | 152 | 0 |
| C | 0 | 152 | 0 |
| D | 0 | 152 | 0 |
| Mode M9 | |||
|---|---|---|---|
| Quadrant | BADHDUFLAG | Total packets | Discarded packets |
| A | 0 | 3 | 0 |
| B | 0 | 3 | 0 |
| C | 0 | 3 | 0 |
| D | 0 | 3 | 0 |
| Quadrant | Total seconds | Saturated seconds | Saturation percentage |
|---|---|---|---|
| A | 7488 | 117 | 1.562500% |
| B | 7489 | 143 | 1.909467% |
| C | 7489 | 230 | 3.071171% |
| D | 7489 | 326 | 4.353051% |
Noise dominated data is calculated using 1-second bins in cleaned event files. If a bin has >2000 counts, and if more than 50% of those come from <1% of pixels, then it is considered to be noise-dominated and hence unusable.
| Quadrant | # 1 sec bins | Bins with >0 counts | Bins with >2000 counts | High rate bins dominated by noise | Noise dominated (total time) | Noise dominated (detector-on time) | Marked lightcurve |
|---|---|---|---|---|---|---|---|
| A | 7753 | 7490 | 0 | 0 | 0.00% | 0.00% | 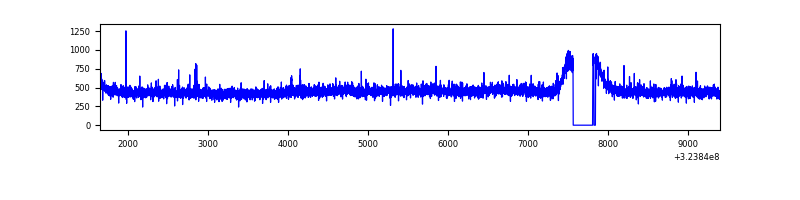 |
| B | 7754 | 7491 | 0 | 0 | 0.00% | 0.00% | 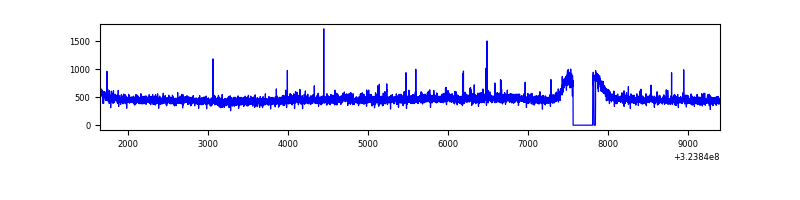 |
| C | 7754 | 7491 | 47 | 47 | 0.61% | 0.63% | 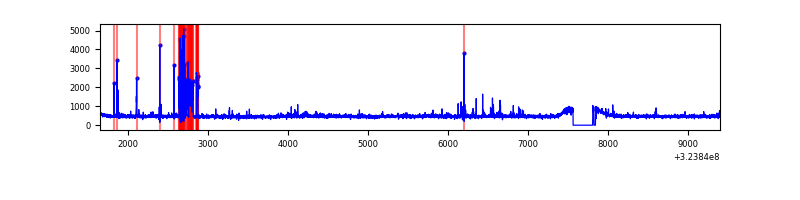 |
| D | 7754 | 7491 | 174 | 174 | 2.24% | 2.32% | 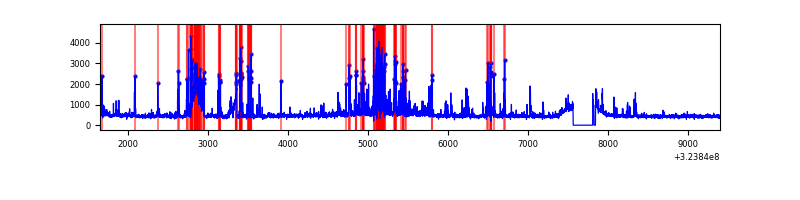 |
Top three noisy pixels from each quadrant. If the there are fewer than three noisy pixels in the level2.evt file, extra rows are filled as -1
| Pixel properties | Quadrant properties | ||||||
|---|---|---|---|---|---|---|---|
| Quadrant | DetID | PixID | Counts | Sigma | Mean | Median | Sigma |
| A | 4 | 2 | 15390 | 81.18 | 883 | 863 | 179.0 |
| A | 13 | 254 | 11263 | 58.12 | 883 | 863 | 179.0 |
| A | 3 | 137 | 8467 | 42.49 | 883 | 863 | 179.0 |
| B | 12 | 111 | 20884 | 118.77 | 885 | 862 | 168.6 |
| B | 11 | 111 | 18809 | 106.46 | 885 | 862 | 168.6 |
| B | 14 | 111 | 16728 | 94.12 | 885 | 862 | 168.6 |
| C | 10 | 9 | 271591 | 1353.4 | 854 | 857 | 200.0 |
| C | 14 | 238 | 135192 | 671.54 | 854 | 857 | 200.0 |
| C | 2 | 16 | 63695 | 314.13 | 854 | 857 | 200.0 |
| D | 12 | 218 | 826445 | 3996.93 | 856 | 830 | 206.6 |
| D | 1 | 52 | 192250 | 926.69 | 856 | 830 | 206.6 |
| D | 6 | 112 | 91514 | 439.02 | 856 | 830 | 206.6 |
Histogram calculated using DETX and DETY for each event in the final _common_clean file
| Quadrant A |  |
 |
Quadrant B |
|---|---|---|---|
| Quadrant D |  |
 |
Quadrant C |
| Plot type | Count rate plots | Images |
|---|---|---|
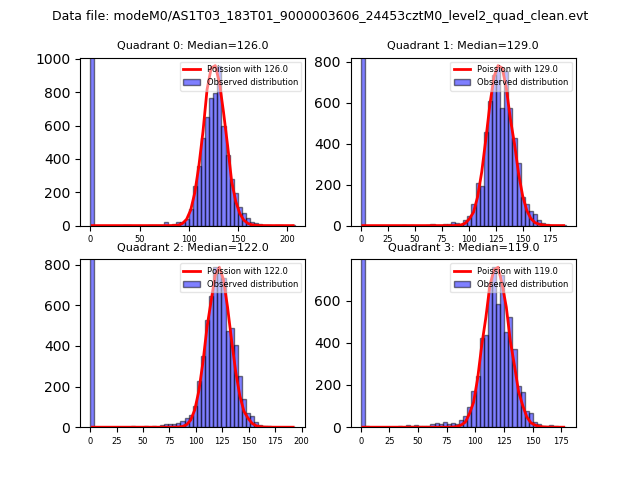
| Comparison with Poisson distribution Blue bars denote a histogram of data divided into 1 sec bins. Red curve is a Poisson curve with rate = median count rate of data. |
 |
 |
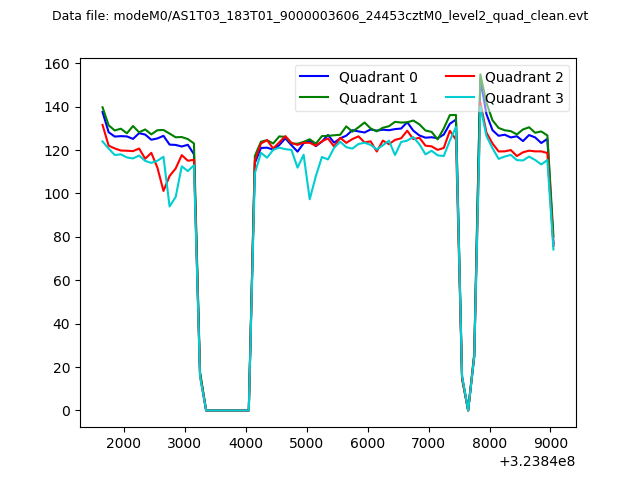
| Quadrant-wise count rates Data is divided into 100 sec bins |
 |
|
| Module-wise count rates for Quadrant A Data is divided into 100 sec bins |
 |
 |
| Module-wise count rates for Quadrant B Data is divided into 100 sec bins |
 |
 |
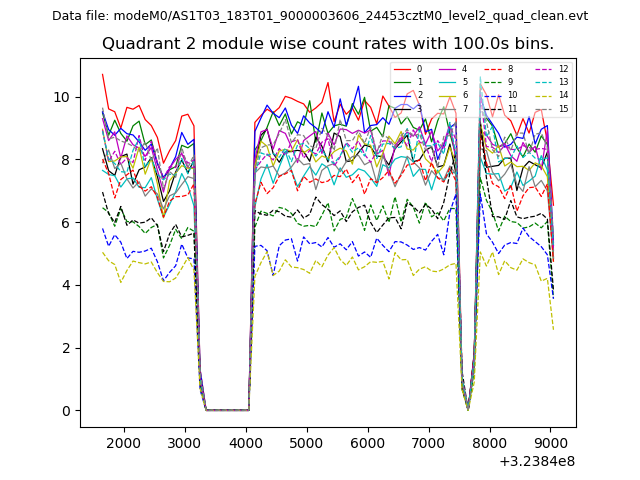
| Module-wise count rates for Quadrant C Data is divided into 100 sec bins |
 |
 |
| Module-wise count rates for Quadrant D Data is divided into 100 sec bins |
 |
 |
| Parameter | Plot |
|---|---|
| CZT HV Monitor | 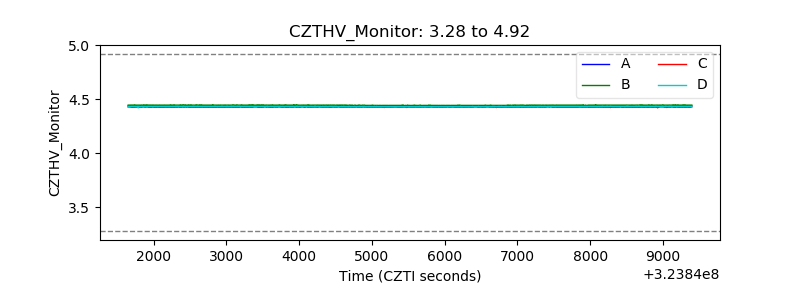 |
| D_VDD |  |
| Temperature 1 |  |
| Veto HV Monitor |  |
| Veto LLD |  |
| Alpha Counter | 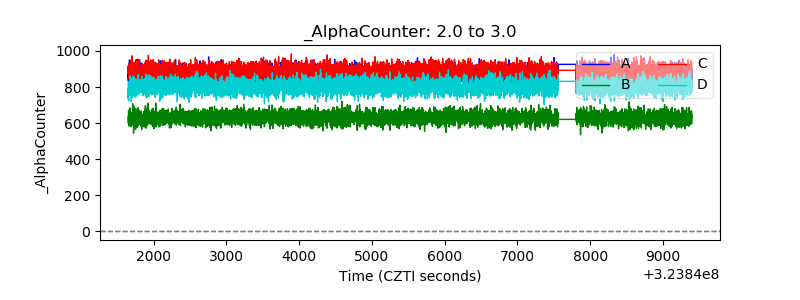 |
| _CPM_Rate | 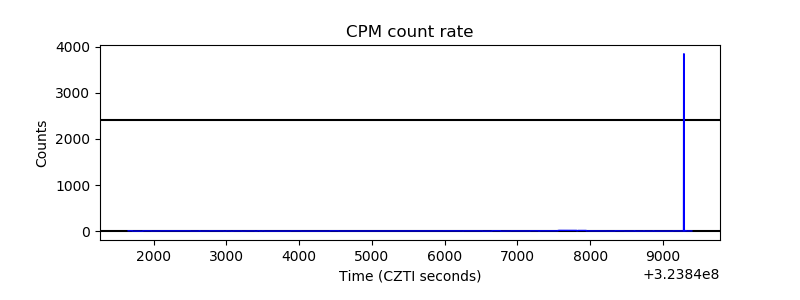 |
| CZT Counter |  |
| +2.5 Volts monitor |  |
| +5 Volts monitor |  |
| _ROLL_ROT |  |
| _Roll_DEC |  |
| _Roll_RA |  |
| Veto Counter |  |