| Param | Original file | Final file |
|---|---|---|
| Filename | modeM0/AS1T03_183T01_9000003606_24457cztM0_level2.evt | modeM0/AS1T03_183T01_9000003606_24457cztM0_level2_quad_clean.evt |
| Size (bytes) | 1,344,219,840 | 263,710,080 |
| Size | 1.3 GB | 251.5 MB |
| Events in quadrant A | 7,611,317 | 1,756,484 |
| Events in quadrant B | 8,179,018 | 1,779,240 |
| Events in quadrant C | 9,836,576 | 1,682,759 |
| Events in quadrant D | 13,953,022 | 1,614,476 |
| Mode M0 | |||
|---|---|---|---|
| Quadrant | BADHDUFLAG | Total packets | Discarded packets |
| A | 0 | 34106 | 3 |
| B | 0 | 35283 | 3 |
| C | 0 | 40141 | 5 |
| D | 0 | 53132 | 3 |
| Mode SS | |||
|---|---|---|---|
| Quadrant | BADHDUFLAG | Total packets | Discarded packets |
| A | 0 | 338 | 0 |
| B | 0 | 338 | 0 |
| C | 0 | 338 | 0 |
| D | 0 | 338 | 0 |
| Mode M9 | |||
|---|---|---|---|
| Quadrant | BADHDUFLAG | Total packets | Discarded packets |
| A | 0 | 12 | 0 |
| B | 0 | 13 | 0 |
| C | 0 | 13 | 0 |
| D | 0 | 13 | 0 |
| Quadrant | Total seconds | Saturated seconds | Saturation percentage |
|---|---|---|---|
| A | 16735 | 191 | 1.141321% |
| B | 16735 | 371 | 2.216911% |
| C | 16734 | 898 | 5.366320% |
| D | 16734 | 1367 | 8.168997% |
Noise dominated data is calculated using 1-second bins in cleaned event files. If a bin has >2000 counts, and if more than 50% of those come from <1% of pixels, then it is considered to be noise-dominated and hence unusable.
| Quadrant | # 1 sec bins | Bins with >0 counts | Bins with >2000 counts | High rate bins dominated by noise | Noise dominated (total time) | Noise dominated (detector-on time) | Marked lightcurve |
|---|---|---|---|---|---|---|---|
| A | 17820 | 16738 | 0 | 0 | 0.00% | 0.00% |  |
| B | 17820 | 16738 | 100 | 100 | 0.56% | 0.60% |  |
| C | 17819 | 16737 | 404 | 404 | 2.27% | 2.41% |  |
| D | 17819 | 16736 | 1028 | 1028 | 5.77% | 6.14% |  |
Top three noisy pixels from each quadrant. If the there are fewer than three noisy pixels in the level2.evt file, extra rows are filled as -1
| Pixel properties | Quadrant properties | ||||||
|---|---|---|---|---|---|---|---|
| Quadrant | DetID | PixID | Counts | Sigma | Mean | Median | Sigma |
| A | 4 | 2 | 30785 | 72.59 | 1967 | 1920 | 397.6 |
| A | 13 | 254 | 24955 | 57.93 | 1967 | 1920 | 397.6 |
| A | 3 | 137 | 18251 | 41.07 | 1967 | 1920 | 397.6 |
| B | 5 | 172 | 344108 | 918.44 | 1957 | 1905 | 372.6 |
| B | 15 | 33 | 61518 | 159.99 | 1957 | 1905 | 372.6 |
| B | 12 | 111 | 45939 | 118.18 | 1957 | 1905 | 372.6 |
| C | 2 | 16 | 2105546 | 4853.94 | 1868 | 1875 | 433.4 |
| C | 14 | 238 | 297452 | 682.0 | 1868 | 1875 | 433.4 |
| C | 3 | 233 | 99149 | 224.45 | 1868 | 1875 | 433.4 |
| D | 12 | 218 | 2888806 | 6389.39 | 1866 | 1807 | 451.8 |
| D | 7 | 238 | 2508108 | 5546.84 | 1866 | 1807 | 451.8 |
| D | 1 | 52 | 910260 | 2010.55 | 1866 | 1807 | 451.8 |
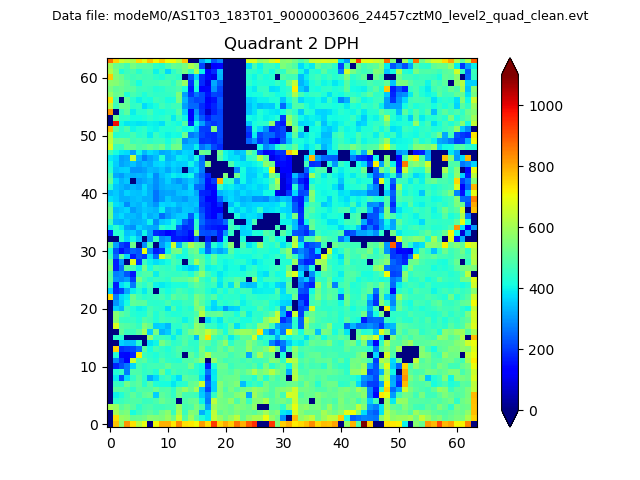
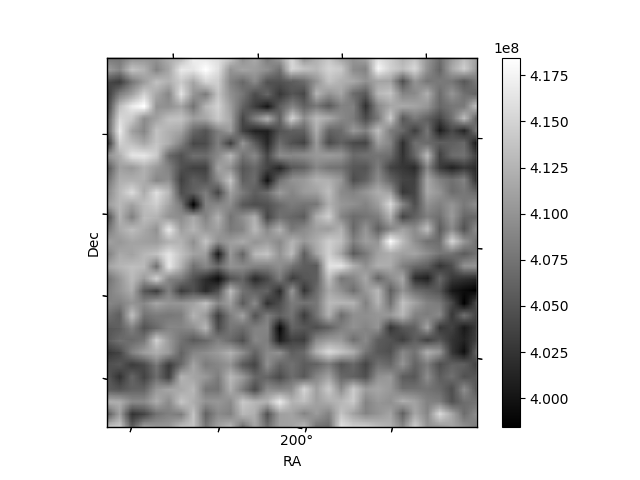
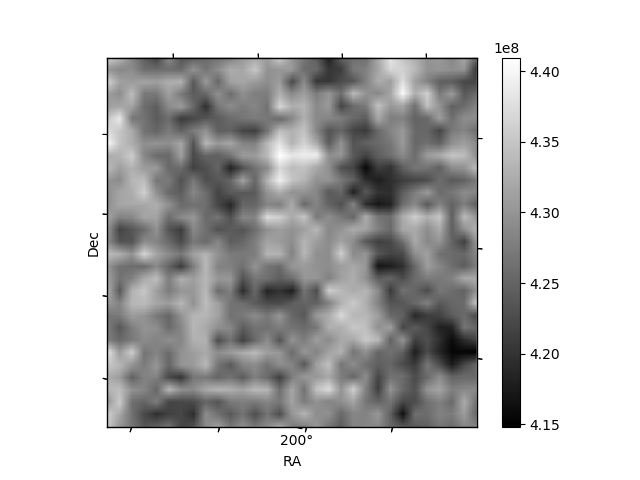
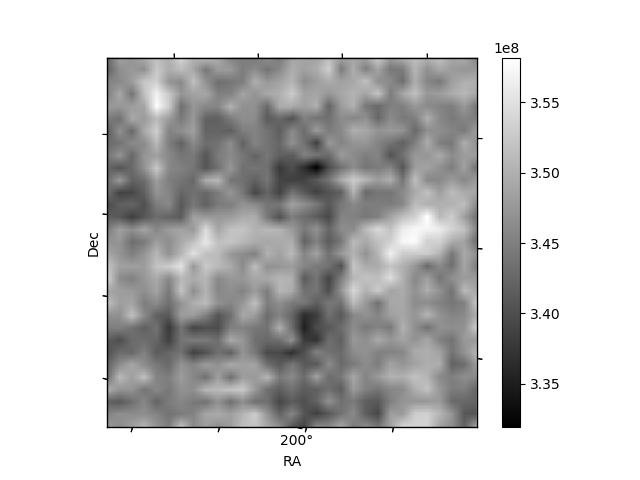
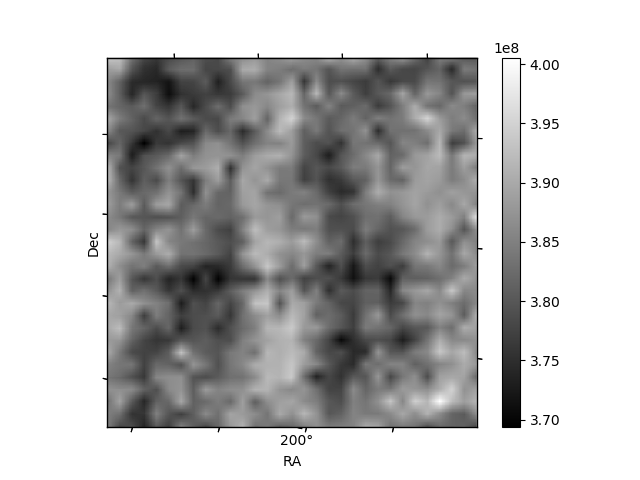
Histogram calculated using DETX and DETY for each event in the final _common_clean file
| Quadrant A | 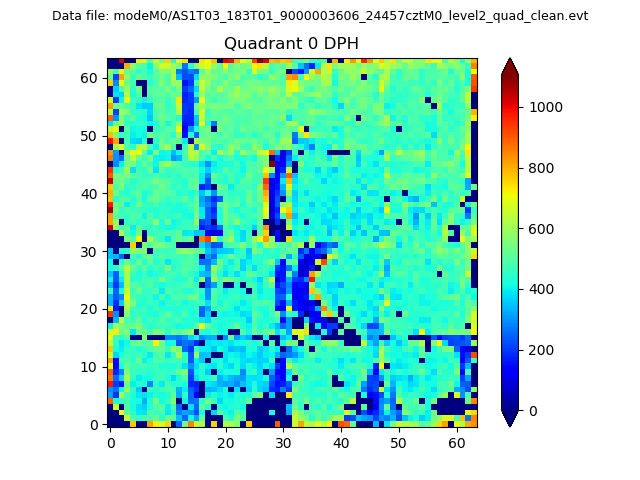 |
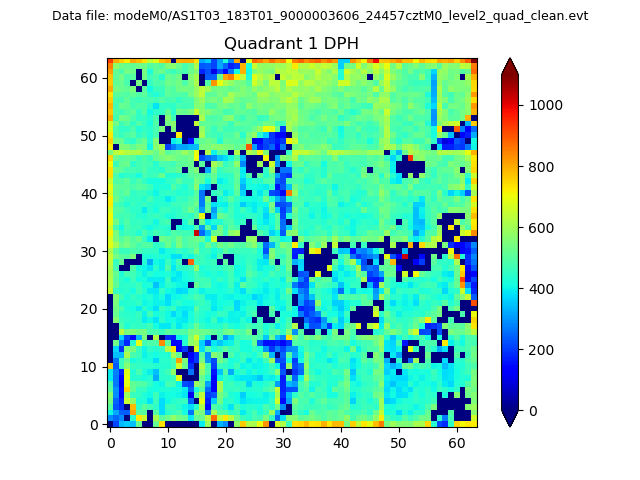 |
Quadrant B |
|---|---|---|---|
| Quadrant D | 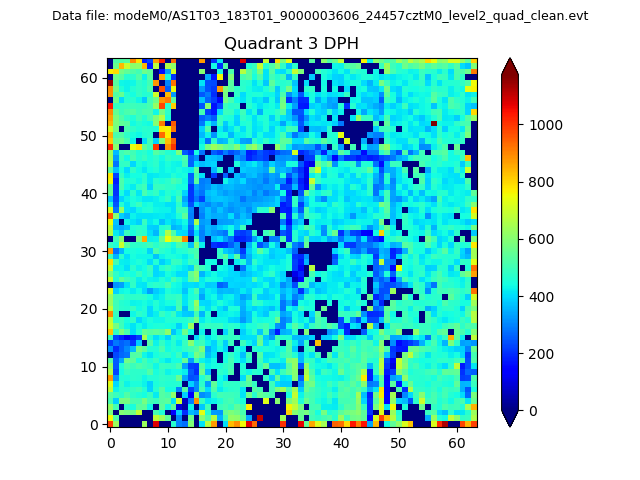 |
 |
Quadrant C |
| Plot type | Count rate plots | Images |
|---|---|---|
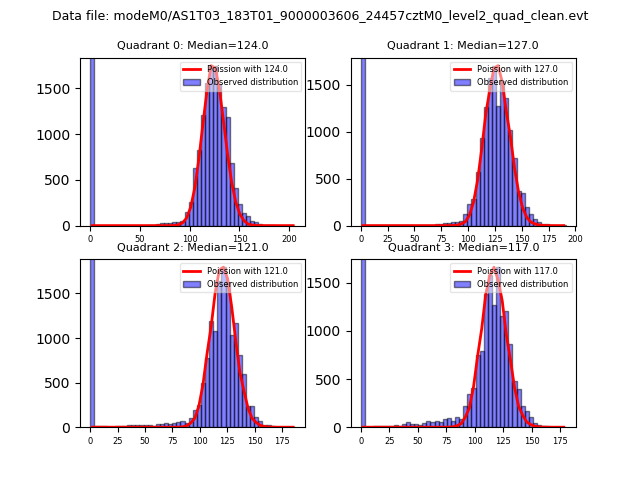
| Comparison with Poisson distribution Blue bars denote a histogram of data divided into 1 sec bins. Red curve is a Poisson curve with rate = median count rate of data. |
 |
 |
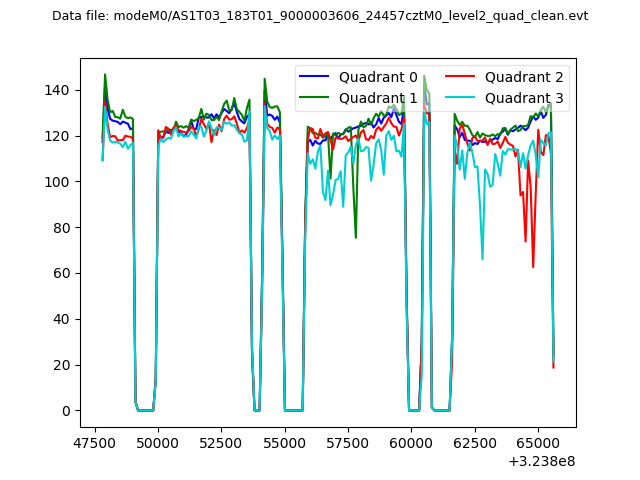
| Quadrant-wise count rates Data is divided into 100 sec bins |
 |
|
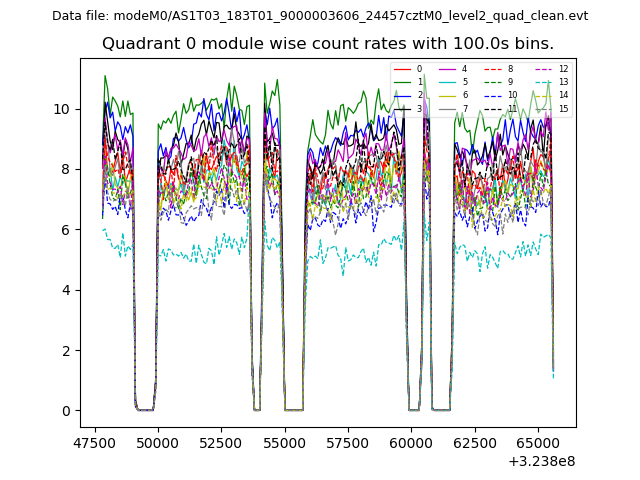
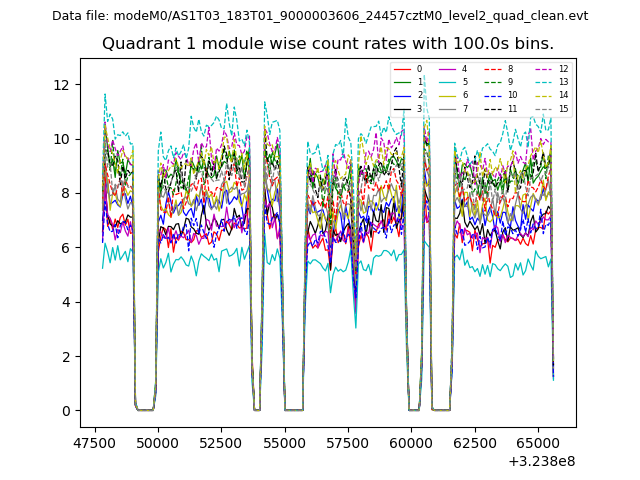
| Module-wise count rates for Quadrant A Data is divided into 100 sec bins |
 |
 |
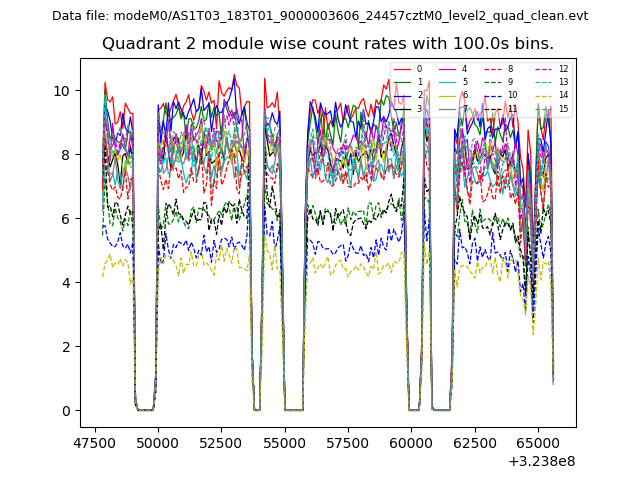
| Module-wise count rates for Quadrant B Data is divided into 100 sec bins |
 |
 |
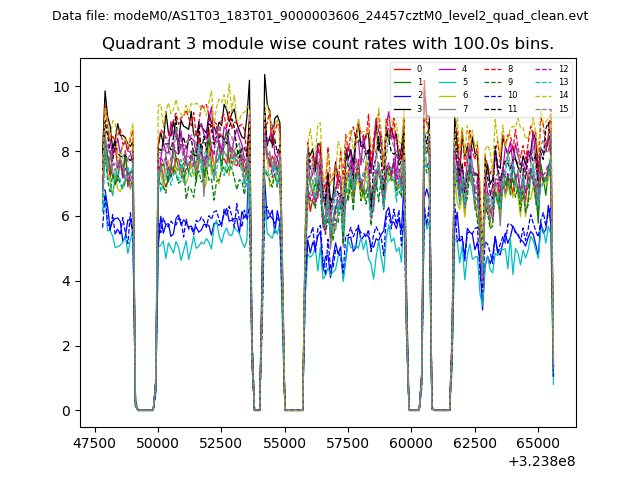
| Module-wise count rates for Quadrant C Data is divided into 100 sec bins |
 |
 |
| Module-wise count rates for Quadrant D Data is divided into 100 sec bins |
 |
 |
| Parameter | Plot |
|---|---|
| CZT HV Monitor | 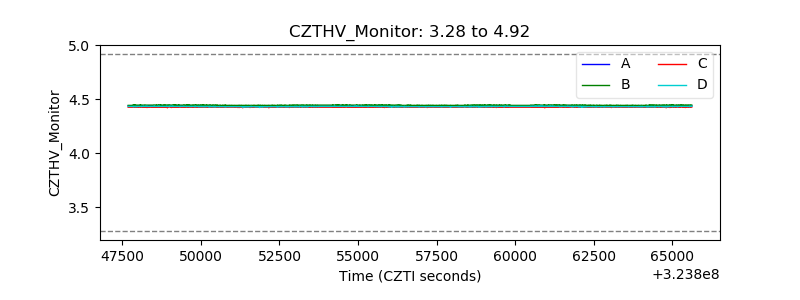 |
| D_VDD | 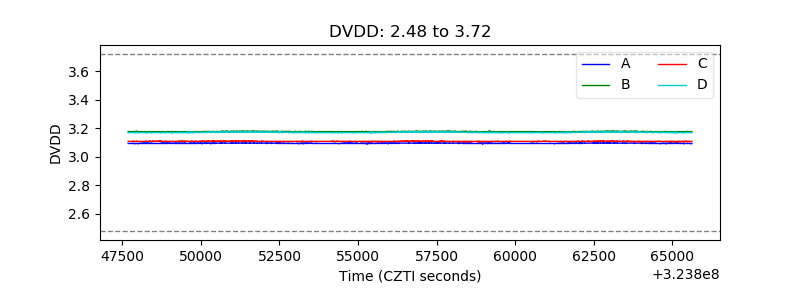 |
| Temperature 1 |  |
| Veto HV Monitor | 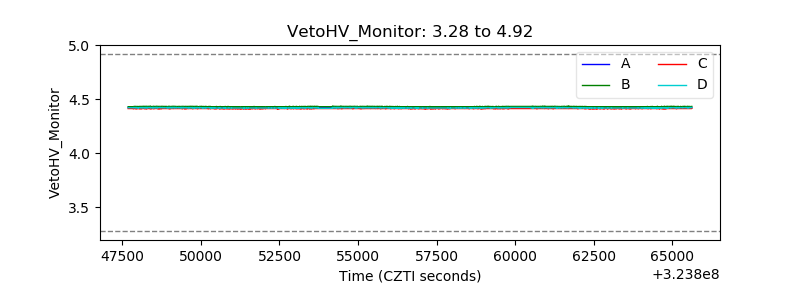 |
| Veto LLD | 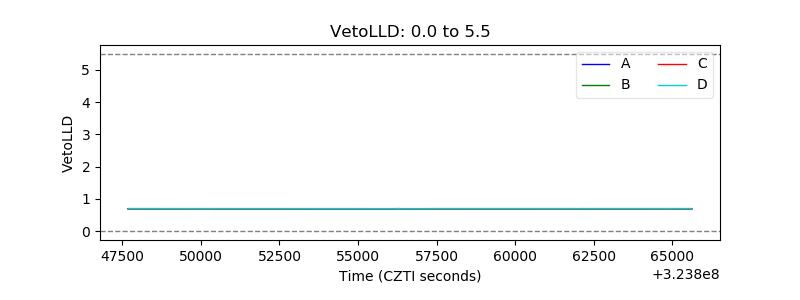 |
| Alpha Counter | 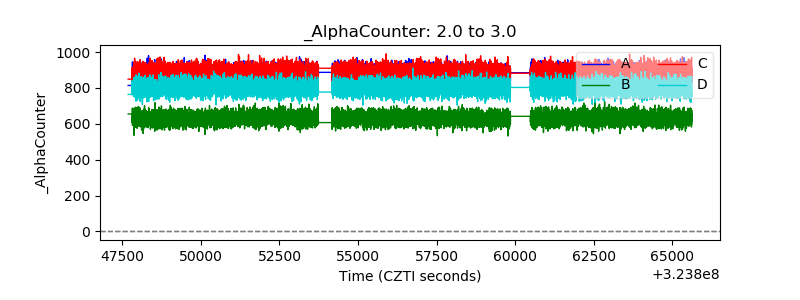 |
| _CPM_Rate | 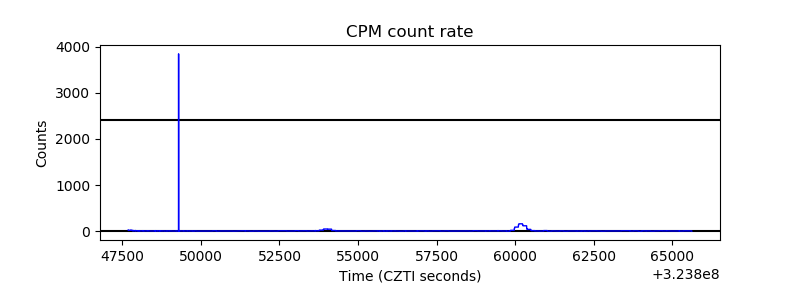 |
| CZT Counter | 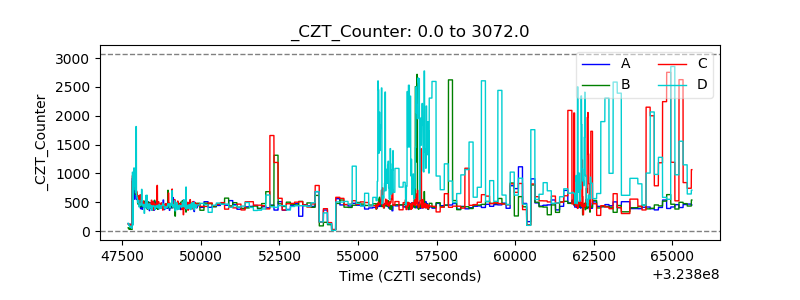 |
| +2.5 Volts monitor |  |
| +5 Volts monitor |  |
| _ROLL_ROT |  |
| _Roll_DEC |  |
| _Roll_RA | 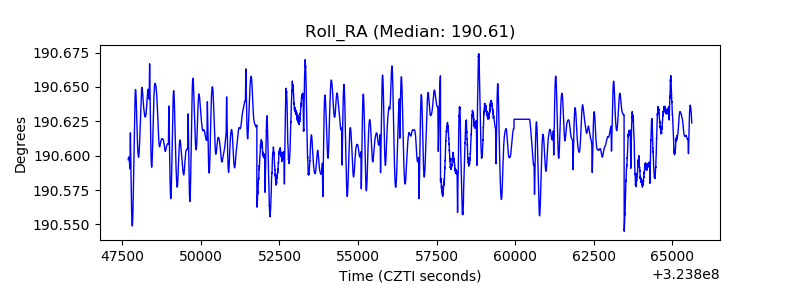 |
| Veto Counter | 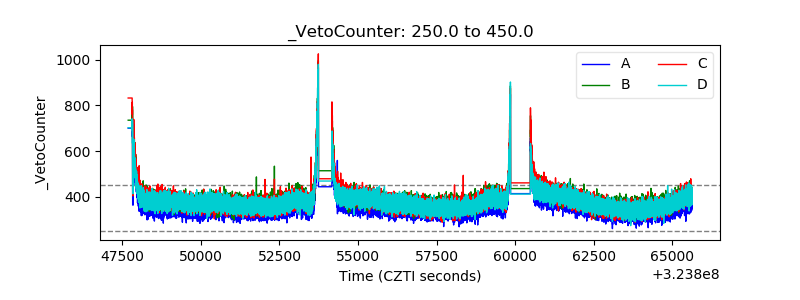 |