| Param | Original file | Final file |
|---|---|---|
| Filename | modeM0/AS1T03_183T01_9000003606_24459cztM0_level2.evt | modeM0/AS1T03_183T01_9000003606_24459cztM0_level2_quad_clean.evt |
| Size (bytes) | 1,245,113,280 | 225,688,320 |
| Size | 1.2 GB | 215.2 MB |
| Events in quadrant A | 6,076,994 | 1,560,868 |
| Events in quadrant B | 6,293,681 | 1,581,183 |
| Events in quadrant C | 11,579,650 | 1,413,292 |
| Events in quadrant D | 12,905,805 | 1,405,289 |
| Mode M0 | |||
|---|---|---|---|
| Quadrant | BADHDUFLAG | Total packets | Discarded packets |
| A | 0 | 26525 | 3 |
| B | 0 | 26978 | 3 |
| C | 0 | 42937 | 3 |
| D | 0 | 47452 | 3 |
| Mode SS | |||
|---|---|---|---|
| Quadrant | BADHDUFLAG | Total packets | Discarded packets |
| A | 0 | 256 | 0 |
| B | 0 | 256 | 0 |
| C | 0 | 256 | 0 |
| D | 0 | 256 | 0 |
| Mode M9 | |||
|---|---|---|---|
| Quadrant | BADHDUFLAG | Total packets | Discarded packets |
| A | 0 | 30 | 0 |
| B | 0 | 30 | 0 |
| C | 0 | 30 | 0 |
| D | 0 | 30 | 0 |
| Quadrant | Total seconds | Saturated seconds | Saturation percentage |
|---|---|---|---|
| A | 12661 | 125 | 0.987284% |
| B | 12662 | 150 | 1.184647% |
| C | 12661 | 1821 | 14.382750% |
| D | 12661 | 1099 | 8.680199% |
Noise dominated data is calculated using 1-second bins in cleaned event files. If a bin has >2000 counts, and if more than 50% of those come from <1% of pixels, then it is considered to be noise-dominated and hence unusable.
| Quadrant | # 1 sec bins | Bins with >0 counts | Bins with >2000 counts | High rate bins dominated by noise | Noise dominated (total time) | Noise dominated (detector-on time) | Marked lightcurve |
|---|---|---|---|---|---|---|---|
| A | 15556 | 12664 | 0 | 0 | 0.00% | 0.00% | 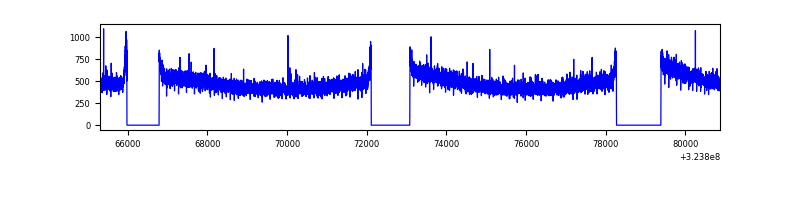 |
| B | 15557 | 12665 | 3 | 3 | 0.02% | 0.02% | 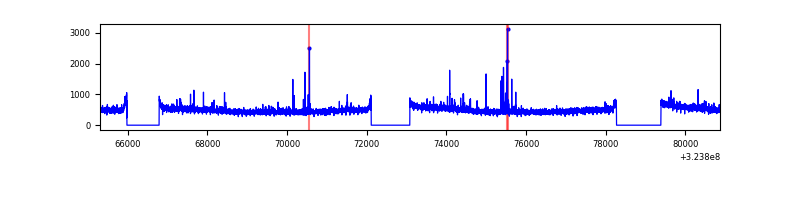 |
| C | 15556 | 12664 | 1024 | 1024 | 6.58% | 8.09% | 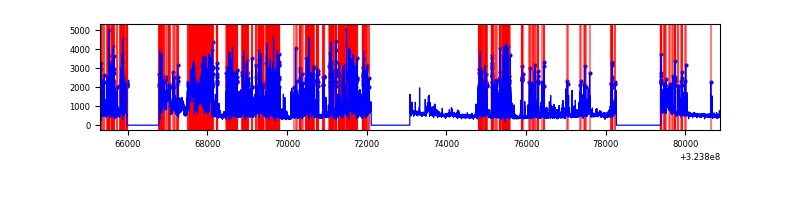 |
| D | 15556 | 12663 | 966 | 966 | 6.21% | 7.63% | 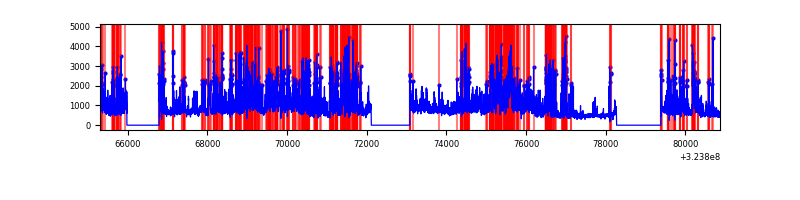 |
Top three noisy pixels from each quadrant. If the there are fewer than three noisy pixels in the level2.evt file, extra rows are filled as -1
| Pixel properties | Quadrant properties | ||||||
|---|---|---|---|---|---|---|---|
| Quadrant | DetID | PixID | Counts | Sigma | Mean | Median | Sigma |
| A | 13 | 254 | 19122 | 55.96 | 1572 | 1541 | 314.2 |
| A | 4 | 2 | 16765 | 48.46 | 1572 | 1541 | 314.2 |
| A | 3 | 137 | 14011 | 39.69 | 1572 | 1541 | 314.2 |
| B | 3 | 64 | 84987 | 284.34 | 1561 | 1522 | 293.5 |
| B | 7 | 202 | 46982 | 154.87 | 1561 | 1522 | 293.5 |
| B | 12 | 111 | 35474 | 115.66 | 1561 | 1522 | 293.5 |
| C | 2 | 16 | 5706972 | 17431.49 | 1429 | 1436 | 327.3 |
| C | 14 | 238 | 229014 | 695.29 | 1429 | 1436 | 327.3 |
| C | 3 | 233 | 37017 | 108.71 | 1429 | 1436 | 327.3 |
| D | 7 | 238 | 4241373 | 11957.83 | 1477 | 1433 | 354.6 |
| D | 12 | 218 | 1713586 | 4828.76 | 1477 | 1433 | 354.6 |
| D | 1 | 52 | 859890 | 2421.09 | 1477 | 1433 | 354.6 |
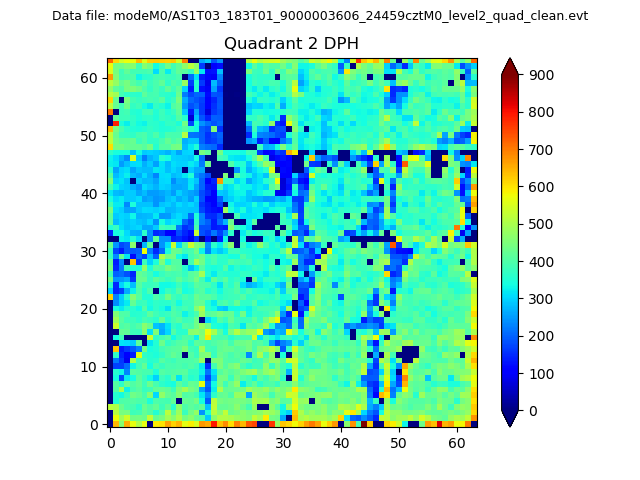
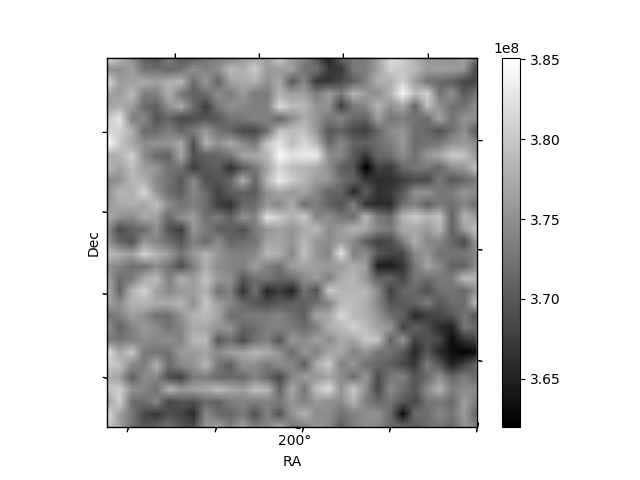
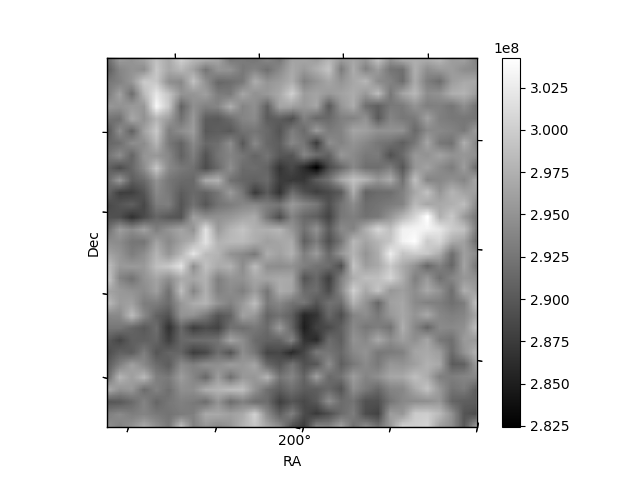
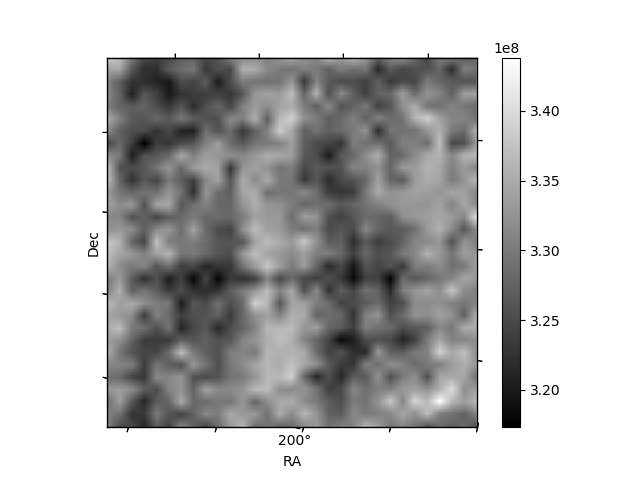
Histogram calculated using DETX and DETY for each event in the final _common_clean file
| Quadrant A | 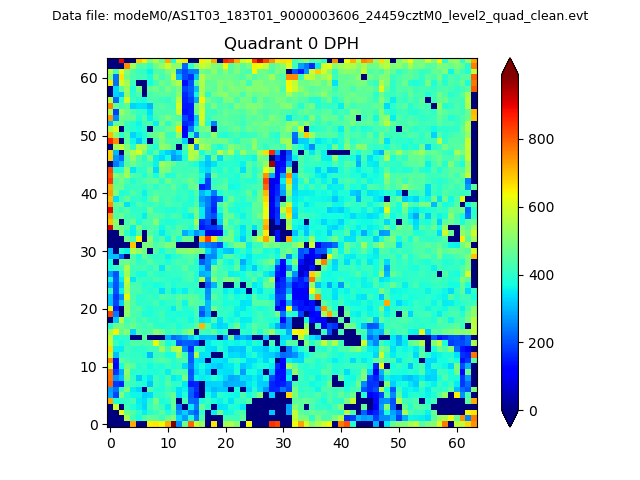 |
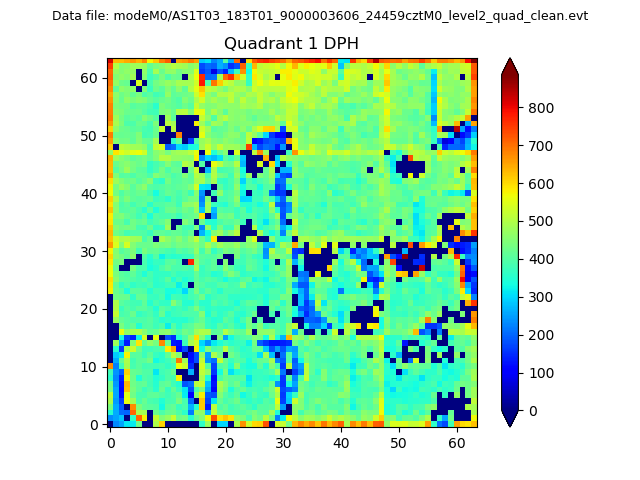 |
Quadrant B |
|---|---|---|---|
| Quadrant D | 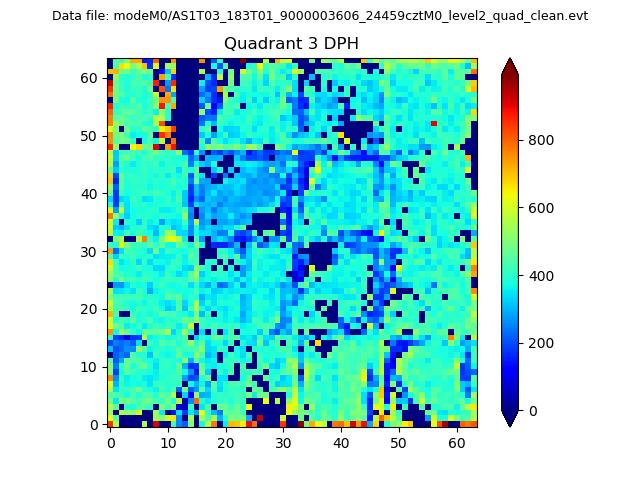 |
 |
Quadrant C |
| Plot type | Count rate plots | Images |
|---|---|---|
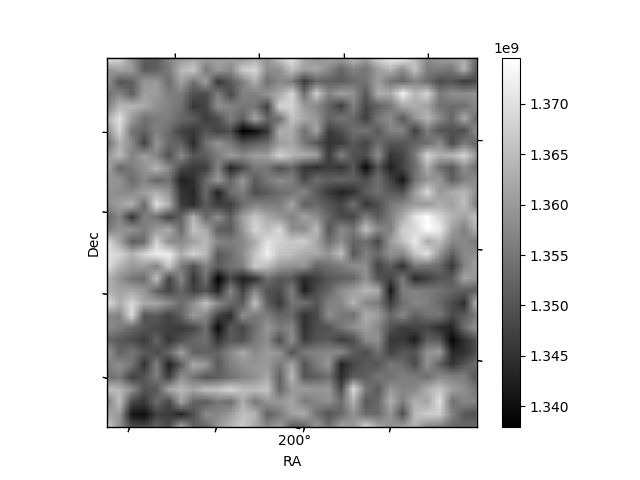
| Comparison with Poisson distribution Blue bars denote a histogram of data divided into 1 sec bins. Red curve is a Poisson curve with rate = median count rate of data. |
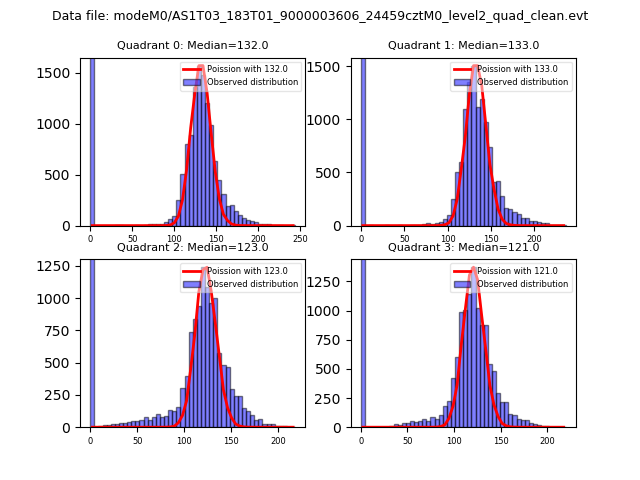 |
 |
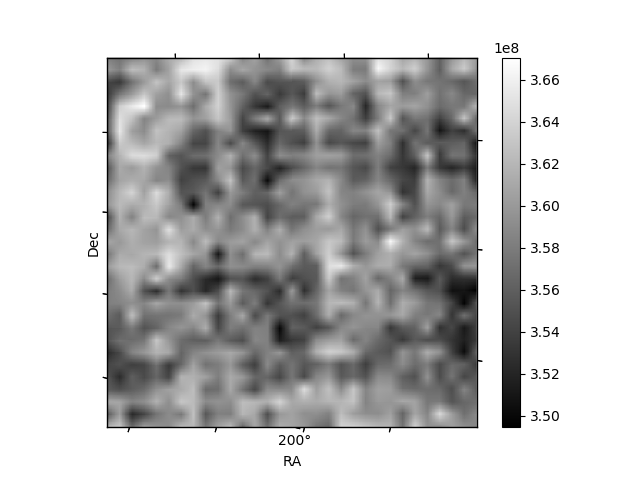
| Quadrant-wise count rates Data is divided into 100 sec bins |
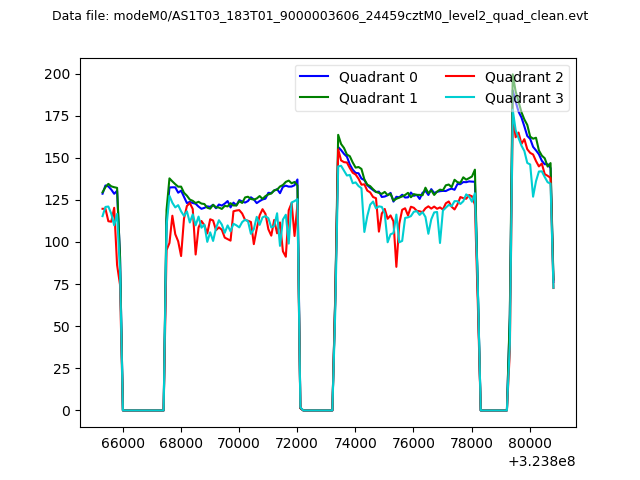 |
|
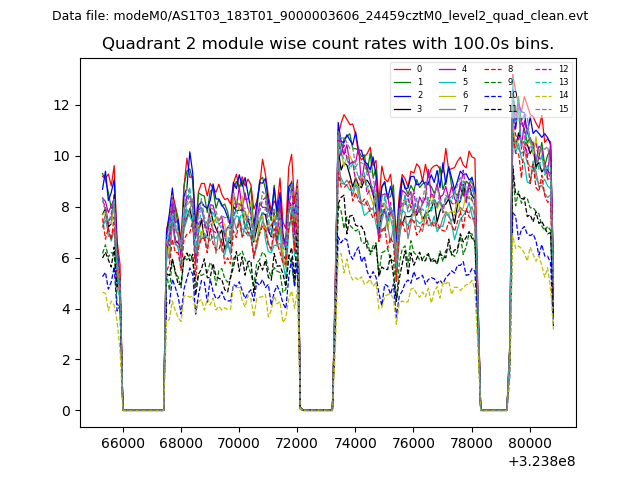
| Module-wise count rates for Quadrant A Data is divided into 100 sec bins |
 |
 |
| Module-wise count rates for Quadrant B Data is divided into 100 sec bins |
 |
 |
| Module-wise count rates for Quadrant C Data is divided into 100 sec bins |
 |
 |
| Module-wise count rates for Quadrant D Data is divided into 100 sec bins |
 |
 |
| Parameter | Plot |
|---|---|
| CZT HV Monitor |  |
| D_VDD | 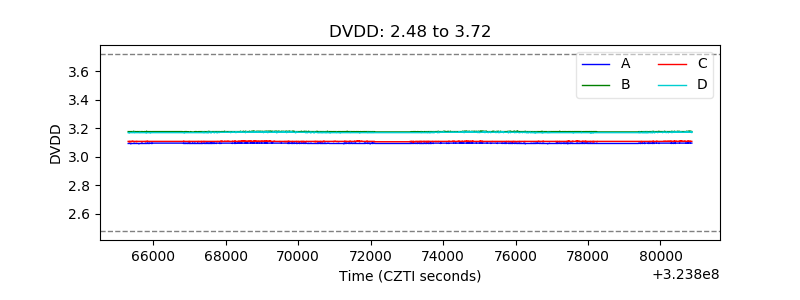 |
| Temperature 1 | 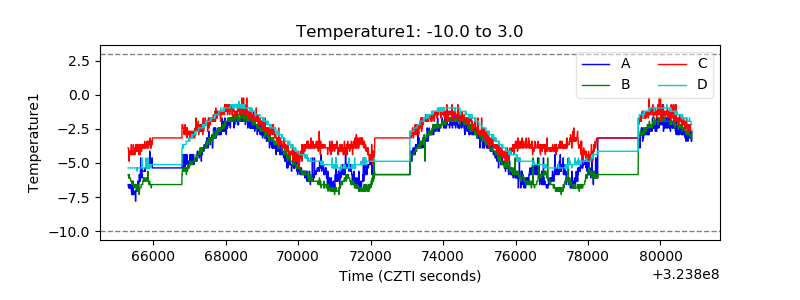 |
| Veto HV Monitor | 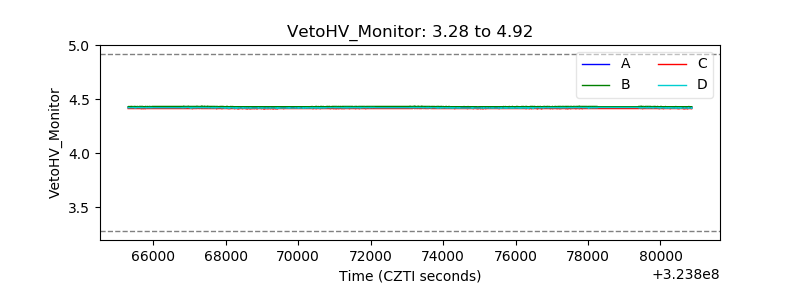 |
| Veto LLD |  |
| Alpha Counter | 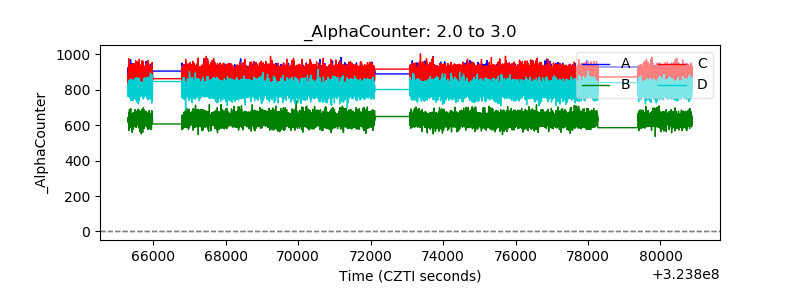 |
| _CPM_Rate | 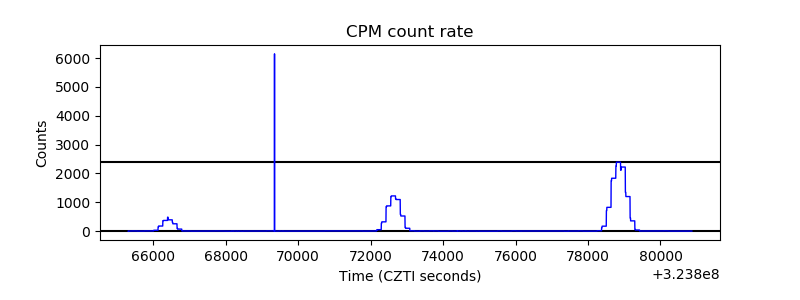 |
| CZT Counter | 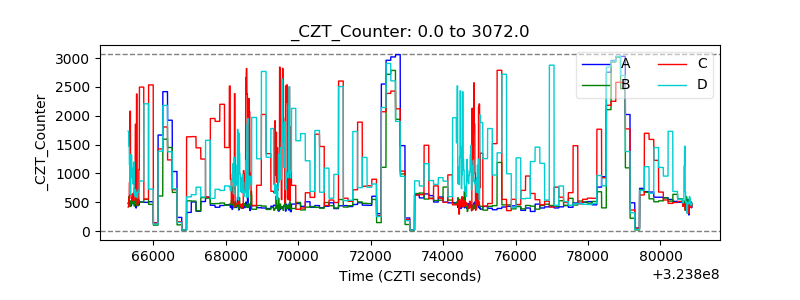 |
| +2.5 Volts monitor |  |
| +5 Volts monitor |  |
| _ROLL_ROT | 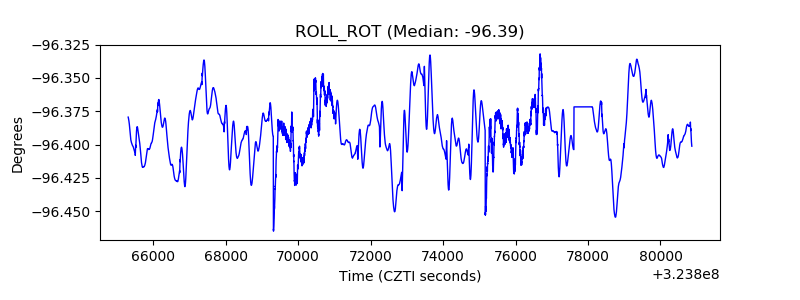 |
| _Roll_DEC | 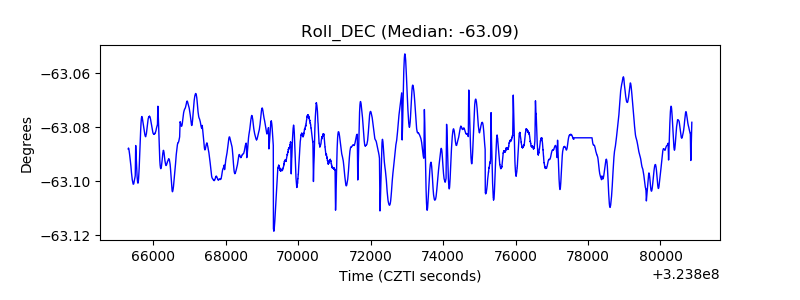 |
| _Roll_RA | 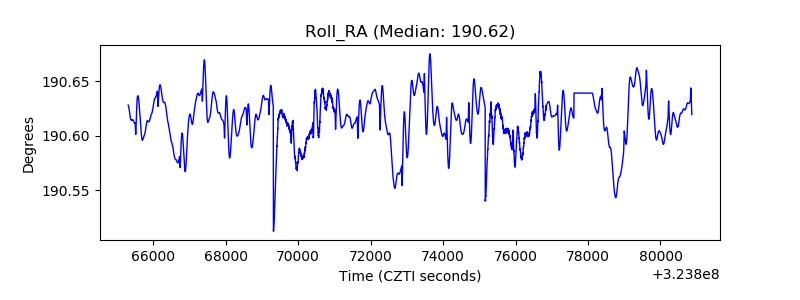 |
| Veto Counter |  |