| Param | Original file | Final file |
|---|---|---|
| Filename | modeM0/AS1T03_183T01_9000003606_24460cztM0_level2.evt | modeM0/AS1T03_183T01_9000003606_24460cztM0_level2_quad_clean.evt |
| Size (bytes) | 3,395,831,040 | 674,101,440 |
| Size | 3.2 GB | 642.9 MB |
| Events in quadrant A | 18,560,865 | 4,585,542 |
| Events in quadrant B | 19,695,438 | 4,636,403 |
| Events in quadrant C | 27,870,103 | 4,284,351 |
| Events in quadrant D | 34,035,092 | 4,176,262 |
| Mode M0 | |||
|---|---|---|---|
| Quadrant | BADHDUFLAG | Total packets | Discarded packets |
| A | 0 | 82222 | 8 |
| B | 0 | 84601 | 7 |
| C | 0 | 109100 | 7 |
| D | 0 | 129016 | 10 |
| Mode SS | |||
|---|---|---|---|
| Quadrant | BADHDUFLAG | Total packets | Discarded packets |
| A | 0 | 808 | 0 |
| B | 0 | 808 | 0 |
| C | 0 | 808 | 0 |
| D | 0 | 808 | 0 |
| Mode M9 | |||
|---|---|---|---|
| Quadrant | BADHDUFLAG | Total packets | Discarded packets |
| A | 0 | 56 | 0 |
| B | 0 | 56 | 0 |
| C | 0 | 56 | 0 |
| D | 0 | 56 | 0 |
| Quadrant | Total seconds | Saturated seconds | Saturation percentage |
|---|---|---|---|
| A | 39840 | 438 | 1.099398% |
| B | 39841 | 680 | 1.706784% |
| C | 39841 | 3175 | 7.969177% |
| D | 39840 | 2911 | 7.306727% |
Noise dominated data is calculated using 1-second bins in cleaned event files. If a bin has >2000 counts, and if more than 50% of those come from <1% of pixels, then it is considered to be noise-dominated and hence unusable.
| Quadrant | # 1 sec bins | Bins with >0 counts | Bins with >2000 counts | High rate bins dominated by noise | Noise dominated (total time) | Noise dominated (detector-on time) | Marked lightcurve |
|---|---|---|---|---|---|---|---|
| A | 45459 | 39849 | 0 | 0 | 0.00% | 0.00% | 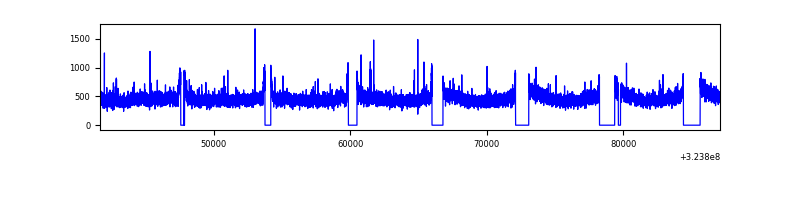 |
| B | 45460 | 39850 | 114 | 114 | 0.25% | 0.29% | 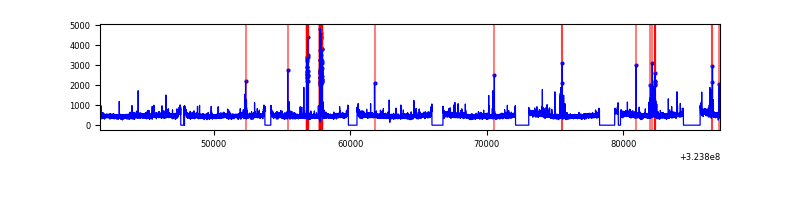 |
| C | 45460 | 39850 | 1581 | 1581 | 3.48% | 3.97% | 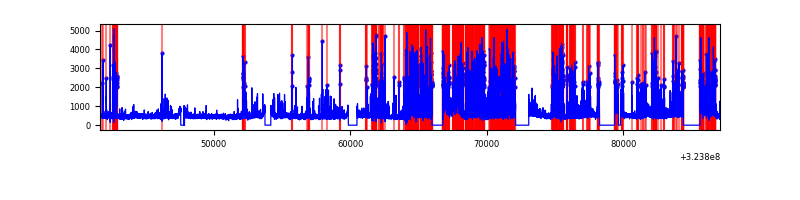 |
| D | 45460 | 39848 | 2292 | 2292 | 5.04% | 5.75% | 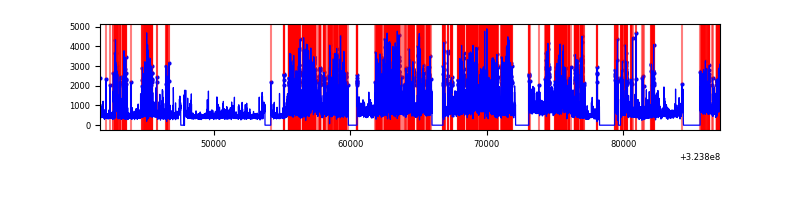 |
Top three noisy pixels from each quadrant. If the there are fewer than three noisy pixels in the level2.evt file, extra rows are filled as -1
| Pixel properties | Quadrant properties | ||||||
|---|---|---|---|---|---|---|---|
| Quadrant | DetID | PixID | Counts | Sigma | Mean | Median | Sigma |
| A | 4 | 2 | 62581 | 60.41 | 4801 | 4696 | 958.3 |
| A | 13 | 254 | 59957 | 57.67 | 4801 | 4696 | 958.3 |
| A | 3 | 137 | 43632 | 40.63 | 4801 | 4696 | 958.3 |
| B | 5 | 172 | 363204 | 399.86 | 4779 | 4653 | 896.7 |
| B | 3 | 64 | 287698 | 315.66 | 4779 | 4653 | 896.7 |
| B | 7 | 202 | 139254 | 150.11 | 4779 | 4653 | 896.7 |
| C | 2 | 16 | 9126260 | 8811.88 | 4487 | 4514 | 1035.2 |
| C | 14 | 238 | 716979 | 688.26 | 4487 | 4514 | 1035.2 |
| C | 10 | 9 | 341407 | 325.45 | 4487 | 4514 | 1035.2 |
| D | 7 | 238 | 6801000 | 6206.95 | 4548 | 4413 | 1095.0 |
| D | 12 | 218 | 6014054 | 5488.28 | 4548 | 4413 | 1095.0 |
| D | 1 | 52 | 1984225 | 1808.05 | 4548 | 4413 | 1095.0 |
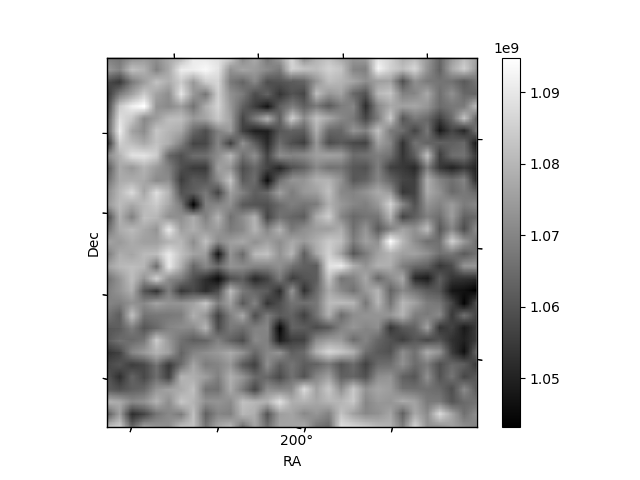
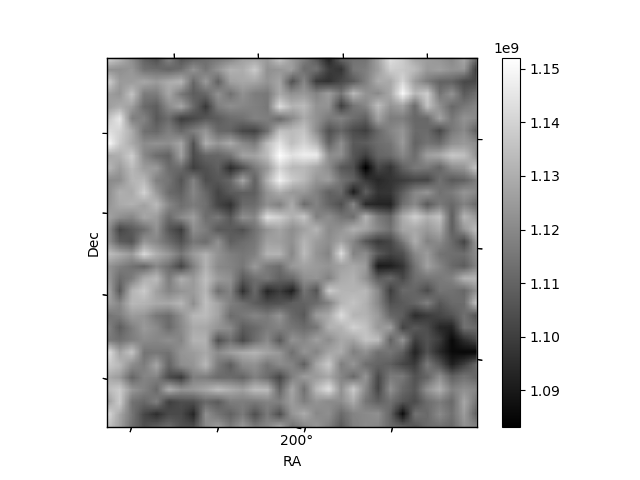
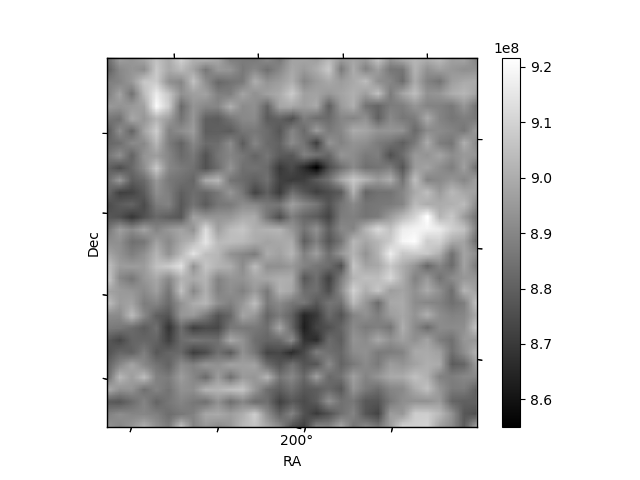
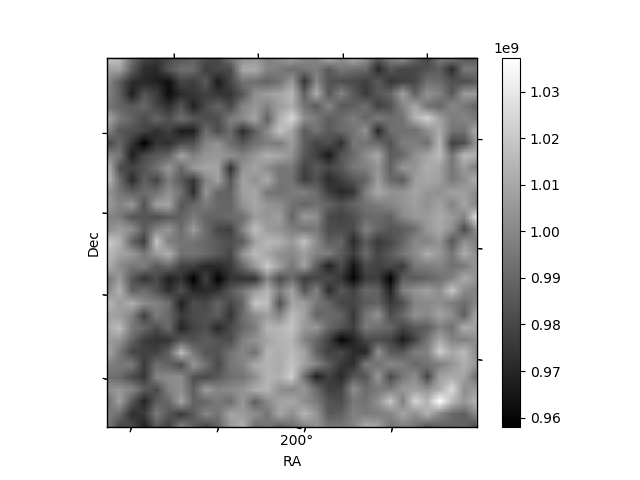
Histogram calculated using DETX and DETY for each event in the final _common_clean file
| Quadrant A | 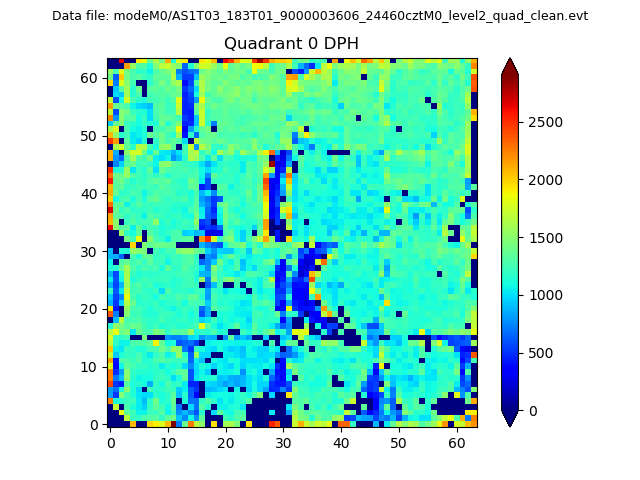 |
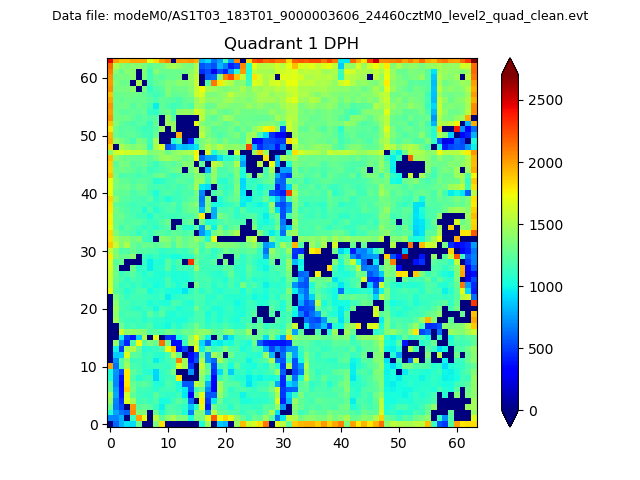 |
Quadrant B |
|---|---|---|---|
| Quadrant D |  |
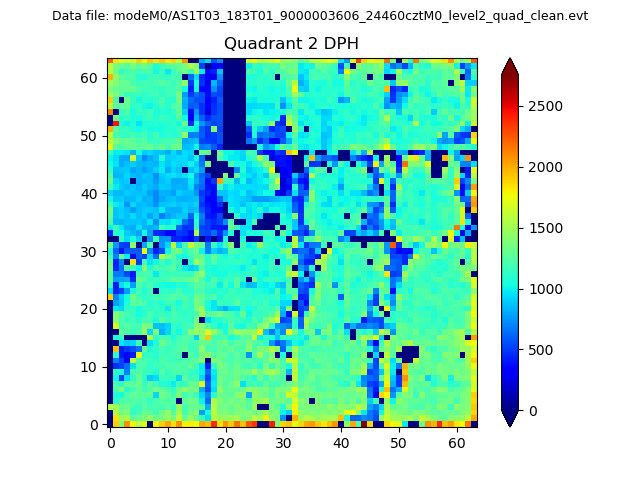 |
Quadrant C |
| Plot type | Count rate plots | Images |
|---|---|---|
| Comparison with Poisson distribution Blue bars denote a histogram of data divided into 1 sec bins. Red curve is a Poisson curve with rate = median count rate of data. |
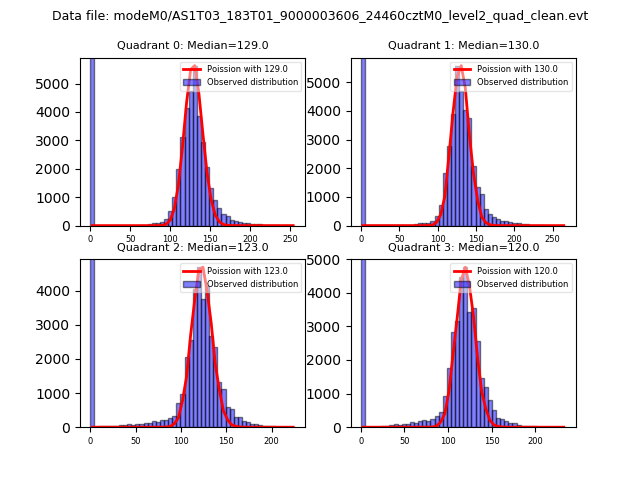 |
 |
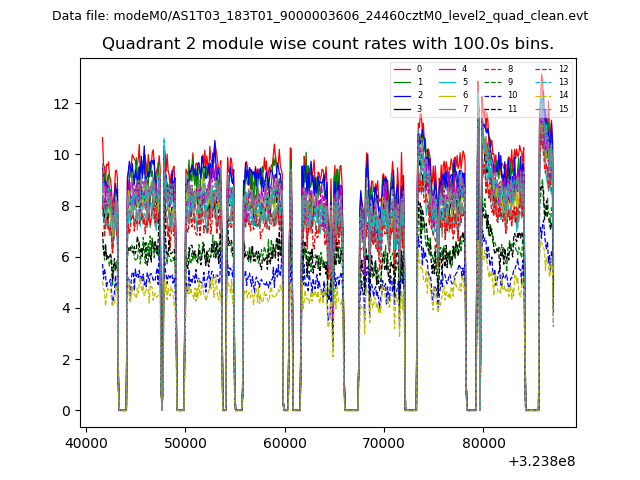
| Quadrant-wise count rates Data is divided into 100 sec bins |
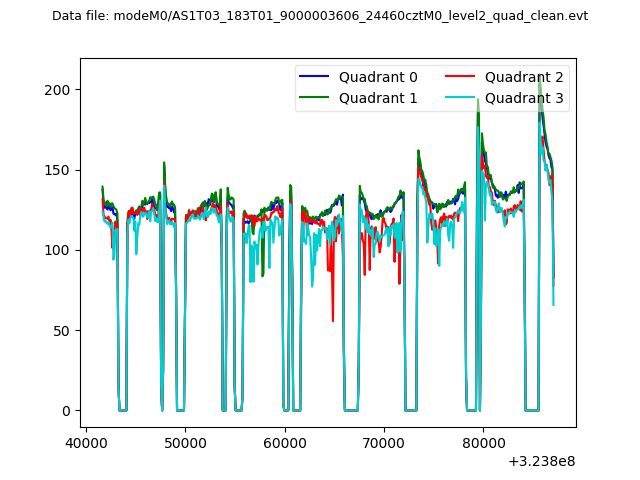 |
|
| Module-wise count rates for Quadrant A Data is divided into 100 sec bins |
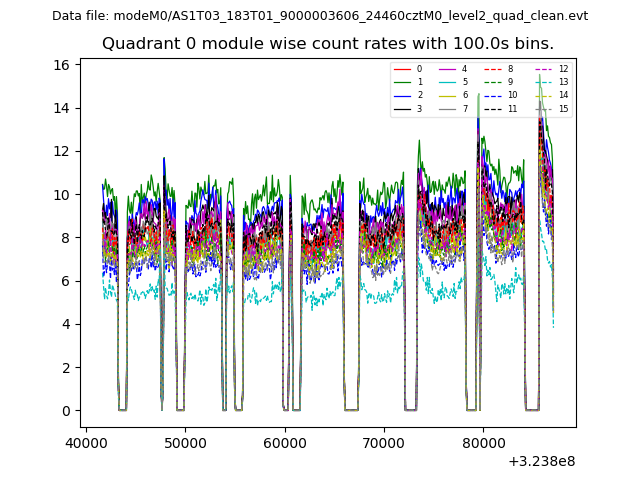 |
 |
| Module-wise count rates for Quadrant B Data is divided into 100 sec bins |
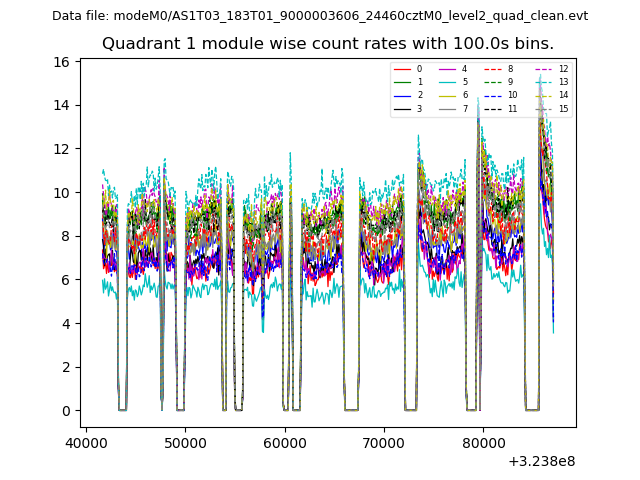 |
 |
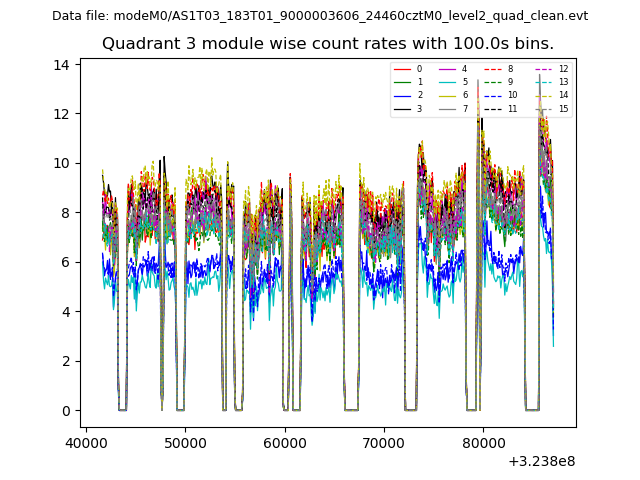
| Module-wise count rates for Quadrant C Data is divided into 100 sec bins |
 |
 |
| Module-wise count rates for Quadrant D Data is divided into 100 sec bins |
 |
 |
| Parameter | Plot |
|---|---|
| CZT HV Monitor | 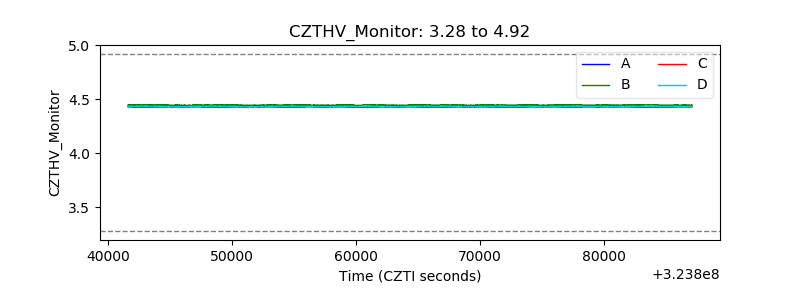 |
| D_VDD | 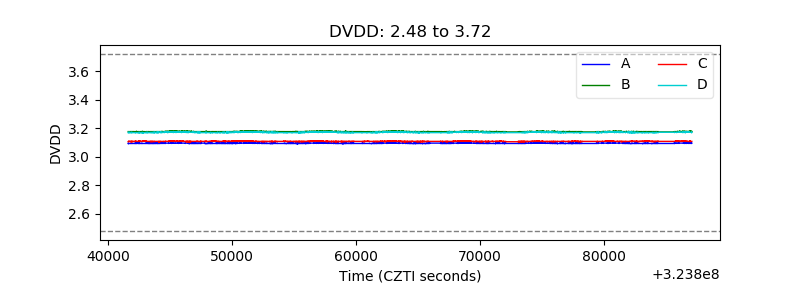 |
| Temperature 1 | 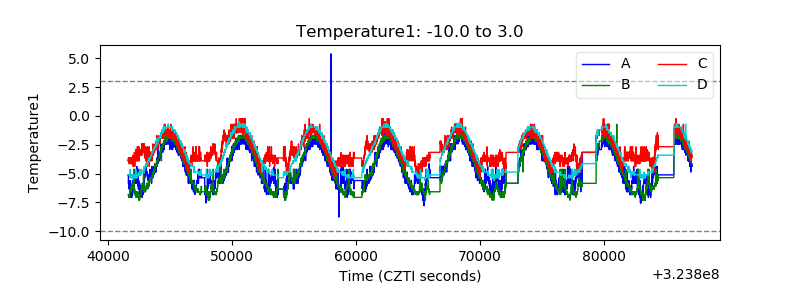 |
| Veto HV Monitor |  |
| Veto LLD | 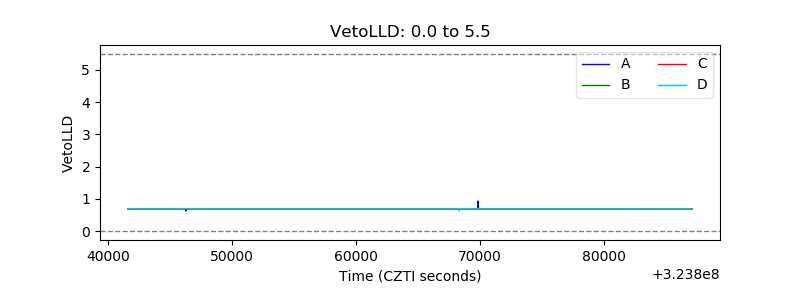 |
| Alpha Counter | 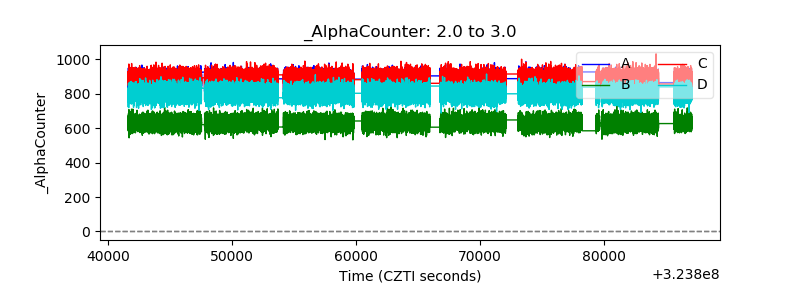 |
| _CPM_Rate | 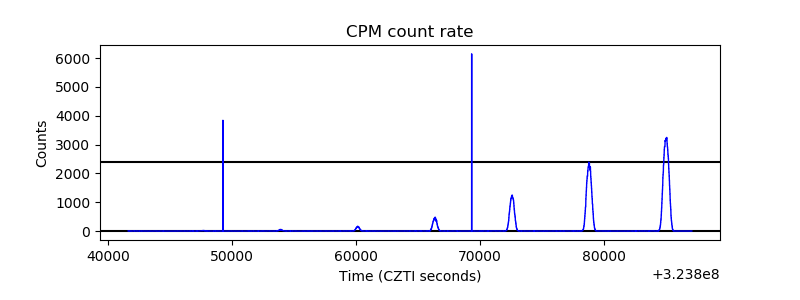 |
| CZT Counter | 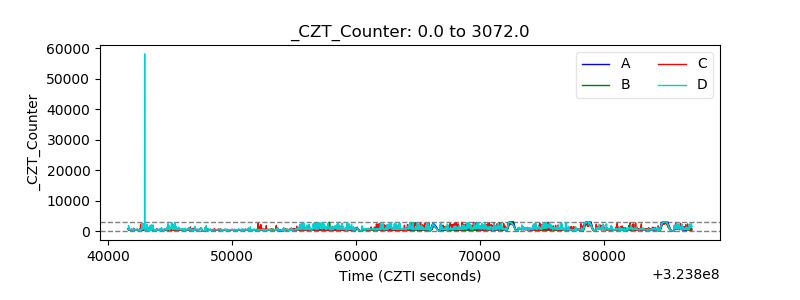 |
| +2.5 Volts monitor | 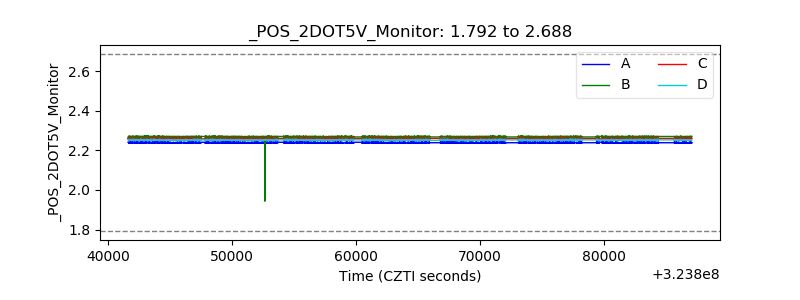 |
| +5 Volts monitor |  |
| _ROLL_ROT | 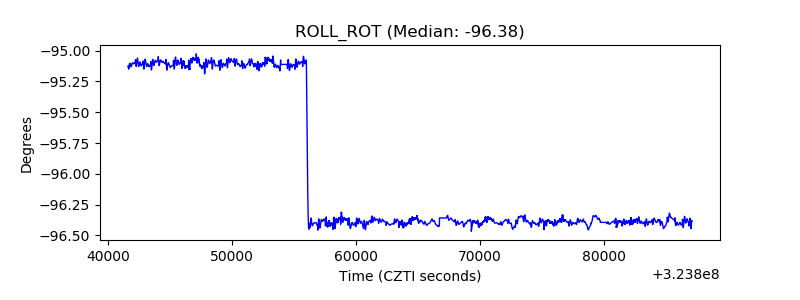 |
| _Roll_DEC | 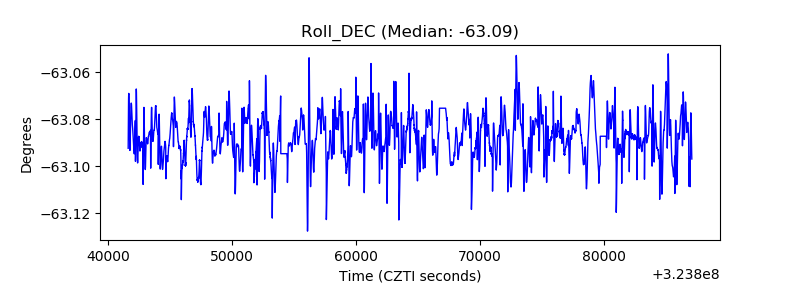 |
| _Roll_RA | 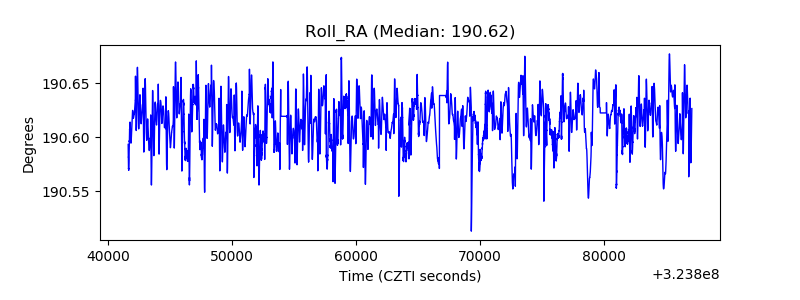 |
| Veto Counter | 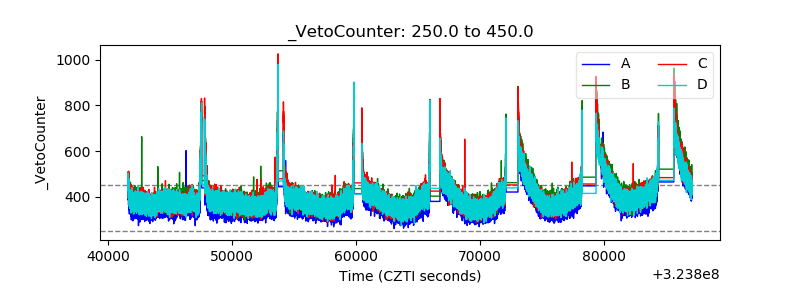 |